When treating patients with cardiovascular risk factors, their quantification can help tailor treatment goals and intensity to individual circumstances.1 The most widely used system for quantifying cardiovascular risk factors in Europe is the SCORE system, which is recognized by the 2016 European Guidelines on cardiovascular prevention and the 2016 European guidelines for the management of dyslipidaemias.2 These guidelines concur on the value of calculating relative risk (RR) and vascular age (VA), particularly in young patients. Clinicians can now consult specific VA charts derived from the SCORE charts3 or a single, sex-specific, cardiovascular disease relative risk (RR) chart that is valid for patients of any age.1,2 The relationship between RR and VA or any other VA-derived indicators, however, has not been studied.
Avoidable lost life years (ALLY) are defined as the difference between chronological age (CA) and VA (ALLY = VA - CA). As ALLY vary according to CA, a second concept, RALLY (ratio of avoidable lost life years), can be used to measure the ratio between ALLY and CA (RALLY = ALLY/CA).
Vascular aging, or vascular speed (VS), in turn, refers to the relationship between VA and CA (VS = VA/CA). It is expressed as a percentage. Based on the above definitions, VS is clearly related to RALLY. If ALLY = VA - CA and RALLY = ALLY/CA, then RALLY = (VA - CA)/CA. In other words, RALLY = (VA/CA - CA/CA) = VS – 1 and VS = 1 + RALLY.
This study had 2 objectives. The first was to determine whether a given RR would correspond to the same proportional number of ALLY at any age (remember that a single chart covers all ages for RR). In other words, we wanted to investigate whether there was an association between RR and RALLY. As RR is a risk ratio, we checked if there was a linear correlation between the logarithm of RR (LnRR) and RALLY. The second objective, assuming RR and RALLY were associated and knowing that VS is related to RALLY (VS=1+RALLY), was to create a single VS chart valid for all ages, similar to the RR chart. To do this, we performed multiple linear regression to investigate the association between VS and the following risk factors, which are all in the European guidelines RR chart: total cholesterol (TC), systolic blood pressure (SBP), and smoking (SMO). All calculations were performed separately for women and men.
A single, easy-to-interpret, VS chart would allow clinicians to calculate VA for any CA between the ages included in the original VA tables, as VA=CA × VS.
We investigated each of the 800 combinations of risk factors from the SCORE charts (countries [high or low risk], sex [male or female], age [40, 50, 55, 60, and 65 years], SMO [yes or no], high TC [4, 5, 6, 7, and 8 mmol/L], and SBP [120, 140, 160, and 180mmHg]). For each combination (equivalent to each box in the SCORE charts), we calculated absolute SCORE risk, RR, VA,3 ALLY, RALLY, and VS. The regression analysis was performed separately for women and men, as the absolute risk for each combination of factors varies considerably between sexes.
In the linear regression analysis that modeled the relationship between LnRR and RALLY, we obtained the following equations with a regression coefficient of r = 0.9969 and a coefficient of determination of r2 = 0.9937 for women. The respective coefficients for men were r = 0.9956 and r2 = 0.9913.
Women: RALLY = 0.1584 × LnRR (P < .001)
Men: RALLY = 0.2308 × LnRR (P < .001)
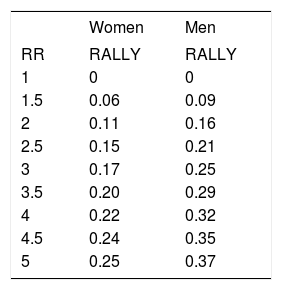
This strong correlation allowed us to establish equivalence between RR and RALLY (Table 1). As the table shows, an RR of 2 is associated with a RALLY of 0.11 for women (11% loss of available life years) and 0.16 for men (16% loss). Likewise, an RR of 5 means that a woman has lost a quarter of available life years, whereas a man has lost more than a third.
To fulfill the second objective, we calculated multiple linear correlations (by sex) between VS and TC in mmol/L, SBP in mmHg, and SMO (1 = yes, 0 = no).
A strongly significant correlation was observed for women, with r = 0.9902 (r2 = 0.9805) using the following equation:

The corresponding results for men were r = 0.9904 and r2 = 0.9809, with the following equation:

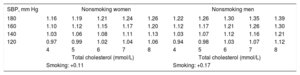
We then used these equations to build a VS chart (Table 2) with separate results for women and men. The chart takes into account both TC and SBP in addition to SMO, which must be added to the result in each box.
Vascular Aging or Speed (VS) Chart (VS = 1 + RALLY)
| SBP, mm Hg | Nonsmoking women | Nonsmoking men | ||||||||
|---|---|---|---|---|---|---|---|---|---|---|
| 180 | 1.16 | 1.19 | 1.21 | 1.24 | 1.26 | 1.22 | 1.26 | 1.30 | 1.35 | 1.39 |
| 160 | 1.10 | 1.12 | 1.15 | 1.17 | 1.20 | 1.12 | 1.17 | 1.21 | 1.26 | 1.30 |
| 140 | 1.03 | 1.06 | 1.08 | 1.11 | 1.13 | 1.03 | 1.07 | 1.12 | 1.16 | 1.21 |
| 120 | 0.97 | 0.99 | 1.02 | 1.04 | 1.06 | 0.94 | 0.98 | 1.03 | 1.07 | 1.12 |
| 4 | 5 | 6 | 7 | 8 | 4 | 5 | 6 | 7 | 8 | |
| Total cholesterol (mmol/L) | Total cholesterol (mmol/L) | |||||||||
| Smoking: +0.11 | Smoking: +0.17 | |||||||||
SBP, systolic blood pressure; RALLY, ratio of available lost life years.
Simple chart for directly calculating vascular age using cardiovascular risk factors. Vascular age is calculated by multiplying the patient's CA by the conversion factor (1 + RALLY) in the corresponding box. If the patient is a smoker, the smoking factor must be added to the result. Example 1: A nonsmoking man aged 45 years with an SBP of 160 mm Hg and a total cholesterol level of 6 mmol/L would have a vascular age of 45 × 1.21 = 54.5 years; in other words, he would have a vascular aging speed of 121%. Example 2: A smoking woman aged 47 years with an SBP of 140 mm Hg and a total cholesterol level of 7 mmol/L would have a vascular age of 47 × (1.11 + 0.11) = 57.3 years; in other words, she would have a vascular aging speed of 122%.
This study provides several findings. First, RR is associated with RALLY, which is derived from VA. Second, this association differs in men and women. Third, we have created a simple VS chart that may help to explain individual risk when counseling patients. Finally, the VS chart provides a simple means of calculating VA for patients of any CA.
VS could be a useful criterion in the treatment of patients with cardiovascular risk factors. This remains to be investigated in a future study.