
The concept of metabolically healthy but obese (MHO) reflects a group of obese individuals who seem to be protected against many obesity-related cardiometabolic complications. Characterizing this subgroup of obese individuals and distinguishing them from the metabolically unhealthy obese and the nonobese (either metabolically healthy or unhealthy) is of major clinical and public health interest. Because traditional cardiometabolic markers (such as dyslipidemia, insulin resistance, or hypertension) are used in the definition of MHO, it is important to assess other nontraditional biomarkers (such as apolipoproteins, inflammatory or renal markers), which could further explain the differences observed among the different body-size phenotypes. In addition, the role of sex and physical activity (PA; including domestic PA) in the metabolic status of obese individuals warrants particular attention.
This study assessed: a) the differences in nontraditional cardiometabolic risk markers across the 4 aforementioned body-size phenotypes; b) whether sex differences exist; and c) the extent to which PA levels may play a role in the cardiometabolic profile.
The complete methodology of this population-based cross-sectional study entirely conducted in the province of Badajoz (Extremadura; southwest Spain) has been published elsewhere.1 Of 2833 participants, 135 were excluded due to previous cardiovascular event (ie, myocardial infarction, angina, or stroke). A total of 2698 participants (aged 25-79 years) were finally included.
Age, educational and occupational status, smoking and alcohol consumption were registered through personal interview. Systolic and diastolic blood pressures were measured according to the European Society of Hypertension. Resting heart rate was measured from the radial pulse for 30seconds. Plasma insulin, apolipoproteins A and B, high-sensitivity C-reactive protein, glycosylated hemoglobin, triglycerides, high-density lipoprotein cholesterol, low-density lipoprotein cholesterol, total cholesterol, glucose, urea, albumin, creatinine, and fibrinogen concentrations were measured by standard procedures. The albumin-creatinine ratio and estimated glomerular filtration rate were also determined.
Leisure time PA was self-reported through the Minnesota Leisure Time Physical Activity Questionnaire. Participants were classified as physically active if they met the PA guidelines (ie, total PA energy expenditure ≥ 500 metabolic equivalents per week).
We defined metabolically healthy or unhealthy in accordance with the Consensus Societies for the definition of metabolic syndrome, and classified individuals into 4 body-size phenotype (ie, obese or nonobese, metabolically healthy or unhealthy). Obesity was defined as body mass index ≥ 30kg/m2 and waist circumference was excluded from the criteria.2
One-way analysis of covariance (ANCOVA) was used to assess the differences in cardiometabolic markers across body-size phenotypes after adjustment for age, sex, smoking, alcohol consumption, and educational status. Sex differences were assessed using ANCOVA with the aforementioned covariates. The Bonferroni correction for multiple comparisons was applied.
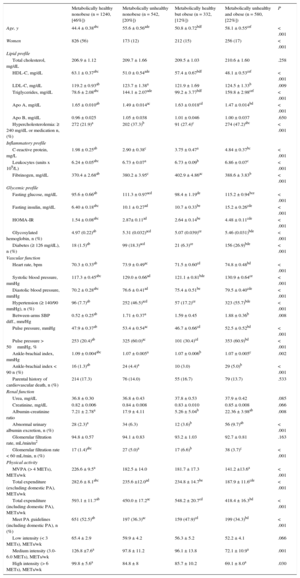
The prevalence of MHO was 12% (36% among the obese). Women had a higher prevalence of MHO (15% vs 10%, respectively) and metabolically healthy nonobese (71% vs 44%) phenotypes than men (both P < .001, Tableand Figure 1 of the supplementary material). Men had a more impaired cardiometabolic profile and lower PA levels than women (all P < .001, Table and Figure 2 of the supplementary material). Despite the expectable differences in traditional markers of metabolic syndrome, the MHO group was younger and had higher plasma apolipoprotein A and lower triglycerides, low-density lipoprotein cholesterol, glycosylated hemoglobin, resting heart rate and pulse pressure than both metabolically unhealthy obese and nonobese (Table and Figure). The inflammatory profile was more impaired in all the groups in comparison to the metabolically healthy nonobese (Table). The MHO group had a more favorable renal profile (lower prevalence of abnormal urinary albumin excretion and albumin-creatinine ratio) than the metabolically unhealthy obese (Table). Finally, the obese and the metabolically unhealthy groups showed lower total energy expenditure in PA and less fulfillment of the PA recommendations than the MHO group (P < .001, Table).
Cardiometabolic and Physical Activity Parameters by Body-size Phenotype
| Metabolically healthy nonobese (n = 1240, [46%]) | Metabolically unhealthy nonobese (n = 542, [20%]) | Metabolically healthy but obese (n = 332, [12%]) | Metabolically unhealthy and obese (n = 580, [22%]) | P | |
|---|---|---|---|---|---|
| Age, y | 44.4 ± 0.38abc | 55.6 ± 0.56ade | 50.8 ± 0.72bdf | 58.1 ± 0.55cef | < .001 |
| Women | 826 (56) | 173 (12) | 212 (15) | 256 (17) | < .001 |
| Lipid profile | |||||
| Total cholesterol, mg/dL | 206.9 ± 1.12 | 209.7 ± 1.66 | 209.5 ± 1.03 | 210.6 ± 1.60 | .258 |
| HDL-C, mg/dL | 63.1 ± 0.37abc | 51.0 ± 0.54ade | 57.4 ± 0.67bdf | 48.1 ± 0.53cef | < .001 |
| LDL-C, mg/dL | 119.2 ± 0.93ab | 123.7 ± 1.38a | 121.9 ± 1.69 | 124.5 ± 1.33b | .009 |
| Triglycerides, mg/dL | 78.6 ± 2.08abc | 144.1 ± 2.07ade | 99.2 ± 3.77bdf | 159.8 ± 2.98cef | < .001 |
| Apo A, mg/dL | 1.65 ± 0.010ab | 1.49 ± 0.014ac | 1.63 ± 0.018cd | 1.47 ± 0.014bd | < .001 |
| Apo B, mg/dL | 0.96 ± 0.025 | 1.05 ± 0.038 | 1.01 ± 0.046 | 1.00 ± 0.037 | .650 |
| Hypercholesterolemia: ≥ 240 mg/dL or medication n, (%) | 272 (21.9)a | 202 (37.3)b | 91 (27.4)c | 274 (47.2)abc | < .001 |
| Inflammatory profile | |||||
| C-reactive protein, mg/L | 1.98 ± 0.25ab | 2.90 ± 0.38c | 3.75 ± 0.47a | 4.84 ± 0.37bc | < .001 |
| Leukocytes (units x 109/L) | 6.24 ± 0.05abc | 6.73 ± 0.07a | 6.73 ± 0.09b | 6.86 ± 0.07c | < .001 |
| Fibrinogen, mg/dL | 370.4 ± 2.68ab | 380.2 ± 3.95c | 402.9 ± 4.86ac | 388.6 ± 3.83b | < .001 |
| Glycemic profile | |||||
| Fasting glucose, mg/dL | 95.6 ± 0.66ab | 111.3 ± 0.97acd | 98.4 ± 1.19de | 115.2 ± 0.94bce | < .001 |
| Fasting insulin, mg/dL | 6.40 ± 0.18abc | 10.1 ± 0.27ad | 10.7 ± 0.33be | 15.2 ± 0.26cde | < .001 |
| HOMA-IR | 1.54 ± 0.08abc | 2.87± 0.11ad | 2.64 ± 0.14be | 4.48 ± 0.11cde | < .001 |
| Glycosylated hemoglobin, n (%) | 4.97 (0.22)ab | 5.31 (0.032)acd | 5.07 (0.039)ce | 5.46 (0.031)bde | < .001 |
| Diabetes (≥ 126 mg/dL), n (%) | 18 (1.5)ab | 99 (18.3)acd | 21 (6.3)ce | 156 (26.9)bde | < .001 |
| Vascular function | |||||
| Heart rate, bpm | 70.3 ± 0.33ab | 73.9 ± 0.49ac | 71.5 ± 0.60cd | 74.8 ± 0.48bd | < .001 |
| Systolic blood pressure, mmHg | 117.3 ± 0.45abc | 129.0 ± 0.66ad | 121.1 ± 0.81bde | 130.9 ± 0.64ce | < .001 |
| Diastolic blood pressure, mmHg | 70.2 ± 0.28abc | 76.6 ± 0.41ad | 75.4 ± 0.51be | 79.5 ± 0.40cde | < .001 |
| Hypertension (≥ 140/90 mmHg), n (%) | 96 (7.7)ab | 252 (46.5)acd | 57 (17.2)ce | 323 (55.7)bde | < .001 |
| Between-arms SBP diff., mm/Hg | 0.52 ± 0.25ab | 1.71 ± 0.37a | 1.59 ± 0.45 | 1.88 ± 0.36b | .008 |
| Pulse pressure, mmHg | 47.9 ± 0.37ab | 53.4 ± 0.54ac | 46.7 ± 0.66cd | 52.5 ± 0.52bd | < .001 |
| Pulse pressure > 50mmHg, % | 253 (20.4)ab | 325 (60.0)ac | 101 (30.4)cd | 353 (60.9)bd | < .001 |
| Ankle-brachial index, mmHg | 1.09 ± 0.004abc | 1.07 ± 0.005a | 1.07 ± 0.006b | 1.07 ± 0.005c | .002 |
| Ankle-brachial index < 90 n (%) | 16 (1.3)ab | 24 (4.4)a | 10 (3.0) | 29 (5.0)b | < .001 |
| Parental history of cardiovascular death, n (%) | 214 (17.3) | 76 (14.0) | 55 (16.7) | 79 (13.7) | .533 |
| Renal function | |||||
| Urea, mg/dL | 36.8 ± 0.30 | 36.8 ± 0.43 | 37.8 ± 0.53 | 37.9 ± 0.42 | .085 |
| Creatinine, mg/dL | 0.82 ± 0.006 | 0.84 ± 0.008 | 0.83 ± 0.010 | 0.85 ± 0.008 | .066 |
| Albumin-creatinine ratio | 7.21 ± 2.78a | 17.9 ± 4.11 | 5.26 ± 5.04b | 22.36 ± 3.98ab | .008 |
| Abnormal urinary albumin excretion, n (%) | 28 (2.3)a | 34 (6.3) | 12 (3.6)b | 56 (9.7)ab | < .001 |
| Glomerular filtration rate, mL/min/m2 | 94.8 ± 0.57 | 94.1 ± 0.83 | 93.2 ± 1.03 | 92.7 ± 0.81 | .163 |
| Glomerular filtration rate < 60 mL/min, n (%) | 17 (1.4)abc | 27 (5.0)a | 17 (6.6)b | 38 (3.7)c | < .001 |
| Physical activity | |||||
| MVPA (> 4 METs), METs/wk | 226.6 ± 9.5a | 182.5 ± 14.0 | 181.7 ± 17.3 | 141.2 ±13.6a | < .001 |
| Total expenditure (excluding domestic PA), METs/wk | 282.6 ± 8.1abc | 235.6 ±12.0ad | 234.8 ± 14.7be | 187.9 ± 11.6cde | < .001 |
| Total expenditure (including domestic PA), METs/wk | 593.1 ± 11.7ab | 450.0 ± 17.2ac | 548.2 ± 20.7cd | 418.4 ± 16.3bd | < .001 |
| Meet PA guidelines (including domestic PA), n (%) | 651 (52.5)ab | 197 (36.3)ac | 159 (47.9)cd | 199 (34.3)bd | < .001 |
| Low intensity (< 3 METs), METs/wk | 65.4 ± 2.9 | 59.9 ± 4.2 | 56.3 ± 5.2 | 52.2 ± 4.1 | .066 |
| Medium intensity (3.0-6.0 METs), METs/wk | 126.8 ±7.6a | 97.8 ± 11.2 | 96.1 ± 13.8 | 72.1 ± 10.9a | .001 |
| High intensity (> 6 METs), METs/wk | 99.8 ± 5.6a | 84.8 ± 8 | 85.7 ± 10.2 | 69.1 ± 8.0a | .030 |
Apo A, apolipoprotein A; Apo B, apolipoprotein B; HDL-C, high-density lipoprotein cholesterol; HOMA-IR, homeostatic model assessment for insulin resistance; LDL-C, low-density lipoprotein cholesterol, PA, physical activity; MET, metabolic equivalent of task; MVPA, moderate-vigorous physical activity; SBP, systolic blood pressure; wk, week. 1 MET = 3.5mL of oxygen uptake/kg/min.
Values shown as mean ± standard error unless otherwise indicated; analyses were performed with ANCOVA with age, sex, smoking (yes/no), alcohol consumption (mL) and educational status as covariables; upper case a,b,c,d,e,f letters in the same row indicates a significant pairwise difference (P < .05) between groups with the same letter. The Bonferroni correction for multiple comparisons was applied to analyze pairwise differences.
 adverse lipid profile (A), glycemic profile (B), vascular function (C) and renal function (D) by phenotype groups and sex. Dots represent mean ± standard error. a,b,c,d,e,f Letters indicate a pairwise significant difference (P < .05) for each sex between phenotype groups with the same letter. The model (1-way analysis of covariance) was adjusted for age, educational status, smoking, and alcohol consumption. Pairwise comparisons were performed with Bonferroni")
Clustered (z-score) adverse lipid profile (A), glycemic profile (B), vascular function (C) and renal function (D) by phenotype groups and sex. Dots represent mean ± standard error. a,b,c,d,e,f Letters indicate a pairwise significant difference (P < .05) for each sex between phenotype groups with the same letter. The model (1-way analysis of covariance) was adjusted for age, educational status, smoking, and alcohol consumption. Pairwise comparisons were performed with Bonferroni's adjustment. Adverse lipid profile consisted of the standardized scores [(value-mean)/standard deviation] of plasma triglycerides, LDL-C, Apo B and inverted HDL-C and Apo A (A). Adverse glycemic profile consisted of fasting glucose, insulin and glycosylated hemoglobin (B). Adverse vascular profile consisted of resting hearth rate, systolic and diastolic blood pressure (C). Adverse renal profile comprised plasma urea and creatinine and urinary microalbumin and inverted glomerular filtration rate (D). Apo A, apolipoprotein A; Apo B, apolipoprotein B; HDL-C, high-density lipoprotein cholesterol; LDL-C, low-density lipoprotein cholesterol.
The MHO participants showed higher levels of all-type PA and a higher proportion of individuals meeting the PA guidelines than metabolically unhealthy obese. Other studies revealed that MHO individuals spend less time in sedentary behavior and more time in light PA and active commuting than metabolically unhealthy obese.3
A major finding of this study is that women had higher PA levels (especially when domestic PA was accounted for) and this could partially explain the higher proportion of MHO observed among women. Similarly, the higher PA levels observed among women could partly explain the more favorable cardiometabolic profile observed in women regardless of the body-size phenotype.4 Indeed, most women were housewives and they spent 10 times more energy in domestic PA than men, which could imply a substantial reduction in cardiometabolic risk. This hypothesis is supported by previous studies reporting that light household PA is associated with lower cardiovascular and all-cause mortality.5
Our results reinforce the idea that PA might play an important role on the MHO phenotype and its prognosis.
The cross-sectional design and lack of objective assessment of PA, physical fitness, fatness and nutritional patterns are limitations of this study that should be considered in future studies.
Since low PA is a common feature of the metabolically unhealthy obese phenotype, PA or exercise programs could play an important role in this population. In addition, further research is needed to determine whether increasing PA among MHO individuals might prevent the transition from MHO to a metabolically unhealthy status or promote the opposite, which has been previously reported to occur.6
FUNDINGThis study was funded by the projects PI-071218, EMER-07/046 and INT-07/28, 09/030. V.A. Aparicio was supported by the Andalucía Talent-Hub Program (COFUND–Grant Agreement-n°291780). A. Soriano-Maldonado (FPU12/00963) was supported by the Spanish Ministry of Education, Culture and Sport.