Heart failure (HF) is a syndrome whose already high prevalence and incidence have increased in recent years. Although there are various HF-related registries in Spain,1,2 few provide an overall picture, with most data being derived from specialized hospitals or units, with the possible associated biases. To study temporal trends in hospitalization and in-hospital mortality due to HF in Spain as a whole and according to autonomous community (AC), we have used the Spanish hospital Minimum Data Set (MDS)3 to analyze all discharges with the principal diagnosis of HF recorded in Spanish public hospitals between 2003 and 2015.3 The study population was based on hospitalization episodes recorded in the MDS between January 1, 2003, and December 31, 2015. The analysis included patients with the principal diagnosis of HF according to ICD-9-CM (International Classification of Diseases, Ninth Revision) codes 402.01, 402.11, 402.91, 404.01, 404.03, 404.11, 404.13, 404.91, 404.93, and 428 and considered hospital attendance (annual rate of hospital admissions for HF per 100 000 population) and in-hospital mortality. The rate of hospital attendance was adjusted by age and sex. The risk-standardized mortality ratio (RSMR) was calculated as described recently.4,5 Quantitative variables were compared using the t test and analysis of variance (ANOVA); discrete variables were compared with the chi-square test. P values <.05 were considered significant.
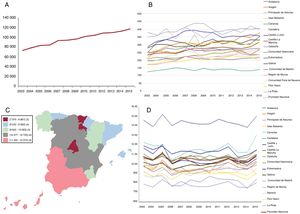
Between 2003 and 2015, 4 946 702 admissions due to cardiovascular diseases were recorded; 1 363 022 were for HF (27.5%). The changes over time in the total number of admissions for HF are illustrated in figure 1A and showed a progressive increase from 2003 to 2015 (P <.001). The rate of age- and sex-weighted hospital attendance increased from 229.7 to 269.6/100 000 population (P <.001) (table 1A). This rate significantly differed among ACs (P <.001) (table 1A). The communities with the lowest rates of hospital attendance were the Canary Islands, Chartered Community of Navarre, and Catalonia (table 1A); the highest rates were seen in Principality of Asturias, Community of Madrid, and Aragon. The difference between the communities with the highest and lowest rates of hospital attendance was 259.3/100 000 population (396.3 in Asturias vs 137.0 in the Canary Islands). All of the ACs, except Catalonia, showed a significant increase in the rate of hospital attendance for HF from 2003 to 2015 (table 1A and figure 1B).

Temporal trends in heart failure in Spain from 2003 to 2015. A: changes in the number of admissions per year with the principal diagnosis of heart failure. B: rates of hospital attendance weighted by age and sex for every 100 000 population in the different autonomous communities. C: graphical representation of the in-hospital mortality rates adjusted by risk in the different autonomous communities. D: changes in the ratios of in-hospital mortality adjusted by risk in the different autonomous communities.
Rates of age- and sex-weighted hospital attendance for HF for every 100 000 population between 2003 and 2015 in the different autonomous communities (A) and changes in the risk-standardized mortality ratios in the different autonomous communities in Spain between 2003 and 2015 (B)
| A | 2003 | 2004 | 2005 | 2006 | 2007 | 2008 | 2009 | 2010 | 2011 | 2012 | 2013 | 2014 | 2015 | 2003-2015 |
|---|---|---|---|---|---|---|---|---|---|---|---|---|---|---|
| Andalusiaa | 197.6 | 196.7 | 208.7 | 200.9 | 222.8 | 212.2 | 207.0 | 206.5 | 205.9 | 203.2 | 210.3 | 212.6 | 217.0 | 208.0 |
| Aragona | 214.2 | 260.6 | 286.2 | 304.1 | 314.6 | 303.4 | 294.3 | 321.8 | 324.9 | 314.5 | 352.7 | 346.0 | 376.7 | 309.4 |
| Principality of Asturiasa | 378.4 | 361.2 | 382.0 | 381.9 | 413.3 | 437.6 | 436.8 | 395.5 | 364.2 | 389.1 | 405.0 | 399.9 | 406.6 | 396.3 |
| Balearic Islandsa | 174.1 | 175.9 | 199.8 | 185.8 | 193.4 | 210.3 | 198.5 | 208.2 | 213.3 | 226.9 | 219.4 | 219.8 | 197.6 | 202.7 |
| Canary Islandsa | 123.9 | 131.7 | 138.5 | 150.3 | 141.9 | 131.7 | 146.2 | 135.5 | 141.1 | 140.1 | 130.1 | 130.9 | 138.5 | 137.0 |
| Cantabriaa | 305.9 | 315.5 | 322.8 | 311.7 | 321.0 | 284.8 | 305.5 | 271.5 | 285.0 | 296.3 | 274.3 | 289.2 | 306.6 | 299.0 |
| Castile and Leóna | 249.1 | 313.6 | 332.0 | 353.7 | 389.5 | 392.5 | 382.0 | 376.7 | 345.6 | 356.4 | 351.8 | 362.0 | 358.0 | 351.3 |
| Castile-La Manchaa | 234.8 | 244.7 | 247.2 | 241.1 | 260.4 | 278.9 | 273.9 | 280.8 | 282.9 | 278.6 | 274.0 | 284.7 | 316.8 | 270.0 |
| Cataloniab | 250.3 | 256.3 | 255.8 | 245.2 | 264.5 | 266.4 | 254.7 | 261.8 | 266.7 | 270.5 | 242.0 | 232.6 | 235.8 | 261.9 |
| Valencian Communitya | 207.3 | 218.7 | 213.6 | 210.6 | 222.0 | 230.1 | 233.2 | 244.4 | 242.1 | 257.5 | 258.7 | 236.4 | 268.9 | 234.7 |
| Extremaduraa | 286.0 | 322.6 | 332.9 | 320.8 | 310.3 | 287.4 | 316.2 | 335.0 | 305.2 | 317.6 | 299.2 | 304.1 | 354.1 | 314.8 |
| Galiciaa | 277.6 | 301.3 | 301.1 | 285.1 | 288.1 | 290.2 | 291.3 | 314.0 | 322.1 | 321.9 | 308.8 | 331.0 | 329.1 | 304.8 |
| Community of Madrida | 242.1 | 253.4 | 277.3 | 269.4 | 281.4 | 262.6 | 264.7 | 274.7 | 266.4 | 272.8 | 266.5 | 273.0 | 275.7 | 267.9 |
| Region of Murciaa | 169.8 | 172.6 | 184.2 | 194.1 | 221.2 | 227.5 | 215.6 | 221.6 | 221.6 | 231.2 | 251.3 | 237.4 | 235.3 | 214.9 |
| Chartered Community of Navarrea | 191.0 | 197.7 | 224.3 | 230.3 | 259.6 | 256.0 | 214.0 | 221.3 | 230.9 | 237.5 | 229.2 | 227.8 | 223.2 | 226.7 |
| Basque Countrya | 243.8 | 266.9 | 251.3 | 246.9 | 312.9 | 308.6 | 304.7 | 310.1 | 313.9 | 315.8 | 305.0 | 300.1 | 317.1 | 292.2 |
| La Riojaa | 348.1 | 356.6 | 403.5 | 336.6 | 410.9 | 381.8 | 342.0 | 383.0 | 387.0 | 398.8 | 378.8 | 420.8 | 395.9 | 380.0 |
| Spaina | 229.7 | 242.8 | 251.4 | 247.0 | 265.6 | 270.0 | 259.3 | 264.4 | 262.1 | 266.7 | 261.3 | 259.3 | 269.6 | 258.0 |
| B | RSMR per y | |||||||||||||
|---|---|---|---|---|---|---|---|---|---|---|---|---|---|---|
| 2003 | 2004 | 2005 | 2006 | 2007 | 2008 | 2009 | 2010 | 2011 | 2012 | 2013 | 2014 | 2015 | 2003-2015 | |
| Andalusia | 14.56 | 13.87 | 15.18 | 13.98 | 14.55 | 14.27 | 14.16 | 14.19 | 14.67 | 14.34 | 14.14 | 13.84 | 15.03 | 14.37 |
| Aragon | 9.70 | 9.36 | 10.41 | 9.33 | 9.22 | 9.30 | 9.49 | 9.09 | 10.27 | 10.55 | 9.93 | 9.72 | 10.26 | 9.77 |
| Principality of Asturias | 9.78 | 9.80 | 10.11 | 9.52 | 9.62 | 9.00 | 9.12 | 9.32 | 9.41 | 9.54 | 9.39 | 9.45 | 9.90 | 9.52 |
| Balearic Islands | 10.03 | 9.40 | 9.87 | 9.43 | 9.21 | 9.42 | 9.45 | 9.78 | 9.10 | 9.08 | 9.07 | 8.75 | 9.47 | 9.35 |
| Canary Islands | 12.22 | 11.92 | 11.89 | 10.38 | 10.94 | 11.41 | 11.52 | 11.18 | 11.60 | 12.14 | 11.19 | 11.19 | 13.04 | 11.60 |
| Cantabria | 10.70 | 10.42 | 11.11 | 10.06 | 10.40 | 10.91 | 10.41 | 10.86 | 10.62 | 10.93 | 10.19 | 10.19 | 10.92 | 10.59 |
| Castile and León | 11.66 | 11.02 | 12.03 | 10.02 | 10.36 | 10.30 | 10.03 | 10.04 | 10.09 | 10.53 | 10.25 | 9.86 | 10.55 | 10.44 |
| Castile-La Mancha | 10.59 | 10.38 | 10.81 | 10.21 | 10.72 | 10.24 | 9.80 | 9.95 | 10.10 | 10.52 | 10.18 | 10.39 | 11.01 | 10.38 |
| Catalonia | 9.76 | 9.16 | 9.63 | 8.78 | 9.14 | 9.23 | 9.43 | 9.70 | 9.83 | 10.16 | 9.66 | 9.41 | 10.12 | 9.56 |
| Valencian Community | 11.05 | 10.43 | 10.96 | 10.31 | 10.64 | 10.79 | 10.81 | 10.37 | 10.51 | 10.68 | 10.58 | 10.65 | 11.50 | 10.72 |
| Extremadura | 11.89 | 11.47 | 11.86 | 11.05 | 11.34 | 11.29 | 11.04 | 11.29 | 11.32 | 11.78 | 10.68 | 10.89 | 11.41 | 11.32 |
| Galicia | 10.15 | 9.87 | 10.06 | 9.36 | 9.66 | 9.90 | 9.80 | 9.99 | 10.23 | 10.57 | 10.03 | 10.17 | 10.84 | 10.08 |
| Community of Madrid | 9.20 | 8.67 | 8.74 | 7.60 | 8.13 | 7.68 | 7.60 | 7.64 | 7.87 | 8.14 | 7.56 | 7.49 | 8.03 | 7.97 |
| Region of Murcia | 10.48 | 9.51 | 10.22 | 8.96 | 9.29 | 9.32 | 9.46 | 9.28 | 9.56 | 10.16 | 9.62 | 9.50 | 9.88 | 9.62 |
| Chartered Community of Navarre | 8.76 | 8.54 | 9.38 | 9.37 | 9.02 | 8.78 | 9.36 | 9.31 | 9.55 | 9.68 | 9.19 | 9.97 | 8.89 | 9.24 |
| Basque Country | 9.23 | 8.64 | 9.00 | 8.35 | 8.95 | 8.97 | 8.95 | 9.01 | 9.02 | 9.04 | 8.69 | 8.34 | 9.06 | 8.87 |
| La Rioja | 7.85 | 7.57 | 8.38 | 7.69 | 7.70 | 8.29 | 8.07 | 8.68 | 8.41 | 8.36 | 8.25 | 7.43 | 8.40 | 8.10 |
| Spain | 10.84 | 10.53 | 11.06 | 10.19 | 10.52 | 10.51 | 10.38 | 10.37 | 10.48 | 10.64 | 10.22 | 10.14 | 10.80 | 10.54 |
RSMR, risk-standardized mortality ratio.
In-hospital mortality was significantly different among the ACs throughout the 2003 to 2015 study period (table 1B and figure 1C) (P <.001), with highly marked differences in the RSMR, from 7.97% in the Community of Madrid to 14.35% in Andalusia (national average, 10.54%). The in-hospital mortality was unchanged between 2003 and 2015 (P=.664) (table 1B). As seen with the national average, there were no significant changes in mortality in any of the communities between 2003 and 2015 (table 1B and figure 1D). Every year, mortality was higher in Andalusia, the Canary Islands, Extremadura, and Castile and León and lower in Community of Madrid, Chartered Community of Navarre, La Rioja, and the Basque Country, with intermediate annual rates in the other regions.
There were also no differences in the RSMR according to sex, with similar mortality in men and women in both Spain as a whole (men, 10.39%; women, 10.32%; P=.517) and in the different ACs, without changes from 2003 to 2015. In men, the RSMR decreased from 10.90% in 2003 to 10.78% in 2015 (P=.816); in the same period, it increased from 10.78% to 10.82% in women (P=.517). Although the rate of hospital attendance was generally lower in women during the study period, the tendency for an increase in this rate was similar in the 2 sexes (P=.563).
In conclusion, this study has revealed a significant increase in the number of admissions and in the rate of hospital attendance for HF between 2003 and 2015 in Spain and in almost all ACs. In addition, in-hospital mortality adjusted by risk (RSMR) was largely unchanged in the study period and remains at about 10% in Spain. These data confirm the tendency shown by older studies5,6 and indicate an ever-increasing impact of HF. The rate of hospital attendance varied significantly among the different ACs, similar to in-hospital mortality. With the limitations inherent to the data source, the hospital MDS, which is dependent on the quality of the disease coding but is used throughout Spain, we believe that our data shed light on a highly impactful problem, that of the continuous increase in HF burden in Spain and of the major differences among ACs. It is essential to identify explanations for these differences though research that relates these data to variables such as socioeconomic factors, geographical dispersion, health care parameters (management systems, health care investment), the existence of HF programs, discharge services, and type of hospital.
FUNDINGThis work was made possible by an unconditional grant from Menarini.
We thank the Spanish Ministry of Health and the Institute of Health Information of the Spanish National Health System for the resources provided to the Spanish Society of Cardiology to undertake the RECALCAR project.