Heart failure (HF) has become a true cardiovascular “epidemic” with a declining mortality from acute heart disease and a prevalence that rises with age and is as high as 6.8% of the Spanish population older than 45 years, according to some studies.1 In the PRICE trial conducted from 2004 to 2005, this prevalence increased exponentially with age and did not differ between men and women.1 Other studies in various regions of Spain have reported an increased incidence of HF-related hospitalization in the past few decades,2–4 but there are no recent data on hospitalization and mortality trends by age and sex for Spain as a whole.
The aim of our study was to determine the influence of age and sex on HF-related hospitalization and in-hospital mortality trends in Spain by analyzing all hospital discharge reports listing HF as the principal diagnosis in Spanish public hospitals between 2003 and 2018. The data were obtained from hospital encounters recorded in the minimum data set (MDS) for hospitals between 1 January 2003 and 31 December 2018 with HF as the principal diagnosis. The hospitalization rate (hospital admissions due to HF/100 000 inhabitants) was analyzed. In 2016, the MDS coding system was updated in 2016 from the International Classification of Diseases, Ninth Revision, Clinical Modification (ICD-9-CM) to the International Classification of Diseases, Tenth Revision (ICD-10). Consequently, the 2003 to 2015 and 2016 to 2018 series are not entirely homogeneous. However, not all hospital discharges were recorded in 2016, the first year that this change was made.
The risk-adjusted standardized mortality ratio (RA-SMR) for inpatients was calculated as described in recent articles.5 The analysis was done according to the age groups listed in table 1 for the total population and for men and women. Temporal trends for hospitalization and in-hospital mortality rates during the study period were evaluated by a Poisson regression model, with year being the only independent variable. In all models, the incidence rate ratio (IRR) was calculated with 95% confidence intervals (95%CI).
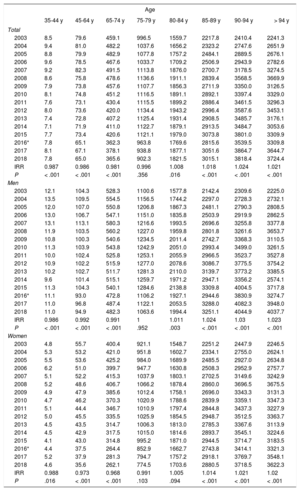
Hospitalization rate (admissions/100 000 inhabitants) by age group, for the total population and for men and women between 2003 and 2018 in Spain
| Age | ||||||||
|---|---|---|---|---|---|---|---|---|
| 35-44 y | 45-64 y | 65-74 y | 75-79 y | 80-84 y | 85-89 y | 90-94 y | > 94 y | |
| Total | ||||||||
| 2003 | 8.5 | 79.6 | 459.1 | 996.5 | 1559.7 | 2217.8 | 2410.4 | 2241.3 |
| 2004 | 9.4 | 81.0 | 482.2 | 1037.6 | 1656.2 | 2323.2 | 2747.6 | 2651.9 |
| 2005 | 8.8 | 79.9 | 482.9 | 1077.8 | 1757.2 | 2484.1 | 2889.5 | 2676.1 |
| 2006 | 9.6 | 78.5 | 467.6 | 1033.7 | 1709.2 | 2506.9 | 2943.9 | 2782.6 |
| 2007 | 9.2 | 82.3 | 491.5 | 1113.8 | 1876.0 | 2700.7 | 3178.5 | 3274.5 |
| 2008 | 8.6 | 75.8 | 478.6 | 1136.6 | 1911.1 | 2839.4 | 3568.5 | 3669.9 |
| 2009 | 7.9 | 73.8 | 457.6 | 1107.7 | 1856.3 | 2711.9 | 3350.0 | 3126.5 |
| 2010 | 8.1 | 74.8 | 451.2 | 1116.5 | 1891.1 | 2892.1 | 3397.4 | 3329.0 |
| 2011 | 7.6 | 73.1 | 430.4 | 1115.5 | 1899.2 | 2886.4 | 3461.5 | 3296.3 |
| 2012 | 8.0 | 73.6 | 420.0 | 1134.4 | 1943.2 | 2996.4 | 3587.6 | 3453.1 |
| 2013 | 7.4 | 72.8 | 407.2 | 1125.4 | 1931.4 | 2908.5 | 3485.7 | 3176.1 |
| 2014 | 7.1 | 71.9 | 411.0 | 1122.7 | 1879.1 | 2913.5 | 3484.7 | 3053.6 |
| 2015 | 7.7 | 73.4 | 420.6 | 1121.1 | 1979.0 | 3073.8 | 3801.0 | 3309.9 |
| 2016* | 7.8 | 65.1 | 362.3 | 963.8 | 1769.6 | 2815.6 | 3539.5 | 3309.8 |
| 2017 | 8.1 | 67.1 | 378.1 | 938.8 | 1877.1 | 3051.6 | 3864.7 | 3644.7 |
| 2018 | 7.8 | 65.0 | 365.6 | 902.3 | 1821.5 | 3015.1 | 3818.4 | 3724.4 |
| IRR | 0.987 | 0.986 | 0.981 | 0.996 | 1.008 | 1.018 | 1.024 | 1.021 |
| P | < .001 | < .001 | < .001 | .356 | .016 | < .001 | < .001 | < .001 |
| Men | ||||||||
| 2003 | 12.1 | 104.3 | 528.3 | 1100.6 | 1577.8 | 2142.4 | 2309.6 | 2225.0 |
| 2004 | 13.5 | 109.5 | 554.5 | 1156.5 | 1744.2 | 2297.0 | 2728.3 | 2732.1 |
| 2005 | 12.0 | 107.0 | 550.8 | 1206.8 | 1867.3 | 2481.1 | 2790.3 | 2808.5 |
| 2006 | 13.0 | 106.7 | 547.1 | 1151.0 | 1835.8 | 2503.9 | 2919.9 | 2862.5 |
| 2007 | 13.1 | 113.1 | 580.3 | 1216.6 | 1993.5 | 2696.6 | 3255.8 | 3377.8 |
| 2008 | 11.9 | 103.5 | 560.2 | 1227.0 | 1959.8 | 2801.8 | 3261.6 | 3653.7 |
| 2009 | 10.8 | 100.3 | 540.6 | 1234.5 | 2011.4 | 2742.7 | 3368.3 | 3110.5 |
| 2010 | 11.3 | 103.9 | 543.8 | 1242.9 | 2051.0 | 2993.4 | 3499.0 | 3261.5 |
| 2011 | 10.0 | 102.4 | 525.8 | 1253.1 | 2055.9 | 2966.5 | 3523.7 | 3527.8 |
| 2012 | 10.9 | 102.2 | 515.9 | 1277.0 | 2078.6 | 3086.7 | 3775.5 | 3754.2 |
| 2013 | 10.2 | 102.7 | 511.7 | 1281.3 | 2110.0 | 3139.7 | 3773.2 | 3385.5 |
| 2014 | 9.6 | 101.4 | 515.1 | 1259.7 | 1971.2 | 2947.1 | 3356.2 | 2574.1 |
| 2015 | 11.3 | 104.3 | 540.1 | 1284.6 | 2138.8 | 3309.8 | 4004.5 | 3717.8 |
| 2016* | 11.1 | 93.0 | 472.8 | 1106.2 | 1927.1 | 2944.6 | 3830.9 | 3274.7 |
| 2017 | 11.0 | 96.8 | 487.4 | 1122.1 | 2053.5 | 3288.0 | 4082.3 | 3948.0 |
| 2018 | 11.0 | 94.9 | 482.3 | 1063.6 | 1994.4 | 3251.1 | 4044.9 | 4037.7 |
| IRR | 0.986 | 0.992 | 0.991 | 1 | 1.011 | 1.024 | 1.03 | 1.023 |
| P | < .001 | < .001 | < .001 | .952 | .003 | < .001 | < .001 | < .001 |
| Women | ||||||||
| 2003 | 4.8 | 55.7 | 400.4 | 921.1 | 1548.7 | 2251.2 | 2447.9 | 2246.5 |
| 2004 | 5.3 | 53.2 | 421.0 | 951.8 | 1602.7 | 2334.1 | 2755.0 | 2624.1 |
| 2005 | 5.5 | 53.6 | 425.2 | 984.0 | 1689.9 | 2485.5 | 2927.0 | 2634.8 |
| 2006 | 6.2 | 51.0 | 399.7 | 947.7 | 1630.8 | 2508.3 | 2952.9 | 2757.7 |
| 2007 | 5.1 | 52.2 | 415.3 | 1037.9 | 1803.1 | 2702.5 | 3149.6 | 3242.9 |
| 2008 | 5.2 | 48.6 | 406.7 | 1066.2 | 1878.4 | 2860.0 | 3696.5 | 3675.5 |
| 2009 | 4.9 | 47.9 | 385.6 | 1012.4 | 1758.1 | 2696.0 | 3343.3 | 3131.3 |
| 2010 | 4.7 | 46.2 | 370.3 | 1020.9 | 1788.6 | 2839.9 | 3359.1 | 3347.3 |
| 2011 | 5.1 | 44.4 | 346.7 | 1010.9 | 1797.4 | 2844.8 | 3437.3 | 3227.9 |
| 2012 | 5.0 | 45.5 | 335.5 | 1025.9 | 1854.5 | 2948.7 | 3512.5 | 3363.7 |
| 2013 | 4.5 | 43.5 | 314.7 | 1006.3 | 1813.0 | 2785.3 | 3367.6 | 3113.9 |
| 2014 | 4.5 | 42.9 | 317.5 | 1015.0 | 1814.6 | 2893.7 | 3545.1 | 3224.6 |
| 2015 | 4.1 | 43.0 | 314.8 | 995.2 | 1871.0 | 2944.5 | 3714.7 | 3183.5 |
| 2016* | 4.4 | 37.5 | 264.4 | 852.9 | 1662.7 | 2743.8 | 3414.1 | 3321.3 |
| 2017 | 5.2 | 37.9 | 281.3 | 794.7 | 1757.2 | 2918.1 | 3769.7 | 3548.1 |
| 2018 | 4.6 | 35.6 | 262.1 | 774.5 | 1703.6 | 2880.5 | 3718.5 | 3622.3 |
| IRR | 0.988 | 0.973 | 0.968 | 0.991 | 1.005 | 1.014 | 1.021 | 1.02 |
| P | .016 | < .001 | < .001 | .103 | .094 | < .001 | < .001 | < .001 |
ICD-10-CM, International Classification of Diseases, Ninth Revision, Clinical Modification; ICD-10, International Classification of Diseases, Tenth Revision; IRR, incidence rate ratio.
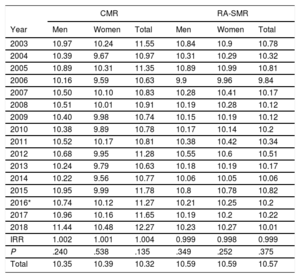
A total of 6 308 178 hospitalizations due to cardiovascular disease were recorded from 2003 to 2018, with 1 720 458 (27.3%) specifically due to HF. Table 1 lists hospitalization rates for 2003 to 2018 by age group for the total population and for men and women. The total age- and sex-weighted HF-related hospitalization rate rose between 2003 and 2018 (from 326.5 to 352.4/100 000 inhabitants), but the difference was not significant (IRR=1.003; P < .001). The rise in hospital admissions was due to an increase in the population aged 80 years or older, whereas rates remained stable or dropped significantly in the subgroup aged 35 to 74 years (table 1, total population; P < .001). The HF-related hospitalization rate was very significantly correlated with age (table 1, total population; P < .001). For instance, in 2018 it was 19.4 times higher in the group aged 75 years or older than in the group younger than 75 years. The same temporal trends were seen in men and women (table 1, men and women), with very significant increases seen between 2003 and 2018 in people aged 80 years or older. For patients younger than 75 years, the hospitalization rate for men was slightly (IRR = 1.008) but significantly (P < .001) higher whereas the hospitalization rate for women was lower (IRR = 0.982; P < .001). Overall, men were hospitalized more often across all age groups, and the increase between 2003 and 2018 was significantly higher in men in the age groups of 80 to 84, 85 to 89, and 90 to 94 years (men vs women, IRR = 1.011 vs 1.005; IRR = 1.024 vs 1.014 and IRR = 1.03 vs 1.021; P < .001 for all groups). Regarding in-hospital mortality, both crude and risk-adjusted (RA-SMR) rates were very significantly correlated with age in Spain as a whole (P < .001), with similar figures observed in both men and women over the entire period (RA-SMR, 10.59 vs 10.57). Crude and adjusted in-hospital mortality rates were unchanged during this period (table 2).
Risk-adjusted standardized mortality ratio (RA-SMR, %) for men and women with heart failure between 2003 and 2018 in Spain
| CMR | RA-SMR | |||||
|---|---|---|---|---|---|---|
| Year | Men | Women | Total | Men | Women | Total |
| 2003 | 10.97 | 10.24 | 11.55 | 10.84 | 10.9 | 10.78 |
| 2004 | 10.39 | 9.67 | 10.97 | 10.31 | 10.29 | 10.32 |
| 2005 | 10.89 | 10.31 | 11.35 | 10.89 | 10.99 | 10.81 |
| 2006 | 10.16 | 9.59 | 10.63 | 9.9 | 9.96 | 9.84 |
| 2007 | 10.50 | 10.10 | 10.83 | 10.28 | 10.41 | 10.17 |
| 2008 | 10.51 | 10.01 | 10.91 | 10.19 | 10.28 | 10.12 |
| 2009 | 10.40 | 9.98 | 10.74 | 10.15 | 10.19 | 10.12 |
| 2010 | 10.38 | 9.89 | 10.78 | 10.17 | 10.14 | 10.2 |
| 2011 | 10.52 | 10.17 | 10.81 | 10.38 | 10.42 | 10.34 |
| 2012 | 10.68 | 9.95 | 11.28 | 10.55 | 10.6 | 10.51 |
| 2013 | 10.24 | 9.79 | 10.63 | 10.18 | 10.19 | 10.17 |
| 2014 | 10.22 | 9.56 | 10.77 | 10.06 | 10.05 | 10.06 |
| 2015 | 10.95 | 9.99 | 11.78 | 10.8 | 10.78 | 10.82 |
| 2016* | 10.74 | 10.12 | 11.27 | 10.21 | 10.25 | 10.2 |
| 2017 | 10.96 | 10.16 | 11.65 | 10.19 | 10.2 | 10.22 |
| 2018 | 11.44 | 10.48 | 12.27 | 10.23 | 10.27 | 10.01 |
| IRR | 1.002 | 1.001 | 1.004 | 0.999 | 0.998 | 0.999 |
| P | .240 | .538 | .135 | .349 | .252 | .375 |
| Total | 10.35 | 10.39 | 10.32 | 10.59 | 10.59 | 10.57 |
CMR, crude mortality rate; ICD-10-CM, International Classification of Diseases, Ninth Revision, Clinical Modification; ICD-10, International Classification of Diseases, Tenth Revision; IRR, incidence rate ratio; RA-SMR, risk-adjusted standardized mortality ratio.
In conclusion, in Spain, HF-related hospitalizations (hospitalizations/100 000 inhabitants) between 2003 and 2018 were higher in men but lower in women. However, this increase in hospital admissions was not uniform across all age groups, but seemed to be limited to the population aged 80 years or older, as both groups showed a significant decrease in people younger than 75 years between 2003 and 2018. In-hospital mortality was similarly high in men and women, around 10%, and has not declined. These data reveal the challenges of designing measures to reduce HF-related hospitalization and in-hospital mortality rates in the older population in Spain.
FUNDINGThis work was funded by an unrestricted grant from Menarini as part of the RECALCAR project.
AUTHORS’ CONTRIBUTIONSM. Anguita Sánchez, J.L. Bonilla Palomas, and F.J. Elola Somoza were responsible for the idea and conception of the study and for writing the article. M. García Márquez and J.L. Bernal Sobrino performed the design and statistical analysis and prepared the tables. F. Marín Ortuño was project coordinator and reviewed the document.
CONFLICTS OF INTERESTThe authors state that they have no conflicts of interest with regard to this project.
We would like to thank the Ministry of Health for providing the MDS database and the Institute of Health Information of the National Health System for assistance provided to the Spanish Cardiology Society to carry out the RECALCAR project.