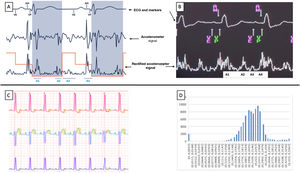
Until a few months ago, leadless pacemakers (LPM) only functioned in VVIR mode. However, single-chamber pacing only covers 15% of pacemaker indications yet represents 38.5% of all pacing modes used in Spain.1 In the MARVEL 2 study, detection of atrial activity using the LPM accelerometer showed atrioventricular (AV) synchrony in 89.2% for up to 5hours.2 The LPM Micra AV MC1AVR1 (Medtronic Ibérica, SA, Spain) uses the signal from the accelerometer to detect the 4 sounds of the cardiac cycle (A1, A2, A3, and A4) and thus deliver a ventricular pace that is synchronized with atrial activity (VDD mode). After a blanking period (A1 and A2), the device starts a search window for ventricular events (VE) that ends after the passive component of ventricular filling (A3), then searches for the active component (A4), a signal that the device identifies as atrial mechanical contraction (AM). The detection of the A4 signal triggers a ventricular pace (VP), after an AM-VP interval of a few milliseconds (figure 1A,B). After implantation, the device automatically configures the atrial parameters (VE window, A3 threshold, and A4 threshold) to allow AV synchrony. These parameters can then be manually adjusted, if required, to optimize atrial signal detection.
 and image taken from the programmer (B). The red line corresponds to the A3 and A4 thresholds, and the shaded area (A) corresponds to atrial blanking. C: example of automatic Holter-ECG analysis using the signal delineation system; the green, purple, and yellow shading corresponds to the detection of the P wave, the QRS, and the T wave, respectively. D: histogram of distribution of the P-QRS intervals (s) obtained using the signal delineation system. The X-axis represents the different P-QRS intervals (s) and the Y-axis represents the total number of cardiac cycles in each P-QRS interval; the P-QRS=0 column of the histogram (left column) indicates the number of cardiac cycles in which the QRS did not have a preceding P wave. AM, atrial mechanical contraction detection marker; ECG, electrocardiogram; VE, ventricular end, marking the end of the A3 window; VP, mark corresponding to ventricular pacing from the pacemaker.")
Diagram of atrioventricular synchrony function (A) and image taken from the programmer (B). The red line corresponds to the A3 and A4 thresholds, and the shaded area (A) corresponds to atrial blanking. C: example of automatic Holter-ECG analysis using the signal delineation system; the green, purple, and yellow shading corresponds to the detection of the P wave, the QRS, and the T wave, respectively. D: histogram of distribution of the P-QRS intervals (s) obtained using the signal delineation system. The X-axis represents the different P-QRS intervals (s) and the Y-axis represents the total number of cardiac cycles in each P-QRS interval; the P-QRS=0 column of the histogram (left column) indicates the number of cardiac cycles in which the QRS did not have a preceding P wave. AM, atrial mechanical contraction detection marker; ECG, electrocardiogram; VE, ventricular end, marking the end of the A3 window; VP, mark corresponding to ventricular pacing from the pacemaker.
We present the initial experience in our hospital with the first 10 patients to receive an LPM Micra AV, who underwent a 24-hour Holter-ECG study to analyze concordance between the AV synchrony measured by the counters in the device and that determined by electrocardiogram recording. All implantations were performed using a standard technique with ultrasound-guided femoral puncture and deep sedation provided by an anesthesiologist. A first device interrogation was done before the patient was discharged and afterward at follow-up at 1 week, 1 month, and 3 months using the remote monitoring system. If reprogramming was required, this was done in person and then assessed remotely 1 week later to check the result of the changes. The 24-hour Holter study was performed once the percentage of AV synchrony determined by the counters (AM-VP+AM-VS) was stable for at least 2 months. Device interrogation was performed before and after the Holter was placed.
Between 1 June and 6 November 2020, 10 Micra AV LPM were implanted (mean age, 83.5±5.4 years; 7 men; 5 implants for complete AV block and 5 for second-degree block). All patients gave signed informed consent and were informed of the nature of the device. The study was carried out in line with the principles of the Declaration of Helsinki. Two operators (S. Briongos Figuero and Á. Estévez Paniagua) implanted all the devices with a single deployment and no procedure-related complications (table 1). At follow-up, reprogramming of the atrial parameters was considered necessary in 100% of the patients. These changes were made at 4 weeks after implantation. The device programming during Holter monitoring is summarized in table 1. The 24-hour Holter study took place at a mean 141.4±45 days after implantation. The electrocardiographic signals of the recording (figure 1C) were analyzed blind, with the automatic electrocardiographic signal detection system that uses signal delineation based on the transformation of waves as described by Martínez et al.,3 which has a sensitivity of 98.9% and a positive predictive value of 91.6% for P wave detection. An AV-synchronized beat was defined as that which had a P wave followed by a QRS complex at 300 milliseconds or less (the same criterion as the MARVEL 2 study).2 The sum total time analyzed in the 10 patients was 210.6hours with a total of 915 488 cardiac cycles. The mean values for minimum, mean, and maximum heart rates were 48.6±8.0, 71.9±8.4 and 105.6±9.5 bpm, respectively. The mean percentage of AV-synchronized beats was 88.6±8.5%. The mean AV synchrony determined by the counters in the device was 89.8±5.5% during the 24-hour Holter monitoring. The individual correlation between the 2 measurements was good (intraclass correlation coefficient=0.72).
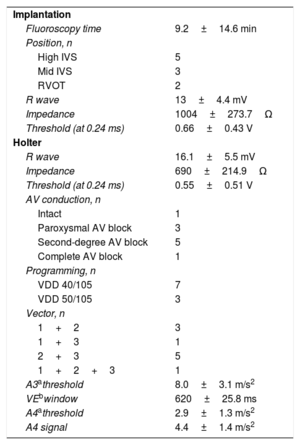
Details of implantation and function/programming during Holter monitoring
| Implantation | |
| Fluoroscopy time | 9.2±14.6 min |
| Position, n | |
| High IVS | 5 |
| Mid IVS | 3 |
| RVOT | 2 |
| R wave | 13±4.4 mV |
| Impedance | 1004±273.7Ω |
| Threshold (at 0.24 ms) | 0.66±0.43 V |
| Holter | |
| R wave | 16.1±5.5 mV |
| Impedance | 690±214.9Ω |
| Threshold (at 0.24 ms) | 0.55±0.51 V |
| AV conduction, n | |
| Intact | 1 |
| Paroxysmal AV block | 3 |
| Second-degree AV block | 5 |
| Complete AV block | 1 |
| Programming, n | |
| VDD 40/105 | 7 |
| VDD 50/105 | 3 |
| Vector, n | |
| 1+2 | 3 |
| 1+3 | 1 |
| 2+3 | 5 |
| 1+2+3 | 1 |
| A3athreshold | 8.0±3.1 m/s2 |
| VEbwindow | 620±25.8 ms |
| A4athreshold | 2.9±1.3 m/s2 |
| A4 signal | 4.4±1.4 m/s2 |
AV, atrioventricular; IVS, intraventricular septum; RVOT, right ventricular outflow tract.
Values are expressed as No. (%) or mean±standard deviation.
In this pilot study, after manual adjustment of the atrial parameters, the percentage of AV synchrony in the short-term was high. The data on AV synchrony provided by the device appear to be reliable, when compared with the electrocardiographic recording. Nonetheless, larger analyses are needed to corroborate these findings.
FUNDINGThere was no funding for this study.
AUTHORS’ CONTRIBUTIONSS. Briongos Figuero: study design, data collection and analysis, writing of article. Á. Estévez Paniagua: study design, data collection and analysis, writing of article. A. Sánchez Hernández: data collection and critical review. A. Abad-Motos: data collection and critical review. A. Ruiz: data collection and critical review. R. Muñoz-Aguilera: data analysis, writing and critical review of the article.
CONFLICTS OF INTERESTNone of the authors declare conflicts of interest in relation to this study.
Special thanks to Gonzalo Sánchez for his help and selfless work.