Cardiac amyloidosis (CA) is characterized by extracellular deposition of amyloid fibrils in the myocardium and other cardiac structures. Although its actual prevalence is unknown, transthyretin-related CA is thought to be present in 15% to 30% of patients with aortic stenosis (AS) treated by transcatheter aortic valve implantation (TAVI), possibly identifying a patient subgroup with a poorer prognosis. Echocardiography is an essential tool used to establish the initial diagnostic suspicion. However, the coexistence of AS and CA could mask the diagnosis of the latter, as they share common features.1
Several publications report on advanced echocardiographic indices based on left ventricular longitudinal myocardial strain, which could differentiate CA from other forms of hypertrophy. These indices include RELAPS (relative apical sparing of longitudinal strain [LS]),2 septal apical to basal LS ratio (SAB),3 or left ventricular ejection fraction (LVEF) to global longitudinal strain (GLS) ratio (EFSR).4
Our aim was to assess the diagnostic utility of applying these LS-based echocardiographic criteria described for suspected CA in patients with severe AS without amyloidosis.
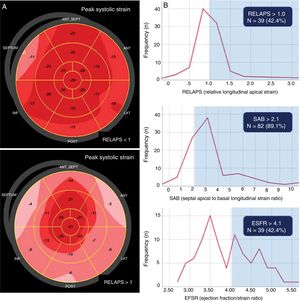
As part of the AMY-TAVI (NCT03984877) trial to study the prognostic impact of CA in patients with severe AS who underwent TAVI, 109 consecutive patients were prospectively included between January and August 2019 if they had a diagnosis of severe symptomatic AS without CA and had an indication for TAVI. Pre-procedure echocardiography included conventional parameters and myocardial deformation parameters on speckle-tracking echocardiography (2DSTE); these parameters were only measured in 92 patients, due to a poor acoustic window that caused inadequate tracking in the remaining 17 patients. The same expert operator obtained all echocardiograms (blinded) using a Vivid E95 unit, and all echocardiograms were analyzed offline with the EchoPAC Clinical Workstation v202 Software (GE Healthcare, Norway). Polar maps were acquired by AFI algorithms with quantitative information from the LS generated from the 3 apical planes, with a frame rate of 50 to 80 cps, and were divided into 17 segments. Strain was averaged using 6 basal, 6 medial, and 4 apical segments (excluding segment 17). The relative apical LS was calculated using the formula: RELAPS=average apical LS / average basal SL + average mid LS. According to the literature,2 RELAPS> 1 indicates CA, with the polar map showing a bright red pattern in the apical segments and more pinkish pattern in the basal and mid-ventricular segments (figure 1A). The SAB ratio was calculated as the septal apical to basal LS ratio, and it was considered that a value> 2.1 indicated CA.3 The EFSR ratio was calculated as LVEF over GLS. The cutoff point for CA was established as 4.1.4
. Patient distribution according to RELAPS, SAB, and EFSR values. AS, aortic stenosis; CA, cardiac amyloidosis; EFSR, ejection fraction to strain ratio; LS, longitudinal strain; RELAPS, relative apical sparing of longitudinal strain; SAB, septal apical to basal longitudinal strain ratio.")
A, LS phenotypes in the polar map in severe AS according to the RELAPS value. The RELAPS> 1 pattern represents normal apical strain. B, patients with severe and symptomatic AS and myocardial strain indices within the range indicating CA (n=92). Patient distribution according to RELAPS, SAB, and EFSR values. AS, aortic stenosis; CA, cardiac amyloidosis; EFSR, ejection fraction to strain ratio; LS, longitudinal strain; RELAPS, relative apical sparing of longitudinal strain; SAB, septal apical to basal longitudinal strain ratio.
Post-TAVI 99Tc pyrophosphate scintigraphy and serum protein electrophoresis were performed for CA screening, and patients with a positive result were excluded.
Categorical variables are expressed as frequencies and percentages, and continuous variables are expressed as the mean±standard deviation. Qualitative variables were compared using the chi squared test, and continuous variables were compared using the Student t test for independent samples. To identify predictive factors of an apical sparing pattern (RELAPS> 1), a logistic regression model was constructed by the backward stepwise selection method using maximum likelihood estimates, including any variables that were statistically significant or had P<.1 in the bivariate analysis. The odds ratio (OR) and 95% confidence intervals (95%CI) were calculated. A P value < .05 was considered significant. All data were analyzed using SPSS ver. 25.
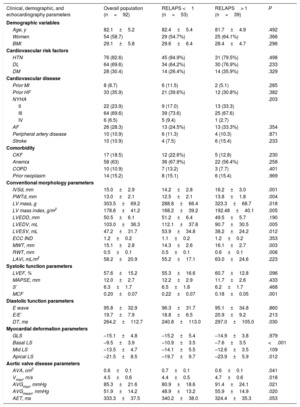
Table 1 lists the baseline characteristics of the entire cohort analyzed with myocardial deformation parameters and the differences between the RELAPS <1 and> 1 subgroups.
Patient characteristics according to systolic strain phenotype in the polar map
| Clinical, demographic, and echocardiography parameters | Overall population (n=92) | RELAPS <1 (n=53) | RELAPS> 1 (n=39) | P |
|---|---|---|---|---|
| Demographic variables | ||||
| Age, y | 82.1±5.2 | 82.4±5.4 | 81.7±4.9 | .492 |
| Women | 54 (58.7) | 29 (54.7%) | 25 (64.1%) | .366 |
| BMI | 29.1±5.8 | 29.6±6.4 | 28.4±4.7 | .296 |
| Cardiovascular risk factors | ||||
| HTN | 76 (82.6) | 45 (84.9%) | 31 (79.5%) | .498 |
| DL | 64 (69.6) | 34 (64.2%) | 30 (76.9%) | .233 |
| DM | 28 (30.4) | 14 (26.4%) | 14 (35.9%) | .329 |
| Cardiovascular disease | ||||
| Prior MI | 8 (8.7) | 6 (11.5) | 2 (5.1) | .285 |
| Prior HF | 33 (35.9) | 21 (39.6%) | 12 (30.8%) | .382 |
| NYHA | .203 | |||
| II | 22 (23.9) | 9 (17.0) | 13 (33.3) | |
| III | 64 (69.6) | 39 (73.6) | 25 (67.6) | |
| IV | 6 (6.5) | 5 (9.4) | 1 (2.7) | |
| AF | 26 (28.3) | 13 (24.5%) | 13 (33.3%) | .354 |
| Peripheral artery disease | 10 (10.9) | 6 (11.3) | 4 (10.3) | .871 |
| Stroke | 10 (10.9) | 4 (7.5) | 6 (15.4) | .233 |
| Comorbidity | ||||
| CKF | 17 (18.5) | 12 (22.6%) | 5 (12.8) | .230 |
| Anemia | 58 (63) | 36 (67.9%) | 22 (56.4%) | .258 |
| COPD | 10 (10.9) | 7 (13.2) | 3 (7.7) | .401 |
| Prior neoplasm | 14 (15.2) | 8 (15.1) | 6 (15.4) | .969 |
| Conventional morphology parameters | ||||
| IVSd, mm | 15.0±2.9 | 14.2±2.8 | 16.2±3.0 | .001 |
| PWTd, mm | 13.0±2.1 | 12.5±2.1 | 13.8±1.8 | .004 |
| LV mass, g | 303.5±69.2 | 288.8±66.4 | 323.3±68.7 | .018 |
| LV mass index, g/m2 | 178.6±41.2 | 168.2±39.2 | 192.48±40.1 | .005 |
| LVEDD, mm | 50.5±6.1 | 51.2±6.4 | 49.5±5.7 | .190 |
| LVEDV, mL | 103.0±36.3 | 112.1±37.8 | 90.7±30.5 | .005 |
| LVESV, mL | 47.2±31.7 | 53.9±34.8 | 38.2±24.2 | .012 |
| ECC IND | 1.2±0.2 | 1.1±0.2 | 1.2±0.2 | .353 |
| MWT, mm | 15.1±2.8 | 14.3±2.6 | 16.1±2.7 | .003 |
| RWT, mm | 0.5±0.1 | 0.5±0.1 | 0.6±0.1 | .008 |
| LAVi, mL/m2 | 58.2±20.9 | 55.2±17.1 | 63.0±24.6 | .223 |
| Systolic function parameters | ||||
| LVEF, % | 57.6±15.2 | 55.3±16.6 | 60.7±12.8 | .096 |
| MAPSE, mm | 12.0±2.7 | 12.2±2.9 | 11.7±2.6 | .433 |
| S’ | 6.3±1.7 | 6.5±1.8 | 6.2±1.7 | .468 |
| MCF | 0.20±0.07 | 0.22±0.07 | 0.18±0.05 | .001 |
| Diastolic function parameters | ||||
| E wave | 95.8±32.9 | 96.3±31.7 | 95.1±34.8 | .860 |
| E/E’ | 19.7±7.9 | 18.8±6.5 | 20.9±9.2 | .213 |
| DT, ms | 264.2±112.7 | 240.8±113.0 | 297.0±105.0 | .030 |
| Myocardial deformation parameters | ||||
| GLS | –15.1±4.8 | –15.2±5.4 | –14.9±3.8 | .979 |
| Basal LS | –9.5±3.9 | –10.9±3.5 | –7.6±3.5 | <.001 |
| Mid LS | –13.5±4.7 | –14.1±5.5 | –12.6±3.5 | .109 |
| Apical LS | –21.5±8.5 | –19.7±9.7 | –23.9±5.9 | .012 |
| Aortic valve disease parameters | ||||
| AVA, cm2 | 0.6±0.1 | 0.7±0.1 | 0.6±0.1 | .041 |
| Vmax, m/s | 4.5±0.6 | 4.4±0.5 | 4.7±0.6 | .018 |
| AVGmax, mmHg | 85.3±21.6 | 80.9±18.6 | 91.4±24.1 | .021 |
| AVGmean, mmHg | 51.9±14.2 | 48.9±13.2 | 55.9±14.9 | .020 |
| AET, ms | 333.3±37.5 | 340.2±38.0 | 324.4±35.3 | .053 |
AET, aortic ejection time; AF, atrial fibrillation; apical LS, average peak systolic longitudinal strain of the apical segments; AVGmax, peak aortic valve gradient; AVGmean, mean aortic valve gradient; AVA, aortic valve area; basal LS, average peak systolic longitudinal strain of the basal segments; BMI, body mass index; CKF, chronic kidney failure; COPD, chronic obstructive pulmonary disease; DL, dyslipidemia; DM, diabetes mellitus; DT, E-wave transmitral deceleration time; E/E’, ratio of early mitral inflow E-wave to pulsed-wave tissue Doppler mitral annular E’ wave; ECC IND, eccentricity index (IVSd/PWTd ratio); GLS, global longitudinal strain; HF, prior admission due to heart failure; HTN, hypertension; IVSd, interventricular septal thickness at end diastole; LAVi, indexed left atrial volume by biplane area-length method; LVEDD, LV end-diastolic diameter; LVEDV, LV end-diastolic volume; LVESV, LV end-systolic volume; MCF, myocardial contraction fraction (ratio of stroke to myocardial volume, ie, LV mass ratio/1.05) (myocardial density); mid LS, average peak systolic longitudinal strain of the medial segments; MI, history of myocardial infarction; MWT, maximum wall thickness; PWTd, posterior wall thickness at end diastole; RWT, relative wall thickness (2×PWT/LVEDD); S’, S’ wave of the lateral mitral annulus with pulsed-wave tissue Doppler; stroke, history of ischemic stroke; Vmax, peak aortic jet velocity.
Data are expressed as No. (%) or mean±standard deviation.
In patients able to undergo strain analysis (n=92), average GLS was –15.1%; 39 patients (42%) showed RELAPS value> 1; 82 (89%) patients had an SAB ratio> 2.1, and 39 (42%) had EFSR> 4.1. Figure 1B shows patient distribution according to these 3 LS-based indices.
No differences in clinical or demographic variables were found between the groups with RELAPS <1 or >1. The echocardiography variables showed that the RELAPS >1 group had significantly more severe AS and increased LV hypertrophic remodeling. No differences were found in the conventional parameters used to evaluate systolic function; however, myocardial contraction fraction was significantly lower in the group with normal apical strain. No differences were found in diastolic function parameters.
In the multivariate analysis, predictive echocardiography variables for strain with an apical sparing pattern were LV mass (OR,1.02; 95%CI, 1.01-1.03; P=.002), LV end-systolic volume (OR,0.97; 95%CI, 0.94-0.99); P=.014), aortic valve area (OR,0.10; 95%CI, 0.01-0.38; P=.018), and aortic ejection (OR, 0.98; 95%CI, 0.96-0.99; P=.010). The c-statistic was 85.6% (95%CI, 76.6%-94.7%).
In our series, patients with severe symptomatic AS without CA were highly likely to exhibit strain with an apical sparing phenotype and EFSR similar to that described in CA. These findings could have relevant clinical implications, as they would not be applicable in regular clinical practice for CA screening in patients with a condition as common as severe AS.