Left ventricular systolic function is one of the main prognostic determinants of cardiomyopathy and left ventricular ejection fraction (LVEF), the most widely used echocardiographic parameter both in clinical practice and in large research studies. Studies with new echocardiographic techniques haveshown thatglobal left-ventricular longitudinal strain isa good predictor of early systolic dysfunction,although it shows a weak correlation with normal or mildly abnormal LVEF measured by 2-dimensional echocardiography.1,2There is little published evidence on the predictive value of myocardial strain measured by vector velocity imaging.3,4 Our group has demonstrated excellent intra- and interobserver correlation for the estimation of longitudinal strain with this method, with interclass correlation coefficients of 0.97 and 0.81, respectively.5
The aim of this study was to analyze the correlation of global andregional longitudinal strain measured by vector velocity imaging with LVEF measured by 2-dimensional echocardiographyin a healthy population.
The study included 51 volunteers who agreed to undergo echocardiographic examination and who were in good cardiovascular health (no cardiovascular risk factors or previous cardiovascular disease, normal physical examination and blood pressure, normal Doppler echocardiogram, and an ultrasound window appropriate for objective evaluation of LVEF and strain). Examinations were conductedwith a Siemens Sequoia C-512 echocardiography scannerequipped with a 2.5-4MHz transducer. We measured LVEF by the Simpson rule in 2- and 4-chamber views, and the study ended with the determination of regional and global longitudinal strain (tracingendocardial borders). Regional longitudinal strain (at the basal, mid cavity, and apical levels) was calculated as the mean of the maximum systolic values in the anterior and inferior segments (2-chamber view) or in thelateral and septal segments (4-chamber view). Global longitudinal strain was calculated independently for 2- and 4-chamber views as themean of the 6 values obtained in each case, and total global longitudinal strainwas calculated as the mean of all 12 values. Qualitative variables are expressed as absolute number and percentage. Quantitative variables are shown as mean (standard deviation). Normal distribution was confirmed with the Shapiro-Wilk test, and differences between independent samples were therefore analyzed with Student's t test. Longitudinal strain (regional and global) and LVEF were compared by Pearson's correlation test and by uni- and multivariate analysis (simple linear regression). Differences were considered significant at P < .05.
Study population characteristics and mean values of variables are shown in Table 1. Twenty-two participants (43.1%) were women. Of the 612 longitudinal strain segments recorded, 586 were analyzed (feasibility 95.7%). The 26 segments not analyzed comprised 5 at the base,4 at mid cavity, and 4 at the apex in 4-chamber view and 4 at the base, 5 at mid-cavity, and 4 at the apex in 2-chamber view. A strong linear correlation was found between LVEF and apical 4-chamber longitudinal strain (R = –0.79; r2 = 0.62; P = .000), whereas the correlation was weak between LVEF and 4-chamber global longitudinal strain (R = –0.55; r2 = 0.3; P = .001), 2-chamber global longitudinal strain (R = –0.4; r2 = 0.16; P = .01), and total global longitudinal strain(R = –0.47; r2 = 0.23; P = .001). In the univariate analysis, basal and mid cavity strain showed no statistically significant correlation with LVEF in either the 2- or 4-chamber views (4-chamber base, P = .48; 4-chamber mid cavity, P = .71; 2-chamber base, P = .82; 2-chamber mid cavity, P = .64). In contrast, statistically significant correlations were found for 2- and 4-chamber apical strain. After the multivariate analysis, the only predictor of LVEF was 4-chamber longitudinal strain (Table 2); for every 1% reduction in 4-chamber apical longitudinal strain, LVEF increased by 1.45%.
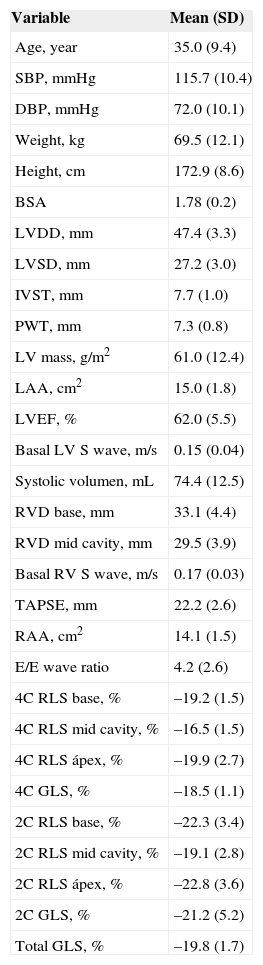
Baseline Characteristics of the 51 Healthy Study Participants
| Variable | Mean (SD) |
|---|---|
| Age, year | 35.0 (9.4) |
| SBP, mmHg | 115.7 (10.4) |
| DBP, mmHg | 72.0 (10.1) |
| Weight, kg | 69.5 (12.1) |
| Height, cm | 172.9 (8.6) |
| BSA | 1.78 (0.2) |
| LVDD, mm | 47.4 (3.3) |
| LVSD, mm | 27.2 (3.0) |
| IVST, mm | 7.7 (1.0) |
| PWT, mm | 7.3 (0.8) |
| LV mass, g/m2 | 61.0 (12.4) |
| LAA, cm2 | 15.0 (1.8) |
| LVEF, % | 62.0 (5.5) |
| Basal LV S wave, m/s | 0.15 (0.04) |
| Systolic volumen, mL | 74.4 (12.5) |
| RVD base, mm | 33.1 (4.4) |
| RVD mid cavity, mm | 29.5 (3.9) |
| Basal RV S wave, m/s | 0.17 (0.03) |
| TAPSE, mm | 22.2 (2.6) |
| RAA, cm2 | 14.1 (1.5) |
| E/E wave ratio | 4.2 (2.6) |
| 4C RLS base, % | –19.2 (1.5) |
| 4C RLS mid cavity, % | –16.5 (1.5) |
| 4C RLS ápex, % | –19.9 (2.7) |
| 4C GLS, % | –18.5 (1.1) |
| 2C RLS base, % | –22.3 (3.4) |
| 2C RLS mid cavity, % | –19.1 (2.8) |
| 2C RLS ápex, % | –22.8 (3.6) |
| 2C GLS, % | –21.2 (5.2) |
| Total GLS, % | –19.8 (1.7) |
Basal LV S wave, tissue Doppler S wave in the basal region of the left ventricle (mean of septal and lateral wall values); Basal RV S wave, tissue Doppler S wave in the basolateral segment of the right ventricle; BSA, body surface area; DBP, diastolic blood pressure; E/E wave ratio, ratio of the E wave velocity in the mitral annulus plane measured by pulsed Doppler imaging to that measured by tissue Doppler imaging; IVST, interventricular septum thickness; LAA, left atrium area; LV, left ventricle; LVDD, left ventricular diastolic diameter; LVEF, left ventricular ejection fraction; LVSD, left ventricular systolic diameter; PWT, posterior wall thickness; RAA, right atrium area; RVD, right ventricle diameter; SBP, systolic blood pressure; SD, standard deviation; TAPSE, tricuspid annular plane systolic excursion in M mode; 2C RLS, mean regional longitudinal strain in the anterior and inferior sectors (measured at 3 levels, base, mid ventricle, and apex); 4C RLS, mean regional longitudinal strain inthe lateral and septal sectors (measured at 3 levels, base, mid cavity, and apex); 2C GLS, global left ventricular longitudinal strain in 2-chamber view (mean of the 6 segments); 4C GLS, global left ventricular longitudinal strain in 4-chamber view (mean of the 6 segments); Total GLS, mean global longitudinal strain of the 12 segments from 2- and 4-chamber views.
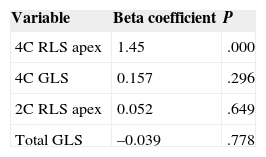
Multivariate Regression Analysis of Predictors of Left Ventricular Ejection Fraction. Variables Were Tested Where Univariate Analysis Yielded a P Value ≤ .01
| Variable | Beta coefficient | P |
|---|---|---|
| 4C RLS apex | 1.45 | .000 |
| 4C GLS | 0.157 | .296 |
| 2C RLS apex | 0.052 | .649 |
| Total GLS | –0.039 | .778 |
4C RLS apex, mean regional longitudinal strain measured at the apical level in 4-chamber view; 2C RLS, mean regional longitudinal strain measured at the apical level in 2-chamber view; 4C GLS, global left ventricular longitudinal strain in 4-chamber view (mean of the 6 segments); Total GLS, mean global longitudinal strain of the 12 segments from 2- and 4-chamber views.
We conclude that apical 4-chamber longitudinal strain is a good independent predictor of LVEF in healthy individuals. Given its predictive capacity and accessibility,we propose the use of this parameter as a single measure of strainin patients with conserved LVEF who require close monitoring of decreases in systolic function, for example patients undergoing chemotherapy. The explanation underlying this finding might be related to the type and orientation of myocardial fibers at the apex. According to the Torrent-Guasp model, the left segment acts as a chassis that supports the apical loop when it contracts, which leads to atrioventricular union and expulsion of the blood volume accumulated in the left ventricle. This idea is based on thearrangement of the apical muscle as 2 helical bands, which generate torsional movementas they slideonthe longitudinal axis; becausethis movement brings the base and apextogether, the ventricular cavity is compressed and the blood is pushed toward the exit tract of the left ventricle. This model thus assigns the apical fibers a central role in left ventricle contraction. We propose this hypothesis for testing in future studies of the correlation between apical deformation and LEVF in different clinical contexts, with a larger number of patients and a wider age range.