We would like to draw attention to some interesting findings about vortex flow analysis with vector flow mapping in a 14-year-old patient with a triple-chamber epicardial pacemaker, implanted when the child was aged 9 years for intermittent syncopal congenital complete atrioventricular block. The right ventricle (RV) lead and left ventricle (LV) lead were located at the cardiac apex and on the lateral wall, respectively.
Congenital complete atrioventricular block is a rare heart disorder, with an incidence of 1/15 000-20 000 births, that usually requires pacemaker implantation. Although pacemaker implantation has significantly reduced morbidity and mortality in patients with complete atrioventricular block, several studies have highlighted the potential negative effects of long-term RV pacing; indeed, the incidence of LV remodeling and dysfunction in RV-paced children due to ventricular dyssynchrony is around 6% to 13%.1 Thus, alternative pacing sites have been investigated, and the benefit of LV pacing seems to guarantee better preservation of LV efficacy and function as assessed by echocardiography,1,2 compared with RV pacing and regardless of the pacing mode.2,3
The possibility of noninvasive assessment of intracardiac hemodynamics in different pacing modalities is fascinating. Vector flow mapping is an ultrasound software, developed by the Hitachi group, which combines color Doppler and speckle tracking data to visualize intracardiac vortices4 and allows calculation of the vortex area and circulation (direction and intensity of the rotational force to the part surrounded with a closed curve) and apex-base relative pressure.5
We performed vector flow mapping analysis in this patient, focusing on relative pressure and vortex formation during diastole, and comparing right, left, and biventricular pacing (RV pacing, LV pacing, biventricular pacing) and sinus rhythm (SR). The images were acquired in 3-chamber section. The analyses performed were carried out in accordance with The Code of Ethics of the World Medical Association (Declaration of Helsinki) and informed consent was obtained.
LV function, as assessed by ejection fraction, was normal and showed no significant change when we compared different stimulation modes.
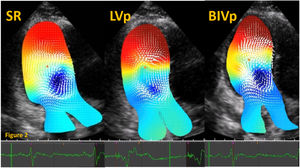
During SR, with normal PR interval, an anterior clockwise vortex (figure 1) was noticed throughout diastole, contributing to LV filling, and minimizing energy loss. A similar pattern of pressure distribution was noticed when we compared SR with LV and biventricular dual chamber pacemaker stimulation with higher basal pressure during early diastole and higher apical pressure (codified in red) at late diastole (figure 2), suggesting that electromechanical activation under these conditions leads to near normal apex contraction and uniform pressure distribution.
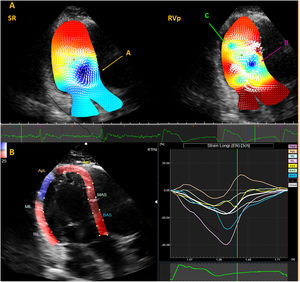
 and RVp (right) during diastole, showing an anterior clockwise vortex (orange arrow, A) during SR and an apical counterclockwise vortex (green arrow, C) in addition to the anterior clockwise vortex (pink arrow, B) during RVp. B: speckle tracking analysis during RVp, showing a prestretch in the apical posterolateral (ApL) segment, as well as an early septal contraction. RVp, right ventricular pacing; SR, sinus rhythm.")
Analysis of vortex formation. A: comparison between SR (left) and RVp (right) during diastole, showing an anterior clockwise vortex (orange arrow, A) during SR and an apical counterclockwise vortex (green arrow, C) in addition to the anterior clockwise vortex (pink arrow, B) during RVp. B: speckle tracking analysis during RVp, showing a prestretch in the apical posterolateral (ApL) segment, as well as an early septal contraction. RVp, right ventricular pacing; SR, sinus rhythm.
 at late diastole. The pressure distribution is displayed in a color map, where colors from red to yellow indicate higher relative pressure (with red representing the highest value), and colors from blue to green indicate lower relative pressure (with blue representing the lowest value). BIV, biventricular pacing; LVp, left ventricular pacing; SR, sinus rhythm.")
Analysis of pressure distribution. Relative pressure distribution during SR, LVp and BIVp showing apical higher pressure (codified with color from red to yellow) at late diastole. The pressure distribution is displayed in a color map, where colors from red to yellow indicate higher relative pressure (with red representing the highest value), and colors from blue to green indicate lower relative pressure (with blue representing the lowest value). BIV, biventricular pacing; LVp, left ventricular pacing; SR, sinus rhythm.
By contrast, RV stimulation caused a clockwise vortex and an apical counterclockwise vortex during late diastole (figure 1, upper panel), causing a suboptimal flow pattern during the isovolumetric contraction period. Moreover, the apical relative pressure was decreased close to the apical posterior wall, leading us to hypothesize that RV pacing causes a detrimental electrical delay of the LV apical posterior wall, resulting in lower pressure and abnormal counterclockwise vortex formation. This was also suggested by the speckle tracking analysis performed during RV stimulation, showing a prestretch in the apical posterolateral segment, as well as an early septal contraction (figure 1, lower panel).
Last, the analysis of the areas of LV vortices showed that vortices during SR (561mm2), biventricular pacing (442mm2) and LV pacing (449mm2) were larger than during RV pacing (326mm2).
Several previous studies have investigated vortex flow patterns in different clinical conditions, and it has been shown that, in patients with systolic dysfunction, the vortex was mainly located at the apex and persisted for a longer time through the cardiac cycle,6 potentially resulting in inefficient flow and increased oxygen consumption.
Although further studies are needed to confirm our findings, this case illustrates the potential of vector flow mapping to better understand cardiac mechanics in patients with ventricular pacing, and it may offer a novel index of early cardiac dysfunction.
FUNDINGThis research received no funding, but the first author, M. Avesani, is supported by an ESC Training Grant (N 000059503).
AUTHORS’ CONTRIBUTIONSM. Avesani: image acquisition, data interpretation, and drafting of the manuscript. A. Silini: image acquisition and drafting of the manuscript. E. Valdeolmillos: image acquisition and drafting of the manuscript. Z. Jalal: data interpretation and drafting of the manuscript. J.B. Thambo: conception of the work and critical revision. X. Iriart: conception of the work and critical revision.
CONFLICTS OF INTERESTNothing to disclose.