Risk stratification in patients with heart failure (HF) remains a challenge, especially considering the epidemiological importance of this disease.1 Several scoring systems have been developed, the best known being the Seattle Heart Failure Model.2 However, this model was derived from a patient cohort studied more than 20 years ago, before the advent of biomarkers. The lack of biomarkers in the Seattle Heart Failure Model is a major limitation, because many biomarkers have since been identified that reflect different pathophysiological pathways and are increasingly implicated in the complex syndrome of HF.3 Moreover, the use of biomarkers in combination can increase their effectiveness and accuracy.4
The Barcelona Bio-Heart Failure Risk Calculator (BCN Bio-HF Calculator)5 is a recently developed scoring system for stratifying mortality risk in HF patients. The BCN Bio-HF Calculator includes 11 clinical variables (age, sex, New York Heart Association functional class, left ventricular ejection fraction, sodium, estimated glomerular filtration rate, hemoglobin, and loop diuretic dose, as well as beta-blocker, angiotensin converting enzyme inhibitor/angiotensin II receptor blocker, and statin therapy). Besides these conventional variables, the BCN Bio-HF Calculator also evaluates 3 serum biomarkers: the N-terminal of pro B-type natriuretic peptide (NT-proBNP), a marker of myocardial stretch; high-sensitivity cardiac troponin T (hs-cTnT), a marker of myocyte injury; and high-sensitivity soluble ST2 (ST2), an index of myocardial fibrosis and remodeling. This calculator is designed to run with the availability of none, 1, 2 or 3 of the selected biomarkers, using the best model for each available combination. The calibration was good and the mean C statistic in the cross-validation analysis was 0.79.
External validation was not possible at the time of original publication due to the lack of cohorts with values for the 3 biomarkers.
The current objective was to externally validate the BCN Bio-HF Calculator. To do this, we examined patient data from the PROTECT study,6 which analyzed a well-characterized cohort of 151 patients in Boston with HF due to left ventricular systolic dysfunction.
The external validation procedure used measures of discrimination (C statistic, obtained from a generalization of the Somers Dxy rank correlation, which incorporates information from censored data in advance) and from calibration (Hosmer–Lemeshow test for censored survival data).7 The statistical analysis was conducted with R program version 2.15.2.
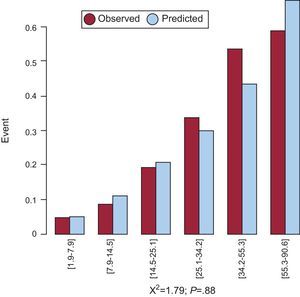
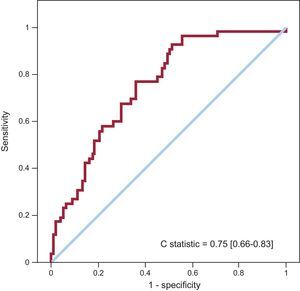
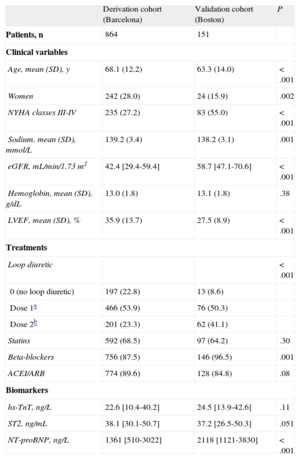
The variables evaluated in the calculator and the corresponding data from the derivation and external validation cohorts are shown in the table. The model with the 3 biomarkers showed good calibration at 1 year (chi-square=3.0; P=.39), 2 years (chi-square=3.6; P=.61), and 3 years (chi-square=1.8; P=.88) (Figure 1), and showed evidence of a good discrimination capacity (C statistic=0.75; 95% confidence interval, 0.66-0.83) (Figure 2). When all the models were analyzed, the general calibration was correct (P>.05 in the Hosmer-Lemeshow test for almost all the models and evaluation times) and the C statistic ranged between 0.72 and 0.76.
Clinical Characteristics of the Derivation and Validation Cohorts
| Derivation cohort (Barcelona) | Validation cohort (Boston) | P | |
| Patients, n | 864 | 151 | |
| Clinical variables | |||
| Age, mean (SD), y | 68.1 (12.2) | 63.3 (14.0) | < .001 |
| Women | 242 (28.0) | 24 (15.9) | .002 |
| NYHA classes III-IV | 235 (27.2) | 83 (55.0) | < .001 |
| Sodium, mean (SD), mmol/L | 139.2 (3.4) | 138.2 (3.1) | .001 |
| eGFR, mL/min/1.73 m2 | 42.4 [29.4-59.4] | 58.7 [47.1-70.6] | < .001 |
| Hemoglobin, mean (SD), g/dL | 13.0 (1.8) | 13.1 (1.8) | .38 |
| LVEF, mean (SD), % | 35.9 (13.7) | 27.5 (8.9) | < .001 |
| Treatments | |||
| Loop diuretic | < .001 | ||
| 0 (no loop diuretic) | 197 (22.8) | 13 (8.6) | |
| Dose 1a | 466 (53.9) | 76 (50.3) | |
| Dose 2b | 201 (23.3) | 62 (41.1) | |
| Statins | 592 (68.5) | 97 (64.2) | .30 |
| Beta-blockers | 756 (87.5) | 146 (96.5) | .001 |
| ACEI/ARB | 774 (89.6) | 128 (84.8) | .08 |
| Biomarkers | |||
| hs-TnT, ng/L | 22.6 [10.4-40.2] | 24.5 [13.9-42.6] | .11 |
| ST2, ng/mL | 38.1 [30.1-50.7] | 37.2 [26.5-50.3] | .051 |
| NT-proBNP, ng/L | 1361 [510-3022] | 2118 [1121-3830] | < .001 |
ARB, angiotensin II receptor blocker; LVEF, left ventricular ejection fraction; eGFR, estimated glomerular filtration rate; ACEI, angiotensin-converting enzyme inhibitor; NT-proBNP, N-terminal of pro B-type natriuretic peptide; hs-cTnT, high-sensitivity cardiac troponin T; ST2, high-sensitivity soluble ST2; NYHA: New York Heart Association.
Data are expressed as no. (%), mean (standard deviation) or median [interquartile range] for levels of biomarkers.
 for the model including the 3 biomarkers.")
 obtained with the Barcelona Bio-Heart Failure Calculator in the PROTECT cohort (Boston).")
Risk prediction is the cornerstone of HF management, and the development of a sufficiently precise risk Calculator provides the potential for personalized treatment. The BCN Bio-HF Calculator is derived from a real-life cohort of contemporaneously treated HF patients and, in addition to conventional predictive factors, includes 3 highly precise serum biomarkers of heart disease and dysfunction whose use is supported in clinical practice guidelines.8
Some scores2,9 have the advantage of having been obtained from large derivation cohorts; however, some of the participants in those study cohorts were also participants in clinical trials, and a limitation of these models is that they do not include measures of biomarkers.
Despite the significant differences between the 2 cohorts examined here, this external validation is superior to the average external validation obtained with the Seattle Heart Failure Model, which varied from 0.68 to 0.81 in different populations, with a mean area under the curve of 0.73 overall, and < 0.70 for the 3 largest cohorts.2 The BCN Bio-HF Calculator provides the individual mortality risk at several time points (shown by months on the graph on the website) without the need for a score calculation as an intermediate step. As an added benefit, the BCN Bio-HF Calculator can also predict life expectancy.
With increasing understanding of the role of biomarkers in HF, risk prediction strategies are needed that incorporate clinical variables and biochemical measures. The BCN Bio-HF Calculator, which incorporates 3 biomarkers recommended in clinical practice guidelines, in addition to simple clinical variables, shows substantial precision in the prediction of risk in patients from different geographical regions.
CONFLICTS OF INTERESTFor the initial development of the calculator, ST2 analysis was provided by Critical Diagnostics, and analysis of hs-cTnT and NT-proBNP by Roche Diagnostics, who also donated an unconditional subsidy for the statistical development and online application. A. Bayes-Genis has received speaker honoraria from Roche Diagnostics and Critical Diagnostics and J. Lupón has received similar payments from Roche Diagnostics. A. Bayes-Genis and J. Lupón have acquired stock shares in Critical Diagnostics. The BCN Bio-HF Calculator was registered by J. Lupón and A. Bayes-Genis.