

Patients with aortic stenosis (AS) exhibit left ventricular (LV) remodeling and replacement myocardial fibrosis (RMF). Whether sST2 is associated with RMF measured by cardiac magnetic resonance and with sex remains unknown.
MethodsWe recruited 79 consecutive patients (73.0 [68.0-78.0] years; 61% men) with severe isolated AS underdoing valve replacement. RMF was identified and quantified by late gadolinium enhancement (LGE). Serum sST2 levels were determined.
ResultsRMF was associated with higher circulating sST2 levels, LV hypertrophy and dilation, and lower LV ejection fraction. All patients with LV dysfunction had RMF. Circulating levels of sST2 ≥ 28.8 ng/mL were associated with RMF and greater LV hypertrophy. LGE mass was correlated with LV remodeling and sST2. Of note, sST2 levels were also associated with the RMF pattern, being higher in midwall than in subendocardial fibrosis. Multivariate analyses showed that only LV ejection fraction and sST2 levels were associated with RMF. Moreover, men had higher levels of sST2 and RMF. RMF was associated with higher LV dilation and hypertrophy only in men and was correlated with LGE mass.
ConclusionsSST2 was an independent factor for RMF in patients with severe isolated AS. The presence of RMF was predicted by sST2 ≥ 28.2 ng/mL, and was associated with greater LV hypertrophy. sST2 expression and clinical associations may be sex-specific.
Keywords
Aortic stenosis (AS) is a major form of valvular heart disease.1 Due to a complex process involving left ventricular (LV) hypertrophy and progressive myocardial fibrosis, AS leads to heart failure (HF) and death within 5 years upon diagnosis of severe AS.2 Replacement myocardial fibrosis (RMF) consists of collagen deposition upon myocyte apoptosis or necrosis. In AS, cardiac magnetic resonance (CMR) is a well-established, noninvasive method to quantify RMF using late postgadolinium myocardial enhancement sequences (LGE).3 RMF is associated with LV remodeling4 and high morbidity and mortality.2,5,6 The pathophysiology of AS is seemingly sex-dependent.7–9 Understanding the sex differences in RMF in AS patients might help to identify specific therapeutic targets.
The interleukin 1 receptor-like 1 (IL1RL1) gene belongs to the interleukin (IL)-1 receptor family and mainly encodes a membrane-bound ST2 receptor (ST2L) and a secreted soluble ST2 (sST2) that serves as an IL-33 decoy receptor.10 The expression of sST2 is enhanced in myocardium and serum from AS patients.11,12 Interestingly, sST2 induces human cardiac fibroblasts activation, and the synthesis of collagen, profibrotic, and proinflammatory molecules.13,14 In AS patients, sST2 levels are associated with HF symptoms and outcomes.15,16 Moreover, sST2 levels could be a marker for LV dysfunction in AS.17 Recent data suggest the use of sex-specific sST2 cutoff values to improve diagnosis and increase its cardiovascular prognostic value.18,19 We aimed to investigate whether sST2 levels could be used to identify RMF in a subset of patients with severe isolated AS, as well as whether sST2 levels are sex-related.
METHODSA brief description of the methods is provided below. For further information, an extended version of materials and methods is available in the supplementary methods of the supplementary data.
Patient populationThis cross-sectional, retrospective, observational and descriptive study included patients with severe isolated AS referred to Hospital Universitario de Navarra for aortic valve (AV) replacement from June 2013 to February 2015. AS was diagnosed following the European Society of Cardiology recommendations.20 Serum were collected 24hours before the surgery and kept at −80° C until batch analyses. Concomitant coronary artery disease (CAD) was evaluated. Informed consent was obtained. The study protocol agreed with the ethics guidelines of the 1975 Declaration of Helsinki and was approved by the human research committee of our institution (Comité Ético de Experimentación Clínica. Gobierno de Navarra, Departamento de Salud; Ethics number: 2015/26).
EchocardiographyTransthoracic echocardiography was performed with a VIVID7 3.5MHz ultrasound scanner (GE Ultrasound) or an IE-33 (Phillips Healthcare), according to current guidelines. Transaortic maximum and mean pressure gradients and AV area were assessed by continuity equation.
Cardiac magnetic resonanceCMR imaging studies were performed using a 1.5 T scanner (Avanto). Steady-state free precession sequences were used to assess LV dimensions, mass and function, and AV area. The LGE images were acquired 10 to 15minutes after injection of intravenous gadolinium contrast agent (Dotarem, 0.1 mmol/kg body weight). Inversion recovery-prepared spoiled gradient echo images were acquired to detect areas of LGE. Inversion delay times were optimized to null normal myocardium. Cine images (steady-state free precession) were used to assess LV volumes, mass, and function. Endocardial and epicardial LV borders were manually contoured using ARGUS software (Siemens Medical Solutions). AS severity was assessed using CMR-derived planimetry of the AV area as well as phase-contrast sequences to determine flow velocities.
LGE mass was semiautomatically calculated using QMass MR7 software. Intramyocardial (diffuse or focal and including the interventricular junction) and subendocardial fibrosis, as well as widespread diffuse fibrosis from the mitral and aortic rings, were considered pathological.
sST2 levelsCirculating sST2 levels were quantified using a commercially available enzyme-linked immunosorbent assay (Presage, Critical Diagnostics) following the manufacturer's protocol.
Statistical analysesCategorical variables are expressed as percentages and were compared using the chi-square test, or Fisher exact test, as appropriate. Continuous variables were assessed using the unpaired Student t- test and 1-way analysis of variance if normally distributed. Otherwise, the Mann-Whitney U test or Kruskal-Wallis test were used. Post hoc tests were performed when appropriate. The Pearson or Spearman correlation coefficients were calculated. Linear regression modeling was used to show the clinical and biological markers able to stratify/identify patients with RMF. GraphPad Prism 9.0 software, SPSS version 28.0.1.0 or the R statistical package, v. 3.6 were used.
Data availability statementThe data supporting the findings of this study are available from the corresponding author, upon reasonable request.
RESULTSClinical and laboratory characteristics of the study cohortThis cross-sectional, retrospective, observational and descriptive study included 79 all-coming patients (60.8% men, 73.0 [68.0-78.0] years) with severe AS. The baseline and demographic characteristics of our cohort are displayed in table 1. Based on previously published yields of serum ST2 in AS patients undergoing valve replacement,21 we calculated the magnitude of effect size to be 0.625.
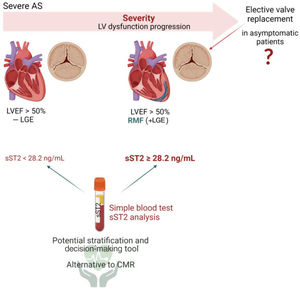
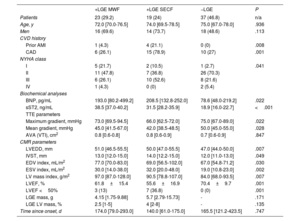
Baseline and demographic characteristics of the cohort including focal myocardial replacement fibrosis assessment by late gadolinium enhancement cardiac magnetic resonance imaging
| Total | +LGE | −LGE | P | |
|---|---|---|---|---|
| Patients | 79 (100) | 42 (53.2) | 37 (46.8) | n/a |
| Age, y | 73.0 [68.0-78.0] | 73.0 [70.0-78.0] | 75.0 [67.0-78.0] | .918 |
| Men | 48 (60.8) | 30 (71.4) | 18 (48.6) | .039 |
| BMI, kg/m2 | 28.0 [25.0-32.0] | 28.0 [26.0-31.0] | 28.0 [25.0-33.0] | .817 |
| HTN | 57 (72.2) | 33 (78.6) | 24 (64.9) | .175 |
| HLP | 52 (65.8) | 25 (59.5) | 27 (73) | .209 |
| DM | 24 (30.4) | 13 (31) | 11 (29.7) | .906 |
| Smoking | ||||
| Current smoker | 7 (8.9) | 5 (11.9) | 2 (5.4) | .569 |
| Exsmoker | 26 (32.9) | 4 (33.3) | 12 (32.4) | |
| CVD history | ||||
| AF | 11 (13.9) | 7 (16.7) | 4 (10.8) | .453 |
| Prior stroke | 5 (6.3) | 2 (4.8) | 3 (8.1) | .661 |
| Prior AMI | 5 (6.3) | 5 (11.9) | 0 (0) | .057 |
| CAD | 31 (39.2) | 21 (50) | 10 (27) | .037 |
| NYHA class | .034 | |||
| I | 8 (10.1) | 7 (16.7) | 1 (2.7) | |
| II | 44 (55.7) | 18 (42.9) | 26 (70.3) | |
| III | 24 (30.4) | 16 (38.1) | 8 (21.6) | |
| IV | 3 (3.8) | 1 (2.4) | 2 (5.4) | |
| Drugs | ||||
| ACEI/ARB | 41 (51.9) | 21 (50) | 20 (54.1) | .719 |
| MRA | 1 (1.3) | 0 (0) | 1 (2.7) | .468 |
| Beta-blockers | 22 (27.8) | 15 (35.7) | 7 (18.9) | .097 |
| Statins | 53 (67.1) | 32 (76.2) | 21 (56.8) | .067 |
| Diuretics | 48 (60.8) | 27 (64.3) | 21 (56.8) | .494 |
| Biochemical analyses | ||||
| Hb, g/dL | 14.0 [12.8-15.0] | 13.4 [12.2-14.4] | 13.9 [12.4-14.7] | .099 |
| eGFR, mL/min/1.73 m2 | 77.0 [61.0-92.0] | 78.0 [60.5-91.5] | 76.0 [61.0-97.0] | .680 |
| LDL, mg/dL | 102.0 [84.0-134.0] | 92.5 [77.2-113.8] | 121.0 [96.5-143.5] | .001 |
| BNP, pg/mL | 139.5 [61.5-271] | 196 [86-352.4] | 78.6 [46-219.7] | .006 |
| sST2, ng/mL | 24.1 [18.4-37.5] | 37.2 [31.2-39.8] | 18.9 [16.0-22.7] | <.001 |
| TTE parameters | ||||
| BAV | 39 (50.6) | 23 (57.5) | 16 (43.2) | .334 |
| Maximum gradient, mmHg | 73.0 [65.5-91.0] | 70.0 [63.2-91.5] | 75.0 [67.0-89.0] | .228 |
| Mean gradient, mmHg | 48.0 [41.0-55.0] | 44.0 [41.0-54.5] | 50.0 [45.0-55.0] | .080 |
| AVA (VTI), cm2 | 0.9 [0.8-1.0] | 0.9 [0.8-1.0] | 0.8 [0.8-1.0] | .948 |
| CMR parameters | ||||
| LVEDD, mm | 49.0 [45.0-53.0] | 50.5 [47.0-55.8] | 47.0 [44.0-50.0] | .001 |
| IVST, mm | 13.0 [12.0-14.5] | 13.5 [12.0-15.0] | 12.0 [11.0-13.0] | .017 |
| EDV index, mL/m2 | 70.0 [55.8-78.0] | 76.0 [59.5-92.2] | 67.0 [54.8-71.2] | .010 |
| ESV index, mL/m2 | 23.0 [14.0-34.2] | 31.0 [17.0-41.8] | 19.0 [10.8-23.0] | <.001 |
| LV mass index, g/m2 | 88.0 [74.2-98.5] | 94.0 [83.5-120.5] | 84.0 [68.0-93.5] | <.001 |
| LVEF, % | 66.0 [56.0-76.5] | 57.0 [48.5-70.0] | 68.5 [64.8-77.2] | <.001 |
| LVEF <50% | 10 (12.7) | 10 (23.8) | 0 (0) | .001 |
| LGE mass, g | 0.33 [0-5.09] | 5.1 [2.35-12.37] | - | - |
| LGE LV mass, % | 0.5 [0-3] | 3 [1-6] | - | - |
| Time since onset, d | 160.5 [82.0-405.8] | 156.5 [71.5-284.2] | 165.5 [121.2-423.5] | .589 |
ACEI, angiotensin converting enzyme inhibitors; AF, atrial fibrillation; AMI, acute myocardial infarction; ARB, angiotensin II receptor blockers; AVA (VTI), aortic valve area (continuity equation by velocity time integral); BAV, bicuspid aortic valve; BMI, body mass index; BNP, brain natriuretic peptide; CAD, coronary artery disease; CMR, cardiac magnetic resonance imaging; CVD, cardiovascular disease; DM, diabetes mellitus; EDV, end-diastolic volume; ESV, end-systolic volume; eGFR, estimated glomerular filtration rate; Hb, haemoglobin; HLP, hyperlipidaemia; HTN, hypertension; IVST, interventricular septum thickness; LDL, low density lipoprotein; LGE, late gadolinium enhancement; LVEDD, left ventricle end-diastolic diameter; LVEF, left ventricular ejection fraction; MRA, mineralocorticoid receptor antagonists; NYHA, New York Heart Association; sST2, soluble ST2; TTE, transthoracic echocardiography; y, years; n/a, no applicable.
Univariate analyses were performed to compare the baseline and demographic characteristics of the patients classified as +LGE and −LGE.
Data are expressed as No. (%) or median [interquartile range].
To validate the sample size and power of our cohort, Cohen's F effect size (f2=0.39 and α=0.05) were calculated. The power of our sample size was calculated to be> 90%.
Replacement myocardial fibrosis is associated with greater left ventricular remodeling and dysfunction
Patients were classified as LGE-positive or -negative in table 1. All variables recorded in table 1 were compared among the LGE groups using chi-square tests for categorical variables, and unpaired univariate Student t or Mann-Whitney U tests for continuous variables. Importantly, LV RMF was detected in 53.2% patients and was more likely in men (71.4% vs. 48.6%, P=.039). CAD prevailed among positive LGE patients (50% vs. 27%, P=.037). Positive LGE patients had higher LV dilation, enhanced LV mass and lowered ejection fraction as evidenced by the CMR parameters LV end-diastolic diameter (P=.001), interventricular septum thickness (P=.017), indexed end-diastolic volume (EDV) (P=.010), indexed end-systolic volume (ESV) (P<.001), indexed LV mass (P=.001) and left ventricular ejection fraction (LVEF) (P <.001), all regardless of the degree of stenosis. Only positive LGE patients (23.8%, P=.001) had LVEF <50%.
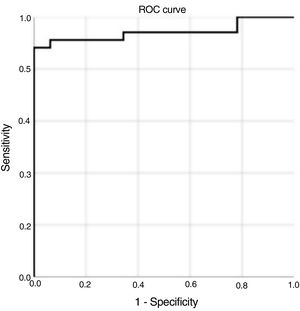
Circulating sST2 levels predict RMF in patients with severe ASLevels of sST2 were higher in patients with RMF than in those without (37.2 (31.2 to 39.8) vs. 18.9 [16.0 to 22.7], P <.001). On receiver operating characteristic (ROC) curve analysis and Youden's statistic, the sST2 cutoff for the identification of patients with RMF was ≥ 28.2 ng/mL (88% sensitivity, 100% specificity; 0.942 AUC, P <.001) (figure 1). Patients with sST2≥ 28.2 had enhanced LV hypertrophy compared with those with sST2 <28.2 (interventricular septum thickness, P=.022; indexed LV mass, P=.010) (table 1 of the supplementary data). Of note, sST2≥ 28.2 was found only in LGE-positive patients.
LGE LV mass is positively associated with LV remodeling and sST2 levels curve and cutoff score for circulating replace by sST2 for the diagnosis of replace by RMF in patients with severe AS. Area under the curve (AUC) for replace by sST2: 0.942 (88% sensitivity, 100% specificity; 0.942 AUC, P <.001).")
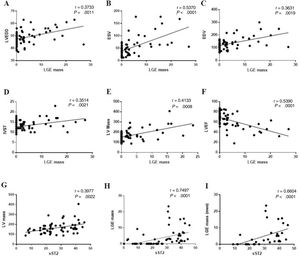
LGE LV mass positively correlated with CMR parameters suggesting a higher LV dilation (LV end-diastolic diameter r=0.3733, P=.001; ESV r=0.5370, P=.002; EDV r=0.3631, P <.001) (figure 2A-C) and hypertrophy (interventricular septum thickness r=0.3514, P=.002; LV mass r=0.4133, P=.001) (figure 2D,E), and with a significantly lowered LVEF (r=−5390, P <.001) (figure 2F). Circulating sST2 levels were associated with higher LV mass (r=0.3977, P=.002) (figure 2G). Importantly, LGE LV mass was strongly correlated with circulating sST2 levels (r=0.7497, P <.001) (figure 2H).
, LV hypertrophy (D-E), LV dysfunction (F). Circulating sST2 was correlated with LV mass (G), LGE mass (H) and LGE mass only in men (I) when studying each sex group. ESV, end-systolic volume; IVST, interventricular septum thickness; LGE, late gadolinium enhancement; LV, left ventricle; LVEDD, left ventricle end-diastolic diameter; sST2, soluble ST2.")
Late gadolinium enhancement mass correlation with cardiac magnetic resonance parameters and circulating levels of sST2. LGE mass was correlated with LV dilation markers (A-C), LV hypertrophy (D-E), LV dysfunction (F). Circulating sST2 was correlated with LV mass (G), LGE mass (H) and LGE mass only in men (I) when studying each sex group. ESV, end-systolic volume; IVST, interventricular septum thickness; LGE, late gadolinium enhancement; LV, left ventricle; LVEDD, left ventricle end-diastolic diameter; sST2, soluble ST2.
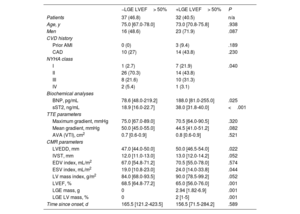
We investigated different profiles of RMF, namely midwall fibrosis and subendocardial fibrosis. Multivariate comparisons among the 3 groups are shown in table 2, and the corresponding post hoc analyses can be found in table 2 of the supplementary data. As shown in table 1, 42 (53.2%) patients had RMF, of which 23 (54.8%) patients had midwall fibrosis and 19 (42.4%) had subendocardial fibrosis (table 2). Concomitant CAD and prior anterior myocardial infarction were more frequent in patients with subendocardial fibrosis than in those with midwall fibrosis (78.9% vs. 27.0%, P p=.001; 21.1% vs. 4.3%, P=.008, respectively). Alignment of coronary arterial segments and myocardial perfusion territories was reported in 14 out of 15 patients with CAD and positive LGE subendocardial fibrosis (73.7% of all patients with subendocardial fibrosis). In 1 patient with CAD (5.26%), subendocardial fibrosis was not associated with the ischemic coronary artery, and 4 patients with subendocardial fibrosis did not have previous CAD.
Multivariate comparisons of characteristics of patients grouped according to the presence and profiles of focal myocardial replacement fibrosis
| +LGE MWF | +LGE SECF | −LGE | P | |
|---|---|---|---|---|
| Patients | 23 (29.2) | 19 (24) | 37 (46.8) | n/a |
| Age, y | 72.0 [70.0-76.5] | 74.0 [69.5-78.5] | 75.0 [67.0-78.0] | .936 |
| Men | 16 (69.6) | 14 (73.7) | 18 (48.6) | .113 |
| CVD history | ||||
| Prior AMI | 1 (4.3) | 4 (21.1) | 0 (0) | .008 |
| CAD | 6 (26.1) | 15 (78.9) | 10 (27) | .001 |
| NYHA class | ||||
| I | 5 (21.7) | 2 (10.5) | 1 (2.7) | .041 |
| II | 11 (47.8) | 7 (36.8) | 26 (70.3) | |
| III | 6 (26.1) | 10 (52.6) | 8 (21.6) | |
| IV | 1 (4.3) | 0 (0) | 2 (5.4) | |
| Biochemical analyses | ||||
| BNP, pg/mL | 193.0 [80.2-499.2] | 208.5 [132.8-252.0] | 78.6 [48.0-219.2] | .022 |
| sST2, ng/mL | 38.5 [37.0-40.2] | 31.5 [28.2-35.9] | 18.9 [16.0-22.7] | <.001 |
| TTE parameters | ||||
| Maximum gradient, mmHg | 73.0 [69.5-94.5] | 66.0 [62.5-72.0] | 75.0 [67.0-89.0] | .022 |
| Mean gradient, mmHg | 45.0 [41.5-67.0] | 42.0 [38.5-48.5] | 50.0 [45.0-55.0] | .028 |
| AVA (VTI), cm2 | 0.8 [0.6-0.8] | 0.8 [0.6-0.9] | 0.7 [0.6-0.9] | .847 |
| CMR parameters | ||||
| LVEDD, mm | 51.0 [46.5-55.5] | 50.0 [47.0-55.5] | 47.0 [44.0-50.0] | .007 |
| IVST, mm | 13.0 [12.0-15.0] | 14.0 [12.2-15.0] | 12.0 [11.0-13.0] | .049 |
| EDV index, mL/m2 | 77.0 [70.0-83.0] | 69.0 [56.5-102.0] | 67.0 [54.8-71.2] | .030 |
| ESV index, mL/m2 | 30.0 [14.0-38.0] | 32.0 [20.0-48.0] | 19.0 [10.8-23.0] | .002 |
| LV mass index, g/m2 | 97.0 [87.0-128.0] | 90.5 [78.8-107.0] | 84.0 [68.0-93.5] | .007 |
| LVEF, % | 61.8±15.4 | 55.6±16.9 | 70.4±9.7 | .001 |
| LVEF <50% | 3 (13) | 7 (36.8) | 0 (0) | .001 |
| LGE mass, g | 4.15 [1.75-9.88] | 5.7 [2.79-15.73] | - | .171 |
| LGE LV mass, % | 2.5 [1-5] | 4 [2-8] | - | .135 |
| Time since onset, d | 174.0 [79.0-293.0] | 140.0 [61.0-175.0] | 165.5 [121.2-423.5] | .747 |
AMI, acute myocardial infarction; AVA (VTI), aortic valve area (continuity equation by velocity time integral); BNP, brain natriuretic peptide; CAD, coronary artery disease; CMR, cardiac magnetic resonance imaging; CVD, cardiovascular disease; EDV, end-diastolic volume; ESV, end-systolic volume; IVST, interventricular septum thickness LGE, late gadolinium enhancement; LV, left ventricle; LVEDD, left ventricle end-diastolic diameter; LVEF, left ventricular ejection fraction; MWF, midwall fibrosis; NYHA, New York Heart Association; SECF, subendocardial fibrosis; sST2, soluble ST2; TTE, transthoracic echocardiography; n/a, no applicable.
Data are expressed as No. (%), mean±standard deviation, or median [interquartile range].
Overall, patients with LGE-positive subendocardial fibrosis had significantly more dilated and worsened LVEF (even <50%) (LV end-diastolic diameter: 50.0 [47.0-55.5] vs. 47.0 [44.0-50.0], P=.019; indexed EDV: 69.0 [56.5-102.0] vs. 67.0 [54.8-71.2], P=.037; indexed ESV: 32.0 [20.0-48.0] vs. 19.0 [10.8-23.0], P=.001; LVEF: 55.6±16.9 vs. 70.4±9.7, P=.001), while patients with midwall fibrosis were more prone to develop LV hypertrophy, as shown by the indexed LV mass (g/m2): 97.0 [87.0-128.0] vs. 84.0 [68.0-93.5], P=.004.
Levels of sST2 were higher in patients with midwall fibrosis than in those with subendocardial fibrosis (38.5 [37.0-40.2] vs. 31.5 [28.2-35.9], P=.006). Nevertherless, no LGE mass differences were found between midwall and subendocardial fibrosis.
LVEF and sST2 levels are indepently associated with RMF in AS patients with preserved LVEF (> 50%)
LV dysfunction was only reported in patients with RMF (table 2). Two groups of severe AS patients with preserved LVEF (> 50%) were distinguished: a) those with no fibrosis (-LGE) and b) with fibrosis (+LGE) (table 3). A tendentiously increased LV hypertrophy (interventricular septum thickness, P=.052; indexed LV mass, P=.052; LGE mass, P=.001; LGE LV mass, P=.001) and significant dilation (LV end-diastolic diameter, P=.022; and indexed ESV, P=.044) were reported in +LGE. That was in parallel with worsened LV function (LVEF % in −LGE vs. +LGE was 68.5 [64.8-77.2] vs. 65.0 [56.0-76.0], P=.001, respectively). Of note, brain natriuretic peptide (BNP) levels were significantly higher in patients with fibrosis than in those without (188 [79.5-283.5] vs. 78.6 [46-219], respectively, P=.025). Strikingly, sST2 levels were significantly higher in patients with LVEF> 50% and concomitant fibrosis than in those without (38.0 [31.8-40.0] vs. 18.9 [16.0-22.7], P<.001), in line with our findings in table 1.
Univariate comparisons of the characteristics of the cohort according to the presence of myocardial replacement fibrosis in patients with preserved LVEF (> 50%)
| −LGE LVEF> 50% | +LGE LVEF> 50% | P | |
|---|---|---|---|
| Patients | 37 (46.8) | 32 (40.5) | n/a |
| Age, y | 75.0 [67.0-78.0] | 73.0 [70.8-75.8] | .938 |
| Men | 16 (48.6) | 23 (71.9) | .087 |
| CVD history | |||
| Prior AMI | 0 (0) | 3 (9.4) | .189 |
| CAD | 10 (27) | 14 (43.8) | .230 |
| NYHA class | |||
| I | 1 (2.7) | 7 (21.9) | .040 |
| II | 26 (70.3) | 14 (43.8) | |
| III | 8 (21.6) | 10 (31.3) | |
| IV | 2 (5.4) | 1 (3.1) | |
| Biochemical analyses | |||
| BNP, pg/mL | 78.6 [48.0-219.2] | 188.0 [81.0-255.0] | .025 |
| sST2, ng/mL | 18.9 [16.0-22.7] | 38.0 [31.8-40.0] | <.001 |
| TTE parameters | |||
| Maximum gradient, mmHg | 75.0 [67.0-89.0] | 70.5 [64.0-90.5] | .320 |
| Mean gradient, mmHg | 50.0 [45.0-55.0] | 44.5 [41.0-51.2] | .082 |
| AVA (VTI), cm2 | 0.7 [0.6-0.9] | 0.8 [0.6-0.9] | .521 |
| CMR parameters | |||
| LVEDD, mm | 47.0 [44.0-50.0] | 50.0 [46.5-54.0] | .022 |
| IVST, mm | 12.0 [11.0-13.0] | 13.0 [12.0-14.2] | .052 |
| EDV index, mL/m2 | 67.0 [54.8-71.2] | 70.5 [55.0-78.0] | .574 |
| ESV index, mL/m2 | 19.0 [10.8-23.0] | 24.0 [14.0-33.8] | .044 |
| LV mass index, g/m2 | 84.0 [68.0-93.5] | 90.0 [78.5-99.2] | .052 |
| LVEF, % | 68.5 [64.8-77.2] | 65.0 [56.0-76.0] | .001 |
| LGE mass, g | 0 | 2.94 [1.82-6.9] | .001 |
| LGE LV mass, % | 0 | 2 [1-5] | .001 |
| Time since onset, d | 165.5 [121.2-423.5] | 156.5 [71.5-284.2] | .589 |
AMI, acute myocardial infarction; AVA (VTI), Aortic valve area (continuity equation by velocity time integral); BNP, brain natriuretic peptide; CAD, coronary artery disease; CMR, cardiac magnetic resonance imaging; CVD, cardiovascular disease; EDV, end-diastolic volume; ESV, end-systolic volume; IVST, interventricular septum thickness LGE, late gadolinium enhancement; LV, left ventricle; LVEDD, left ventricle end-diastolic diameter; LVEF, left ventricular ejection fraction; MWF, midwall fibrosis; NYHA, New York Heart Association; SECF, subendocardial fibrosis; sST2, soluble ST2; TTE, transthoracic echocardiography; n/a, no applicable.
Data are expressed as No. (%), or median [interquartile range].
A multivariate linear regression model using backward selection revealed that LVEF and sST2 levels were independedently associated with RMF levels (table 4). The lower the LVEF, the higher the burden of RMF and viceversa. For each 1% increase in LVEF, the RMF was decreased by 0.22 units. Interestingly, regardless of the LVEF, sST2 levels remained associated with RMF: 1 ng/mL sST2 was associated with an increase of 0.17 units of fibrosis. Distribution of residuals of the model were approximately normal, but with increassing variance. Thus, to further confirm the significance of the observed associations, the direction and the relative magnitude, Yeo-Johnson transformations were applied to the dependent variable (RMF) after calculating the lambda value (−0.75) by the maximum likelihood method.22 Modeling the relationship among our transformed dependent variable (RMF) and the independent variables (sST2 and LVEF) revealed no differences to the original multivariate linear regression model (table 3 of the supplementary data). Finally, linear regression assumptions were checked with gvlma (Global Validation of Linear Models Assumptions) package in R.23 Since myocardial fibrosis could be secondary to AS or CAD, we further analyzed our data by multivariate linear regression excluding those patients with myocardial infarction and with CAD (table 4 of the supplementary data). These findings are consistent with our original model (table 4). We finally analyzed the internal validity of our results by bootstrapping, as specified in Methods. The results are displayed in table 5 of the supplementary data and confirm the statistical robustness of our analyses.
Multivariate linear regression model with stepwise backward selection
| Statistical estimator | 95%CI | |
|---|---|---|
| Intercept | 13.33 | (7.013 to 19.66) |
| sST-2, ng/mL | 0.17 | (0.06 to 0.27) |
| LVEF, % | −0.22 | (−0.30 to 0.14) |
Fibrosis as dependent variable, and sST2 and LVEF as independent variables.
95%CI, 95% confidence interval; LVEF, left ventricular ejection fraction.
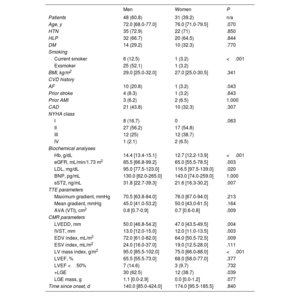
Pathological sex-related differences have been proposed to underlie the phenoytpe of AS. Accordingly, our cohort was additionally grouped by sex (table 5). Differences between the sexes for the recorded quantitative parameters were studied using univariate analyses. Smoking and history of atrial fibrillation differed significanlty between the sexes (P <.001 and P=.043, respectively). As expected, AV area was higher in men than in women (P=.009). Nevertheless, gradients (maximum gradient P=0.213; mean gradient P=0.164 and LVEF (P=.377) did not differ between the sexes.
Univariate analyses of the sex differences in baseline and demographic characteristics of the cohort
| Men | Women | P | |
|---|---|---|---|
| Patients | 48 (60.8) | 31 (39.2) | n/a |
| Age, y | 72.0 [68.0-77.0] | 76.0 [71.0-79.5] | .070 |
| HTN | 35 (72.9) | 22 (71) | .850 |
| HLP | 32 (66.7) | 20 (64.5) | .844 |
| DM | 14 (29.2) | 10 (32.3) | .770 |
| Smoking | |||
| Current smoker | 6 (12.5) | 1 (3.2) | <.001 |
| Exsmoker | 25 (52.1) | 1 (3.2) | |
| BMI, kg/m2 | 29.0 [25.0-32.0] | 27.0 [25.0-30.5] | .341 |
| CVD history | |||
| AF | 10 (20.8) | 1 (3.2) | .043 |
| Prior stroke | 4 (8.3) | 1 (3.2) | .643 |
| Prior AMI | 3 (6.2) | 2 (6.5) | 1.000 |
| CAD | 21 (43.8) | 10 (32.3) | .307 |
| NYHA class | |||
| I | 8 (16.7) | 0 | .063 |
| II | 27 (56.2) | 17 (54.8) | |
| III | 12 (25) | 12 (38.7) | |
| IV | 1 (2.1) | 2 (6.5) | |
| Biochemical analyses | |||
| Hb, g/dL | 14.4 [13.4-15.1] | 12.7 [12.2-13.9] | <.001 |
| eGFR, mL/min/1.73 m2 | 85.5 [66.8-99.2] | 65.0 [55.5-78.5] | .003 |
| LDL, mg/dL | 95.0 [77.5-123.0] | 116.5 [97.5-139.0] | .020 |
| BNP, pg/mL | 130.0 [62.0-265.0] | 143.0 [74.0-259.0] | 1.000 |
| sST2, ng/mL | 31.8 [22.7-39.3] | 21.6 [16.3-30.2] | .007 |
| TTE parameters | |||
| Maximum gradient, mmHg | 70.5 [63.8-84.0] | 76.0 [67.0-94.0] | .213 |
| Mean gradient, mmHg | 45.0 [41.0-53.2] | 50.0 [43.0-61.5] | .164 |
| AVA (VTI), cm2 | 0.8 [0.7-0.9] | 0.7 [0.6-0.8] | .009 |
| CMR parameters | |||
| LVEDD, mm | 50.0 [46.8-54.2] | 47.0 [43.5-49.5] | .004 |
| IVST, mm | 13.0 [12.0-15.0] | 12.0 [11.0-13.5] | .003 |
| EDV index, mL/m2 | 72.0 [61.0-82.0] | 64.0 [50.5-72.5] | .009 |
| ESV index, mL/m2 | 24.0 [16.0-37.0] | 19.0 [12.5-28.0] | .111 |
| LV mass index, g/m2 | 95.0 [85.5-102.0] | 75.0 [66.0-88.0] | <.001 |
| LVEF, % | 65.5 [55.5-73.0] | 68.0 [58.0-77.0] | .377 |
| LVEF <50% | 7 (14.6) | 3 (9.7) | .732 |
| +LGE | 30 (62.5) | 12 (38.7) | .039 |
| LGE mass, g | 1.1 [0.0-2.9] | 0.0 [0.0-1.2] | .077 |
| Time since onset, d | 140.0 [85.0-424.0] | 174.0 [95.5-185.5] | .840 |
AF, atrial fibrillation; AMI, acute myocardial infarction; AVA (VTI), Aortic valve area (continuity equation by velocity time integral); BAV, bicuspid aortic valve; BMI, body mass index; BNP, brain natriuretic peptide; CAD, coronary artery disease; CMR, cardiac magnetic resonance imaging; CVD, cardiovascular disease; DM, diabetes mellitus; eGFR, estimated glomerular filtration rate; EDV, end-diastolic volume; ESV, end-systolic volume; Hb, hemoglobin; HLP, hyperlipidaemia; HTN, hypertension; IVST, interventricular septum thickness; LDL, low density lipoprotein; LGE, late gadolinium enhancement; LV, left ventricle; LVEDD, left ventricle end-diastolic diameter; LVEF, left ventricular ejection fraction; NYHA, New York Heart Association; sST2, soluble ST2; TTE, transthoracic echocardiography; n/a, no applicable.
Data are expressed as No. (%),or median [interquartile range].
CMR parameteres revealed higher LV dilation and hypertrophy in men than in women, in association with an enhanced prevalence of the overall RMF (62.5% vs. 38.7%, P=.039). Of note, circulating levels of profibrotic sST2 were significantly higher in men than in women (31.8 [22.7-39.3] vs. 21.6 [16.3-30.2], P=.007).
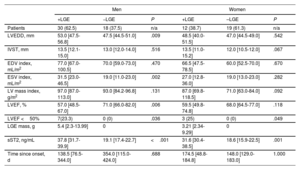
Sex-related differences were observed on comparison of the impact of RMF in LGE-positive and LGE-negative patients within each sex group (table 6). In men, RMF was associated with dilation (LV end-diastolic diameter: 53.0 [47.5-56.8] vs. 47.5 [44.5-51.0], P=.009; indexed ESV: 31.5 [23.0-46.5] vs. 19.0 [11.0-23.0], P=.002) and LV dysfunction (LVEF: 57.0 [48.5-67.0] vs. 71.0 [66.0-82.0], P=.006), with these findings not being reported in LGE-positive vs. LGE-negative women.
Sex differences analyzed by univariate comparisons within each sex group for cardiac magnetic resonance and biochemical parameters according to the presence of myocardial replacement fibrosis
| Men | Women | |||||
|---|---|---|---|---|---|---|
| +LGE | −LGE | P | +LGE | –LGE | P | |
| Patients | 30 (62.5) | 18 (37.5) | n/a | 12 (38.7) | 19 (61.3) | n/a |
| LVEDD, mm | 53.0 [47.5-56.8] | 47.5 [44.5-51.0] | .009 | 48.5 [40.0-51.5] | 47.0 [44.5-49.0] | .542 |
| IVST, mm | 13.5 [12.1-15.0] | 13.0 [12.0-14.0] | .516 | 13.5 [11.0-15.2] | 12.0 [10.5-12.0] | .067 |
| EDV index, mL/m2 | 77.0 [67.0-100.5] | 70.0 [59.0-73.0] | .470 | 66.5 [47.5-78.5] | 60.0 [52.5-70.0] | .670 |
| ESV index, mL/m2 | 31.5 [23.0-46.5] | 19.0 [11.0-23.0] | .002 | 27.0 [12.8-36.0] | 19.0 [13.0-23.0] | .282 |
| LV mass index, g/m2 | 97.0 [87.0-113.0] | 93.0 [84.2-96.8] | .131 | 87.0 [69.8-118.5] | 71.0 [63.0-84.0] | .092 |
| LVEF, % | 57.0 [48.5-67.0] | 71.0 [66.0-82.0] | .006 | 59.5 [49.8-74.8] | 68.0 [64.5-77.0] | .118 |
| LVEF <50% | 7(23.3) | 0 (0) | .036 | 3 (25) | 0 (0) | .049 |
| LGE mass, g | 5.4 [2.3-13.99] | 0 | 3.21 [2.34-9.29] | 0 | ||
| sST2, ng/mL | 37.8 [31.7-39.9] | 19.1 [17.4-22.7] | <.001 | 31.6 [30.4-38.5] | 18.6 [15.9-22.5] | .001 |
| Time since onset, d | 138.5 [76.5-344.0] | 354.0 [115.0-424.0] | .688 | 174.5 [48.8-184.8] | 148.0 [129.0-183.0] | 1.000 |
EDV, end-diastolic volume; ESV, end-systolic volume; IVST, interventricular septum thickness; LGE, late gadolinium enhancement; LV, left ventricle; LVEDD, left ventricle end-diastolic diameter; LVEF, left ventricular ejection fraction; sST2, soluble ST2; n/a, no applicable.
Data are expressed as No. (%) or median [interquartile range].
RMF was associated with high levels of sST2 regardless of sex (table 6). However, sST2 was correlated with LGE mass (r=0.6604, P <.001) (figure 2I) only in me.
DISCUSSIONIn this study, sST2 levels were associated with RMF measured by CMR in AS patients. sST2 ≥ 28.2 ng/mL might help to stratify or identify patients with RMF, LV hypertrophy and more likely to experience LV dysfunction despite having similar degree of AS than those with sST2 <28.2 ng/mL. Importantly, sST2 was an independent factor for RMF with fibrosis being increased by 0.17 units per 1 ng/mL sST2. Overall, our results reinforce the idea that sST2 might be a useful marker for RMF and, by extension, LGE LV mass in AS patients. Finally, we show that for a similar AS severity, men exhibited higher RMF and sST2 levels than women.
sST2 expression is induced by mechanical strain in cardiomyocytes.24 Moreover, sST2 levels are enhanced in AVs from patients with AS compared with those with aortic regurgitation.25 Additionally, circulating sST2 levels increase in response to pressure overload in AS patients.11 Levels of sST2> 29.0ng/mL were independently associated with adverse outcome after transcatheter AV implantation and could be used to estimate cumulative 1-year mortality.16 Similarly, our sST2 cutoff value ≥ 28.2 ng/mL allows identification of patients with RMF, a well-known independent predictor of mortality in AS patients.6 RMF is an important driver of AS.26 Importantly, for the same degree of AS, sST2 was associated with the LV hypertrophy burden, being strongly associated with RMF. This is consistent with previous studies reporting an association between an advanced hypertrophic response and RMF.27
We cannot exclude the possibility that other parameters may influence the degree and type of myocardial fibrosis and further studies in larger cohorts will be required. Although CAD might be a major cause of subendocardial fibrosis, it seems not to be exclusive. Indeed, multivariate analyses in patients with preserved LVEF revealed that only LVEF and sST2 levels were the independent factors for RMF likely leading to the structural and functional abnormalities found in advanced AS, regardless of the concomitant CAD or prior MI. Additional bootstrapping analyses further confirmed the robustness of our model. Moreover, we did not find any age differences among LGE-positive and -negative patients, which rules out higher age-related deterioration as a cause of the LV RMF.
Female sex has often been overlooked and a growing number of publications demonstrate the clinical need to identify biomarkers and therapeutic targets. Our data are in accordance with other studies showing that men exhibit more RMF than women for a similar severity of AS.8,28 Accordingly, men exhibited higher sST2 levels. Conversely, in a recent publication, men had a lower degree of diffuse fibrosis and RMF than women across the whole range of AS severity.9 These discrepancies could be due to the inclusion criteria of AS patients. Whereas previous studies and ours mainly included severe AS patients, the study by Tastet et al.9 also included mild (34% men, 46% women), moderate (30% men, 24% women) and severe (36% men, 30% women) AS patients. We might speculate that RMF may substantially impair the anatomy and function of the LV only in men with AS. However, we cannot ignore the impact of our small sample size. Further studies will be required to shed light on the possible sex-dependent clinical impact of RMF in AS. In line with our findings describing higher sST2 levels in men, sex has been proposed to be an important determinant of sST2 levels.29 Indeed, sST2 levels are higher in men than in age-matched women. Although the underlying mechanisms are not known, the Framingham Heart Study showed that sST2 levels may be influenced by estrogens.29 International organizations such as the National Institutes of Health strongly recommend including sex as a biological variable. Although preliminary, our data suggest potential sex differences in the expression of sST2 and RMF and might critically encourage meaningful research on the development of sex-tailored prognostic and diagnostic tools.
Elective valve replacement in patients with severe AS is recommended upon the onset of symptoms or LV dysfunction (LVEF <50%). Of note, the latter is generally acknowledged a marker of poor prognosis.30 Implementing RMF assessment in severe AS patients with LVEF> 50% may help to identify a group of patients with worsened LV remodeling preceding the presence of LV dysfunction. Indeed, sST2 ≥ 28.2 ng/mL was only found in LGE-positive patients. Interestingly, multivariate linear regression analyses, with or without prior data transformation, revealed that sST2 was an independent factor for RMF in patients with AS and preserved LVEF, no matter the presence of concomitant ischemic cardiac diseases. Importantly, RMF was increased by 0.17 units per 1 ng/mL sST2.
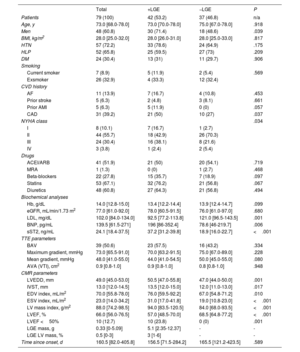
The management of asymptomatic patients with severe AS is particularly challenging. The true prevalence of asymptomatic severe AS is unclear, and a significant proportion of patients remain undiagnosed until late stages when the long-term benefits of valve replacement are ambiguous. Asymptomatic patients with preserved LVEF likely undergoing LV dysfunction could be easily followed up by quantifying circulating levels of sST2. Moreover, patients with isolated AS not suitable for CMR imaging (eg, contraindications to CMR, including claustrophobia, pacemaker and defibrillator implantation and an estimate glomerular filtration rate of <30mL/min) could benefit from sST2 quantification. As graphically illustrated in figure 3, asymptomatic patients with severe AS, LVEF> 50% and RMF could benefit from early valve replacement, which might be possible by CMR imaging or by analyzing the circulating levels of sST2 during follow-up visits.31
 whose LV dilation and hypertrophy is more advanced than in asymptomatic severe AS with no fibrosis. Patients with asymptomatic severe AS, RMF and sST2 ≥ 28.2 ng/mL might benefit from early AV replacement interventions. Created with Biorender.com. AS, aortic stenosis; CMR, cardiac magnetic resonance; LGE, late gadolinium enhancement; LV, left ventricle; LVEF, left ventricular ejection fraction; RMF, replacement myocardial fibrosis; sST2, soluble ST2.")
Central illustration. A simple sST2 quantification in serum samples may help to identify/stratify RMF patients with asymptomatic severe AS (sST2 ≥ 28.2 ng/mL) whose LV dilation and hypertrophy is more advanced than in asymptomatic severe AS with no fibrosis. Patients with asymptomatic severe AS, RMF and sST2 ≥ 28.2 ng/mL might benefit from early AV replacement interventions. Created with Biorender.com. AS, aortic stenosis; CMR, cardiac magnetic resonance; LGE, late gadolinium enhancement; LV, left ventricle; LVEF, left ventricular ejection fraction; RMF, replacement myocardial fibrosis; sST2, soluble ST2.
This study has some limitations. First, we cannot gather enough evidence on causal associations due to the inherent limitations of the cross-sectional experimental design of our study. Second, based on previous publications, we confirm that the apparently small sample size of our study is adequate and has a power over 90%. However, it is indeed a limitation to studying the sex-dependent expression of sST2 and its association with CMR parameters and RMF. Third, our cohort represents a real-life population of consecutive patients with severe isolated AS. Nevertheless, a selection bias is highly likely due to our exclusion criteria. For example, excluding AV regurgitation or moderate-to-severe concomitant mitral valve disease, both of which are highly prevalent in degenerative AS, might have increased the percentage of patients with bicuspid AV. Other exclusion criteria such as CMR contraindication might not significantly interfere with the external validity of our results, as in the clinic these patients would not undergo RMF quantification by CMR. In contrast, patients with isolated AS and a contraindication to CMR could clearly benefit from the assessment of circulating sST2. Finally, although we statistically confirmed the adequate sample size and the internal validity of our model, we cannot exclude the possibility that some exclusion criteria may have influenced the unusual prevalence of bicuspid AV in our cohort and may pose a threat to the external validity of our results. Replication studies in larger series will be required to assess sex differences, to validate the causality of the associations reported here, and to circunvent the effect of the high bicuspid AV numbers in our cohort.
CONCLUSIONSOur data provide evidence that sST2 is elevated in patients with RMF and is an independent factor for RMF in patients with preserved LVEF, regardless of concomitant ischemic heart disease. sST2 ≥ 28.2 ng/mL was associated with RMF, and with greater LV hypertrophy. Accordingly, circulating levels of sST2 above 28.2 ng/mL could help to identify patients with RMF. Our findings might be a useful clinical tool. Further studies assessing the agreement and reliability of circulating sST2 with RMF will be needed. Additional studies including sex-related and prospective studies will be required.
FUNDINGThis work was supported by: Miguel Servet contract CP13/00221 from the Instituto de Salud Carlos III-FEDER, Fondo de Investigaciones Sanitarias [PI18/01875; PI21/00280; G°Na01/21]. L. Matilla has a PFIS (FI19/00302) PhD studentship, E. Jover (CD19/00251) has a Sara Borrell postdoctoral fellowship, E. Martín-Núñez has a Margarita Salas postdoctoral fellowship (ULL-MS-P14), and M. Garaikoetxea has a Miguel Servet Foundation PhD studentship.
AUTHORS’ CONTRIBUTIONSV. Arrieta and E. Jover contributed equally to this article. Conceptualization, N. López-Andrés; methodology, V. Arrieta, A. Navarro, V. Álvarez, A. García-Peña, A. Gainza, A. Fernández-Celis, and R. Sádaba; formal analysis and data curation, V. Arrieta, A. Navarro, V. Álvarez, A. García-Peña, A. Gainza, A. Fernández-Celis, E. Jover, N. López-Andrés, and R. Sádaba; investigation, V. Arrieta, M. Garaikoetxea, E. Martín-Núñez, A. Navarro, L. Matilla, E. Jover, N. López-Andrés, A. Gainza; writing original draft, V. Arrieta, E. Jover, N. López-Andrés; writing, review and editing, V. Arrieta, E. Jover, A. García-Peña, R. Sádaba, V. Álvarez, A. Navarro, N. López-Andrés; visualization, V. Arrieta, E. Jover; supervision, N. López-Andrés; project administration, N. López-Andrés; funding acquisition, N. López-Andrés.
CONFLICTS OF INTERESTNone.
- •
RMF is associated with LV remodeling and poor outcomes in AS.
- •
CMR with LGE analyses is a well-established noninvasive method to quantify RMF.
- •
Sex-related differences underlie the pathogenesis and phenotypes of AS.
- •
The fibrotic marker sST2 is associated with symptom onset, namely HF, and outcomes in AS.
- •
As per positive LGE, serum sST2> 28.2 cutoff predicts RMF and LV remodeling.
- •
Higher sST2 is observed in patients with RMF, namely with midwall fibrosis and higher LV hypertrophy.
- •
In patients with preserved LVEF (> 50%), sST2 is an independent factor for RMF regardless of the presence of concomitant ischemic heart disease.
- •
Both RMF demonstrated by positive LGE and sST2 levels are higher in men than in women, but is associated with LV hypertrophy and dysfunction only in men.