Risk stratification in patients with non—ST-elevation acute coronary syndrome (NSTEACS) is a priority once a provisional diagnosis is made, as it provides information on prognosis and has important implications for treatment.
The most recent guidelines on NSTEACS1 of the European Society of Cardiology propose a new risk stratification that divides patients into 3 groups: low-, high-, and very high-risk. It removes the intermediate risk group that was proposed in the previous 2015 guidelines,2 which included patients with a GRACE score between 109 and 140, essentially patients with diabetes or kidney disease with uncomplicated NSTEACS.
Indeed, the recent 2020 NSTEACS guidelines,1 in the section “gaps in evidence”, recognize that more evidence is needed on this new, broad group of low-risk patients and recommends that the diagnostic and therapeutic strategy (particularly invasive treatment) should be individualized.
We hypothesized that among patients with NSTEACS it would be possible to identify a group with intermediate risk following the recommendations in the 2015 guidelines2 on risk stratification, and that the risk-stratification method using 4 groups is more appropriate than the 3 groups suggested in the new 2020 guidelines, as the subgroup with intermediate risk would have a different prognosis than the subgroup currently considered at low risk.
We studied a prospective cohort of 7597 patients with a diagnosis of NSTEACS who were hospitalized in 2 cardiology departments between 2003 and 2017 with a mean follow-up of 4.4±2.7 years. The diagnosis, risk stratification, treatment, and follow-up were managed by trained cardiologists and cardiology residents. We then retrospectively assigned events based on analysis of the multilevel integrated clinical records for both hospitals. Patients were then classified into the 4 risk groups proposed in the 2015 guidelines,2 and events during follow-up were assigned to the following categories: a) first major adverse cardiac event (MACE), a composite of all-cause mortality, myocardial infarction, hospitalization for heart failure, and unplanned revascularization; b) all-cause mortality; and c) cardiovascular mortality. The ethics committee of the hospital approved and coordinated the study protocol, including obtaining valid informed consent from all patients at the time of their inclusion in the registry.
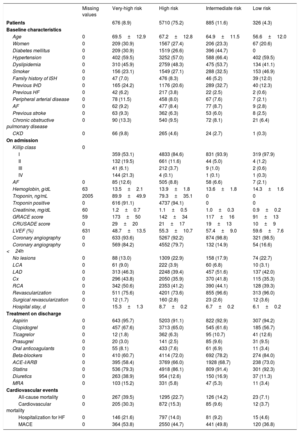
Table 1 contains the main clinical characteristics of the patients stratified into the 4 risk groups. A cohort of 7507 patients was analyzed (overall mean age, 66.6±12.8 years), of whom 2049 (27.0%) were women. As expected, this stratification identified groups of patients with statistically significant differences for all clinical variables.
Characteristics at baseline, during hospital stay, and on discharge, by risk group
| Missing values | Very-high risk | High risk | Intermediate risk | Low risk | |
|---|---|---|---|---|---|
| Patients | 676 (8.9) | 5710 (75.2) | 885 (11.6) | 326 (4.3) | |
| Baseline characteristics | |||||
| Age | 0 | 69.5±12.9 | 67.2±12.8 | 64.9±11.5 | 56.6±12.0 |
| Women | 0 | 209 (30.9) | 1567 (27.4) | 206 (23.3) | 67 (20.6) |
| Diabetes mellitus | 0 | 209 (30.9) | 1519 (26.6) | 396 (44.7) | 0 |
| Hypertension | 0 | 402 (59.5) | 3252 (57.0) | 588 (66.4) | 402 (59.5) |
| Dyslipidemia | 0 | 310 (45.9) | 2759 (48.3) | 475 (53.7) | 134 (41.1) |
| Smoker | 0 | 156 (23.1) | 1549 (27.1) | 288 (32.5) | 153 (46.9) |
| Family history of ISH | 0 | 47 (7.0) | 476 (8.3) | 46 (5.2) | 39 (12.0) |
| Previous IHD | 0 | 165 (24.2) | 1176 (20.6) | 289 (32.7) | 40 (12.3) |
| Previous HF | 0 | 42 (6.2) | 217 (3.8) | 22 (2.5) | 2 (0.6) |
| Peripheral arterial disease | 0 | 78 (11.5) | 458 (8.0) | 67 (7.6) | 7 (2.1) |
| AF | 0 | 62 (9.2) | 477 (8.4) | 77 (8.7) | 9 (2.8) |
| Previous stroke | 0 | 63 (9.3) | 362 (6.3) | 53 (6.0) | 8 (2.5) |
| Chronic obstructive pulmonary disease | 0 | 90 (13.3) | 540 (9.5) | 72 (8.1) | 21 (6.4) |
| CKD | 0 | 66 (9.8) | 265 (4.6) | 24 (2.7) | 1 (0.3) |
| On admission | |||||
| Killip class | 0 | ||||
| I | 359 (53.1) | 4833 (84.6) | 831 (93.9) | 319 (97.9) | |
| II | 132 (19.5) | 661 (11.6) | 44 (5.0) | 4 (1.2) | |
| III | 41 (6.1) | 212 (3.7) | 9 (1.0) | 2 (0.6) | |
| IV | 144 (21.3) | 4 (0.1) | 1 (0.1) | 1 (0.3) | |
| AF | 0 | 85 (12.6) | 505 (8.8) | 58 (6.6) | 7 (2.1) |
| Hemoglobin, g/dL | 63 | 13.5±2.1 | 13.9±1.8 | 13.6±1.8 | 14.3±1.6 |
| Troponin, ng/mL | 2005 | 89.9±49.9 | 79.3±35.1 | 0 | 0 |
| Troponin positive | 0 | 616 (91.1) | 4737 (94.1) | 0 | 0 |
| Creatinine, mg/dL | 60 | 1.2±0.7 | 1.1±0.5 | 1.0±0.3 | 0.9±0.2 |
| GRACE score | 59 | 173±50 | 142±34 | 117±16 | 91±13 |
| CRUSADE score | 0 | 29±20 | 21±17 | 19±13 | 10±9 |
| LVEF (%) | 631 | 48.7±13.5 | 55.3±10.7 | 57.4±9.0 | 59.6±7.6 |
| Coronary angiography | 0 | 633 (93.6) | 5267 (92.2) | 874 (98.8) | 321 (98.5) |
| Coronary angiography <24h | 0 | 569 (84.2) | 4552 (79.7) | 132 (14.9) | 54 (16.6) |
| No lesions | 0 | 88 (13.0) | 1309 (22.9) | 158 (17.9) | 74 (22.7) |
| LCA | 0 | 61 (9.0) | 222 (3.9) | 60 (6.8) | 10 (3.1) |
| LAD | 0 | 313 (46.3) | 2248 (39.4) | 457 (51.6) | 137 (42.0) |
| Cx | 0 | 296 (43.8) | 2050 (35.9) | 370 (41.8) | 115 (35.3) |
| RCA | 0 | 342 (50.6) | 2353 (41.2) | 390 (44.1) | 128 (39.3) |
| Revascularization | 0 | 511 (75.6) | 4201 (73.6) | 855 (96.6) | 313 (96.0) |
| Surgical revascularization | 0 | 12 (1.7) | 160 (2.8) | 23 (2.6) | 12 (3.6) |
| Hospital stay, d | 0 | 15.3±1.3 | 8.7±0.2 | 6.7±0.2 | 6.1±0.2 |
| Treatment on discharge | |||||
| Aspirin | 0 | 643 (95.7) | 5203 (91.1) | 822 (92.9) | 307 (94.2) |
| Clopidogrel | 0 | 457 (67.6) | 3713 (65.0) | 545 (61.6) | 185 (56.7) |
| Ticagrelor | 0 | 12 (1.8) | 362 (6.3) | 95 (10.7) | 41 (12.6) |
| Prasugrel | 0 | 20 (3.0) | 141 (2.5) | 85 (9.6) | 31 (9.5) |
| Oral anticoagulants | 0 | 55 (8.1) | 433 (7.6) | 61 (6.9) | 11 (3.4) |
| Beta-blockers | 0 | 410 (60.7) | 4114 (72.0) | 692 (78.2) | 274 (84.0) |
| ACE-I/ARB | 0 | 395 (58.4) | 3769 (66.0) | 1928 (68.7) | 238 (73.0) |
| Statins | 0 | 536 (79.3) | 4918 (86.1) | 809 (91.4) | 301 (92.3) |
| Diuretics | 0 | 263 (38.9) | 954 (12.6) | 150 (16.9) | 37 (11.3) |
| MRA | 0 | 103 (15.2) | 331 (5.8) | 47 (5.3) | 11 (3.4) |
| Cardiovascular events | |||||
| All-cause mortality | 0 | 267 (39.5) | 1295 (22.7) | 126 (14.2) | 23 (7.1) |
| Cardiovascular mortality | 0 | 205 (30.3) | 872 (15.3) | 85 (9.6) | 12 (3.7) |
| Hospitalization for HF | 0 | 146 (21.6) | 797 (14.0) | 81 (9.2) | 15 (4.6) |
| MACE | 0 | 364 (53.8) | 2550 (44.7) | 441 (49.8) | 120 (36.8) |
ACE-I, angiotensin converting enzyme inhibitor; AF, atrial fibrillation; ARB: angiotensin II receptor blockers; Cx, circumflex artery; HF, heart failure; IHD, ischemic heart disease; LAD, left anterior descending artery; LCA, left coronary artery LVEF, left ventricular ejection fraction; MACE, major adverse cardiac events; MRA, mineralocorticoid receptor antagonists; RCA, right coronary artery.
Values are expressed as No. (%) or mean±standard deviation.
A progressive increase in GRACE score was observed between the 4 risk groups, with the “intermediate” group falling between the low-risk and high-risk groups. During the hospital stay, an invasive approach was used in most of the patients in all 4 risk categories.
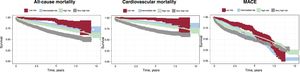
Stratified analysis showed that the intermediate-risk group of patients had a different long-term prognosis from the high- and low-risk groups for the different events analyzed, with the following results:
- •
The total mortality rate in deaths/100 person-years was, in the low-risk group, 1.96 (95% confidence interval [95%CI], 1.30-2.95); in the intermediate-risk group, 3.91 (95%CI, 3.28-4.57); in the high-risk group, 4.94 (95%CI, 4.87-5.21); and in the very high-risk group, 8.74 (95%CI, 7.75-9.85).
- •
The cardiovascular mortality rate in the low-, intermediate-, high-, and very high-risk group was 1.02 (95%CI, 0.58-1.18), 2.64 (95%CI, 2.13-3.26), 3.32 (95%CI, 3.11-3.55), and 6.71 (95%CI, 4.84-7.69), respectively.
- •
The MACE incidence rate in the low-, intermediate-, high-, and very high-risk group was 10.22 (95%CI, 8.54-12.22), 13.68 (95%CI, 12.46-15.02), 9.71 (95%CI, 9.35-10.10), and 11.90 (95%CI, 10.75-13.20).
Figure 1 shows the Kaplan-Meier curves, in which there are differences among the 4 risk groups over time until death from all causes, cardiovascular death, and first MACE, especially during the first years of follow-up.

Using Cox proportional risk models, we evaluated for the low-, high-, and very high-risk groups (using the intermediate risk group as reference) the mortality and cardiovascular events, and after adjusting for medical treatment at discharge (aspirin, angiotensin converting-enzyme inhibitors/angiotensin II receptor blockers, beta-blockers, mineralocorticoid receptor antagonists, and statins), invasive approach, and revascularization, the intermediate risk group continued to show a risk that differed from the high- and low-risk groups, which remained statistically significant. The results showed that:
- •
The low-, high-, and very high-risk groups were significantly different from the intermediate-risk group: hazard ratio (HR), 0.52 (95%CI, 0.33-0.81) and HR, 1.05 (95%CI, 0.87-1.27) vs HR, 1.72 (95%CI, 1.38-2.13).
- •
For all-cause mortality: HR, 0.40 (95%CI, 0.22-0.73), HR, 1.02 (95%CI, 0.81-1.28), and HR, 1.90; 95%CI, 1.46-2.46.
- •
For MACE: HR, 0.74 (95%CI, 0.60-0.91), HR, 0.72 (95%CI, 0.65-0.80), and HR, 0.91 (95%CI, 0.79-1.05).
These findings indicate that the proposed 4-group stratification model could better identify different risk categories in patients with NSTEACS and raises doubts about the suitability of the new risk-classification model in the most recent European guidelines, in particular the removal of the intermediate-risk group that would be characterized as part of the low-risk group.
The retrospective nature of our analysis is a potential weakness, in addition to the limitations inherent to an observational register. The results could have been affected by many circumstances that may not have been available or monitored in the follow-up protocol.
Our findings indicate that, for patients hospitalized with NSTEACS, the intermediate-risk group proposed in the 2015 European guidelines constitutes a well-defined and statistically different risk category from the low- and high-risk groups at long-term follow-up.
FUNDINGThis study did not receive funding.
AUTHORS’ CONTRIBUTIONSB. Álvarez-Álvarez, T. González Ferrero, M. Trincado Ave, A. Cordero and J.R. González-Juanatey accept responsibility for all aspects of data reliability and lack of bias and the discussed interpretation. F. Gude Sampedro participated in the design, methods, and statistical analysis, writing up of results and their discussion.
CONFLICTS OF INTERESTNo conflicts of interest.