The left atrium is clinically relevant in patients with mitral valve stenosis. The objective of this study was to analyze the effects of percutaneous balloon valvuloplasty on left atrium volumes and the left atrium emptying fraction in symptomatic mitral valve stenosis patients using 2-dimensional and real-time 3-dimensional transthoracic echocardiography.
MethodsWe carried out a prospective study of 28 consecutive symptomatic mitral valve stenosis patients, aged 22-72 (39 [11.5]) years, 24/28 (85.6%) women, who underwent to percutaneous balloon valvuloplasty between March 2009 and May 2011. Patients underwent 2- and 3-dimensional transthoracic and transesophageal echocardiography (atrial fibrillation) and invasive mitral valve area measurement. Echocardiographic analysis was performed before, 72h after and 12 months after percutaneous balloon valvuloplasty. The following parameters were analyzed: a) mitral valve area (2-dimensional planimetry, pressure half-time, 3-dimensional echocardiography, invasive hemodynamic measurement); b) indexed left atrium maximum and indexed minimum volumes, and c) left atrium emptying fraction.
ResultsThe 3-dimensional parameters of the mitral valve stenosis patients before and 72h and 12 months after percutaneous balloon valvuloplasty were as follows: a) mitral valve area: 0.9 (0.1) cm2; 1.8 (0.2) cm2 (P<.001); 1.7 (0.2) cm2 (P<.001); b) left atrium maximum volumes: 49.9 (12) mL/m2; 42 (11.4) mL/m2 (P<.001); 40.3 (10.2) mL/m2 (P<.001), and c) left atrium emptying fraction: 30.1 (9.4%); 40.6 (7.4%) (P<.001); 44.1 (8%) (P<.001), respectively.
ConclusionsIn symptomatic mitral valve stenosis patients who underwent percutaneous balloon valvuloplasty analysis by 2- and 3-dimensional echocardiography, improvements in left atrium reverse remodeling and left atrium emptying fraction were observed 72h and 12 months after the procedure.
Keywords
Mitral valve stenosis (MVS) continues to be a prominent cause of heart disease in countries with rapidly growing economies,1 accounting for up to 40% of the valvulopathies in the less developed regions of the world.2 Left atrium (LA) enlargement usually occurs during follow-up and is associated with higher rates of cerebrovascular events and higher mortality,3 as demonstrated in the Framingham study.4
Unlike 2-dimensional (2D) echocardiography, 3-dimensional (3D) echocardiographic LA evaluation allows for the use of multiangular, multiplane, rotational real-time analysis without the use of mathematical extrapolations or correction factors.5–10 Previous investigations have demonstrated the use of real time 3D transthoracic echocardiography (RT3DE) for LA analysis in different clinical scenarios.5–10 This procedure employs a sparse array matrix transducer with a number of elements activated nonsimultaneously to generate a 60×60° pyramidal volume, which is acquired from a complex of 2-4 heart beats. However, there is a lack of information concerning LA RT3DE analysis in MVS patients undergoing percutaneous balloon valvuloplasty (PBV).
To investigate the possible use of LA RT3DE analysis in the treatment of MVS patients, we sought to study LA changes and reverse remodeling in MVS patients undergoing PBV using 2- and 3D echocardiography performed 72h and 12 months after the procedure.
The aim of this study was to use 2- and 3D echocardiography to study the effects of PBV in patients with MVS, with respect to changes in LA volumes as well as the LA-emptying fraction (LAEF).
MethodsPatientsBetween March 2009 and May 2011, we carried out a prospective study involving 38 consecutive symptomatic MVS patients (New York Heart Association [NYHA] functional class III-IV) who were clinically recommended for percutaneous treatment and underwent mitral valve PBV at the Heart Institute (InCor), Sao Paulo University Medical School, Sao Paulo, Brazil. The inclusion criteria for the study were based on clinical indications for MVS percutaneous treatment. Twenty-four hours before the PBV procedure, the patients were clinically evaluated with 2D transthoracic echocardiography and 2D transesophageal study (for patients with atrial fibrillation [AF]) and RT3DE study. Ten patients were excluded from the initial population due to the following factors: discrete mitral valve area (mitral valve area >1.5cm2) determined during the procedure (2 patients); cardiac tamponade occurring during the procedure (2 patients); substantial aortic regurgitation with indications for surgical correction (1 patient); Wilkins’ echocardiographic score>12 (1 patient); and imaging of the left appendage thrombus during the transesophageal investigation (1 patient). Finally, 3 patients were excluded because PBV was unsuccessful. Therefore, the final clinical population of the study consisted of 28 patients, aged 22-72 years (39 [11.5]), of whom 24/28 (85.6%) were women; 22/28 (78.5%) of these patients were in sinus rhythm, and 6/28 (21.4%) had AF. The indications for mitral PBV followed previously published criteria.11,12 The research protocol was approved by the institution's ethics committee. Informed consent was obtained from the patients.
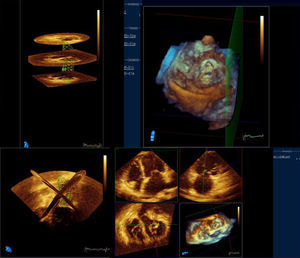
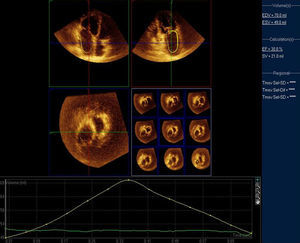
EchocardiographyMVS patients underwent a pre-PBV comprehensive 2D and Doppler echocardiographic study performed according to the American Society of Echocardiography guidelines,13 followed by RT3DE examination performed by 2 independent observers (Figs. 1 and 2). MVS patients underwent echocardiographic analysis on 3 different occasions: pre-PBV, 72h after the procedure and 12 months after the procedure. MVS patients with AF pre-PBV also underwent 2D transesophageal study. The following parameters were determined through 2D and Doppler echocardiography: LA anteroposterior diameter; indexed LA maximal volume (Simpson's biplane modified method); indexed minimal volume; emptying fraction, the difference between indexed maximal volume and the indexed minimum volume divided by the indexed maximum volume; left ventricular diastolic volume; left ventricular systolic volume; left ventricular (Simpson's rule) ejection fraction; mitral valve area (planimetry); mitral valve area (pressure half-time); transmitral valve gradient (maximum); transmitral valve gradient (medium); pulmonary systolic pressure.

 and minimum (49mL) volumes and emptying fraction (30%) analysis in a mitral valve stenosis patient.")
RT3DE LA parameters were calculated: indexed maximal volume; indexed minimum volume; emptying fraction; indexed LA volume before atrial contraction (patients with sinus rhythm), as previously described.14
Each 2- and 3D echocardiographic parameter was analyzed 3 times in subjects with sinus rhythm and 10 times in AF subjects; the means were considered. A commercially available machine (IE33, Philips Medical Systems, Andover, Massachusetts, United States) with digital storage-dedicated volumetric analysis software (QLab-Philips version 6.0) was used for offline measurement.
LA reverse remodeling after PBV was considered to have occurred when the maximum indexed LA volume decreased by >15%, as previously described for LA analysis after mitral valve surgical repair.15
Percutaneous Balloon ValvuloplastyMVS patients underwent PBV, which was performed by 2 investigators. Mitral valve area was calculated using the Gorlin equation. Balloon dilation of the mitral valve was performed using a single balloon dilating technique. The invasive hemodynamic measurements performed were as follows: a) mitral valve area, and b) LA/left ventricle gradient.
Statistical AnalysisContinuous variables are described as the mean values (standard deviations), P<.05. Pearson's correlation method (r) was employed (95% confidence interval) for correlation analysis. Analysis of variance was used to compare the LA volumes and LAEFs of MVS patients before and 72h and 12 months after PBV. The Bonferroni test was used for post-hoc analysis. For comparisons between methods, the Bland and Altman test was used. Intra- and interobserver concordance coefficients were determined for RT3DE LA volumes and LAEFs in 18 MVS patients. The data were processed using dedicated software (MedCalc., Mariakerke, Belgium).
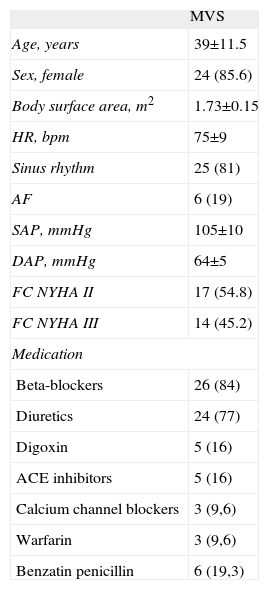
ResultsClinical DataDemographic data for the MVS patients are presented in Table 1. In the MVS group, 6 patients presented with AF before PBV and 3 patients were in AF 72h after and 12 months after PBV. Patients with MVS were taking the appropriate medication before PBV.
Demographic and Clinical Data for Mitral Valve Stenosis Patients.
| MVS | |
| Age, years | 39±11.5 |
| Sex, female | 24 (85.6) |
| Body surface area, m2 | 1.73±0.15 |
| HR, bpm | 75±9 |
| Sinus rhythm | 25 (81) |
| AF | 6 (19) |
| SAP, mmHg | 105±10 |
| DAP, mmHg | 64±5 |
| FC NYHA II | 17 (54.8) |
| FC NYHA III | 14 (45.2) |
| Medication | |
| Beta-blockers | 26 (84) |
| Diuretics | 24 (77) |
| Digoxin | 5 (16) |
| ACE inhibitors | 5 (16) |
| Calcium channel blockers | 3 (9,6) |
| Warfarin | 3 (9,6) |
| Benzatin penicillin | 6 (19,3) |
ACE, angiotensin-converting enzyme; AF, atrial fibrillation; DAP, diastolic arterial pressure; FC NYHA, functional class according to the New York Heart association; HR, heart rate; MVS, mitral valve stenosis patients; SAP, systolic arterial pressure.
Data are expressed as mean±standard deviation or no. (%).
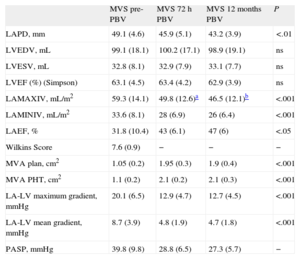
Data derived from 2D and Doppler echocardiography in 28 patients (3 patients were excluded due to unsuccessful PBV) are presented in Table 2. A decrease in LA anteroposterior diameter was observed after 12 months of PBV; progressive decreases in the LA maximum and minimum indexed volumes and a progressive increase in LAEF were observed 72h and 12 months after PBV. The LA maximum indexed volume decreased at 72h (Δ: 16%) and 12 months (Δ: 21.5%, compared to pre-PBV). Twenty-six (92.8%) patients showed 2D LA reverse remodeling 72h after the procedure. In MVS patients with AF, the LA 2D maximum indexed volume was 69.2 (7.1) mL/m2, and the LAEF was 27.4 (5.2%).
Two-dimensional and Doppler Echocardiographic Data From Mitral Valve Stenosis Patients Before and 72 h and 12 Months After Percutaneous Balloon Valvuloplasty.
| MVS pre-PBV | MVS 72h PBV | MVS 12 months PBV | P | |
| LAPD, mm | 49.1 (4.6) | 45.9 (5.1) | 43.2 (3.9) | <.01 |
| LVEDV, mL | 99.1 (18.1) | 100.2 (17.1) | 98.9 (19.1) | ns |
| LVESV, mL | 32.8 (8.1) | 32.9 (7.9) | 33.1 (7.7) | ns |
| LVEF (%) (Simpson) | 63.1 (4.5) | 63.4 (4.2) | 62.9 (3.9) | ns |
| LAMAXIV, mL/m2 | 59.3 (14.1) | 49.8 (12.6)a | 46.5 (12.1)b | <.001 |
| LAMINIV, mL/m2 | 33.6 (8.1) | 28 (6.9) | 26 (6.4) | <.001 |
| LAEF, % | 31.8 (10.4) | 43 (6.1) | 47 (6) | <.05 |
| Wilkins Score | 7.6 (0.9) | − | − | − |
| MVA plan, cm2 | 1.05 (0.2) | 1.95 (0.3) | 1.9 (0.4) | <.001 |
| MVA PHT, cm2 | 1.1 (0.2) | 2.1 (0.2) | 2.1 (0.3) | <.001 |
| LA-LV maximum gradient, mmHg | 20.1 (6.5) | 12.9 (4.7) | 12.7 (4.5) | <.001 |
| LA-LV mean gradient, mmHg | 8.7 (3.9) | 4.8 (1.9) | 4.7 (1.8) | <.001 |
| PASP, mmHg | 39.8 (9.8) | 28.8 (6.5) | 27.3 (5.7) | − |
LAEF, left atrium emptying fraction; LA, left atrium; LV, left ventricle; LAMAXIV, left atrium maximum indexed volume; LAMINIV, left atrium minimum indexed volume; LAPD, left atrium anteroposterior diameter; LVEDV, left ventricle end diastolic volume; LVEF, left ventricle ejection fraction; LVESV, left ventricular end-systolic volume; MVA PHT, mitral valve area measured using the pressure half-time method; MVA plan, mitral valve area measured using planimetry; MVS, mitral valve stenosis patients; ns, not significant; PASP, pulmonary systolic pressure; pre-PBV, pre-percutaneous balloon valvuloplasty; PBV, percutaneous balloon valvuloplasty.
The values are shown as the means (standard deviations), analysis of variance.
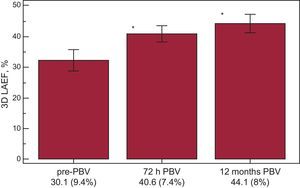
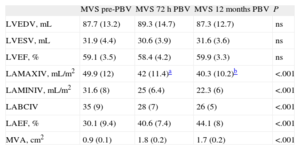
The data derived from RT3DE are presented in Table 3. All 28 patients (3 patients were excluded due to unsuccessful PBV) included in the study provided high-quality LA images for RT3DE. Similar to what we observed in the 2D analysis, the LA maximum and minimum indexed volumes exhibited progressive, time-dependent decreases. The decrease in LA maximum 3D indexed volumes was 15.8% (P<.001 compared to the pre-PBV value) at 72h and was 19.2% at 12 months (P<.0001 compared to pre-PBV). Twenty-six (92.8%) patients showed 3D LA reverse remodeling 72h after the procedure There was also a time-dependent increase in the 3D LAEF (Fig. 3). In the subgroup of MVS patients with AF, the LA 3D maximum indexed volume was 58.5 (5.3) mL/m2, and the 3D LAEF was 28.1 (4.1%).
Three-dimensional Echocardiographic Data From Mitral Valve Stenosis Patients Before and 72 h and 12 Months After Percutaneous Balloon Valvuloplasty.
| MVS pre-PBV | MVS 72h PBV | MVS 12 months PBV | P | |
| LVEDV, mL | 87.7 (13.2) | 89.3 (14.7) | 87.3 (12.7) | ns |
| LVESV, mL | 31.9 (4.4) | 30.6 (3.9) | 31.6 (3.6) | ns |
| LVEF, % | 59.1 (3.5) | 58.4 (4.2) | 59.9 (3.3) | ns |
| LAMAXIV, mL/m2 | 49.9 (12) | 42 (11.4)a | 40.3 (10.2)b | <.001 |
| LAMINIV, mL/m2 | 31.6 (8) | 25 (6.4) | 22.3 (6) | <.001 |
| LABCIV | 35 (9) | 28 (7) | 26 (5) | <.001 |
| LAEF, % | 30.1 (9.4) | 40.6 (7.4) | 44.1 (8) | <.001 |
| MVA, cm2 | 0.9 (0.1) | 1.8 (0.2) | 1.7 (0.2) | <.001 |
LABCIV, left atrium before-contraction indexed volume; LAEF, left atrium emptying fraction; LAMAXIV, left atrium maximum indexed volume; LAMINIV, left atrium 3-dimensional minimum indexed volume; LVEDV, left ventricle end diastolic volume; LVEF, left ventricle ejection fraction; LVESV, left ventricular end-systolic volume; MVA, mitral valve area as measured by echocardiography; MVS, mitral valve stenosis patients; ns, not significant; pre-PBV, pre-percutaneous balloon valvuloplasty; PBV, percutaneous balloon valvuloplasty.
The values are shown as the means (standard deviations), analysis of variance.
 in mitral valve stenosis patients undergoing percutaneous balloon valvuloplasty. 3D LAEF, 3-dimensional left atrium emptying fraction; pre-PBV, pre-percutaneous balloon valvuloplasty; PBV, percutaneous balloon valvuloplasty. *P<.05, analysis of variance.")
Left atrium 3-dimensional emptying fraction echocardiographic temporal evolution (72h and 12 months) in mitral valve stenosis patients undergoing percutaneous balloon valvuloplasty. 3D LAEF, 3-dimensional left atrium emptying fraction; pre-PBV, pre-percutaneous balloon valvuloplasty; PBV, percutaneous balloon valvuloplasty.
*P<.05, analysis of variance.
In the sinus rhythm group, 2- and 3D maximum and minimum volumes were higher than in the AF group, [3D maximum indexed volume: 47.8 (2.8) mL/m2, 3D minimum indexed volume: 29.5 (1.4) mL/m2; 2D maximum indexed volume: 46.3 (2.1) mL/m2 2D minimum indexed volume: 28.2 (1.1) mL/m2], respectively.
The intraobserver concordance coefficients (maximum and minimum indexed LA volumes and 3D LAEF) were as follows: 4.5%, 4.2%, and 5.1%, respectively. The interobserver concordance coefficients (maximum and minimum indexed LA volumes and 3D LAEF) were 8.5%, 6.7%, and 6.3%, respectively.
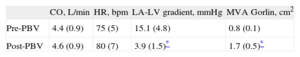
Invasive Hemodynamic MeasurementsThe results of the invasive hemodynamic measurements are shown in Table 4. PBV was considered to have been successful in 28/31 (90.3%) MVS patients. Among the 3 cases considered as unsuccessful, the post-PBV MVA was 0.85cm in 1 patient, and significant mitral valve regurgitation occurred in 2 patients. No deaths occurred during the procedure.
Invasive Hemodynamic Measurements in Mitral Valve Stenosis Patients Pre-and Post-percutaneous Balloon Valvuloplasty.
| CO, L/min | HR, bpm | LA-LV gradient, mmHg | MVA Gorlin, cm2 | |
| Pre-PBV | 4.4 (0.9) | 75 (5) | 15.1 (4.8) | 0.8 (0.1) |
| Post-PBV | 4.6 (0.9) | 80 (7) | 3.9 (1.5)* | 1.7 (0.5)* |
CO, cardiac output; HR, heart rate; LA, left atrium; LV, left ventricle; MVA Gorlin, mitral valve area measured using the Gorlin equation; pre-PBV, pre-percutaneous balloon valvuloplasty; post-PBV, post-percutaneous balloon valvuloplasty.
The values are shown as the means (standard deviations); P=not significant post-percutaneous balloon valvuloplasty (cardial output, heart rate); Student t test.
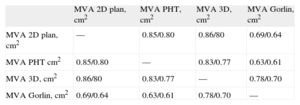
The correlations among 2D echocardiography, RT3DE and invasive measurements are shown in Table 5. Better correlations were observed for 2D echocardiography than for RT3DE (pre- and post-PBV).
Pearson's Correlation Coefficients Relating Echocardiographic and Invasive Hemodynamic Measurements in Mitral Valve Stenosis Patients Pre-and 72 h (Echo) Post-percutaneous Balloon Valvuloplasty.
| MVA 2D plan, cm2 | MVA PHT, cm2 | MVA 3D, cm2 | MVA Gorlin, cm2 | |
| MVA 2D plan, cm2 | — | 0.85/0.80 | 0.86/80 | 0.69/0.64 |
| MVA PHT cm2 | 0.85/0.80 | — | 0.83/0.77 | 0.63/0.61 |
| MVA 3D, cm2 | 0.86/80 | 0.83/0.77 | — | 0.78/0.70 |
| MVA Gorlin, cm2 | 0.69/0.64 | 0.63/0.61 | 0.78/0.70 | — |
MVA 2D Plan, mitral valve area measured by 2-dimensional planimetry; MVA 3D, mitral valve area measured by 3-dimensional echocardiography; MVA Gorlin, mitral valve area measured using the Gorlin equation; MVA PHT, mitral valve area measured using the pressure half-time method.
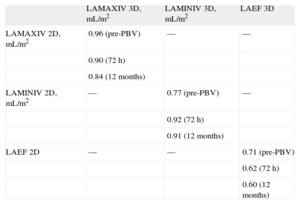
Pearson's correlation coefficients (r) showing the relationship between the values obtained for LA volumes and LAEFs in MVS patients, using 2D echocardiography compared to RT3DE, are shown in Table 6.
Pearson's Correlation Coefficients Relating 2- and 3-dimensional Left Atrium Volumes and Emptying Fractions in Mitral Valve Stenosis Patients Pre-, 72 h and 12 Months After Percutaneous Balloon Valvuloplasty.
| LAMAXIV 3D, mL/m2 | LAMINIV 3D, mL/m2 | LAEF 3D | |
| LAMAXIV 2D, mL/m2 | 0.96 (pre-PBV) | — | — |
| 0.90 (72 h) | |||
| 0.84 (12 months) | |||
| LAMINIV 2D, mL/m2 | — | 0.77 (pre-PBV) | — |
| 0.92 (72 h) | |||
| 0.91 (12 months) | |||
| LAEF 2D | — | — | 0.71 (pre-PBV) |
| 0.62 (72 h) | |||
| 0.60 (12 months) |
LAEF 2D, left atrium 2-dimensional emptying fraction; LAEF 3D, left atrium 3-dimensional emptying fraction; LAMAXIV 2D, left atrium 2-dimensional maximum indexed volume: LAMAXIV 3D, left atrium 3-dimensional maximum indexed volume; LAMINIV 2D, left atrium 2-dimensional minimum indexed volume; LAMINIV 3D, left atrium 3-dimensional minimum indexed volume; pre-PBV, pre-percutaneous balloon valvuloplasty.
The main finding of this study was that PBV was correlated with temporal progressive (12 months after PBV) and acute (72h after PBV) decreases in the LA maximum and minimum indexed volumes. These results were achieved with both 2D echocardiography and RT3DE and indicate the existence of acute and progressive reverse LA remodeling. The main acute impact on the LA was a decrease in the mitral valve afterload, as reflected by an increase in the mitral valve area, a decrease in the mean and maximum mitral valve gradients and a decrease in pulmonary systolic pressure. Additionally, a decrease in the LA anteroposterior diameter was observed, despite moderate correlations between this parameter and the 2D and RT3DE LA volumes (r=0.54 and 0.53 for pre-PBV 2D and RT3DE volumes, respectively).
After PBV, substantial declines in transmitral gradients are usually observed. In the present study, a substantial decrease in transmitral gradients (maximum and medium) 72h after PBV was followed by a >15% decrease in LA volumes (2- and 3D echocardiographic analysis) and an increase in the LAEF, which may represent a tight relationship among pressure, volume and function. Additionally, a decrease in the occurrence of AF 72h after PBV (3/6 patients with previous AF pre-PBV) could represent the well-known connection among anatomy, physiology and rhythm. These LA changes were mainly detected at 72h after PBV and were not as marked after the 12-month follow-up, which could be explained by the substantial decrease in mitral valve afterload immediately after PBV. The present study comprised a small population of mitral valve patients and the percentage of AF was up to 21.4%, which could be considered to be a result of early diagnosis of the valvular disease.
Reverse LA remodeling has a prognostic clinical impact in several different scenarios. For instance, in a study of 337 patients with dilated cardiomyopathy,16 a 3.8-times higher risk for death and the need for transplantation were observed when the LA maximum volume was >68.5mL/m2. LA has prognostic implications in Chagas’ heart disease patients17 and in sinus rhythm patients.18 In a recent 2D echocardiographic investigation with 33 MVS patients who underwent PBV, LA volumetric decreases were observed immediately after and 30 days after the procedure.19 The maximum indexed volume observed in LA pre-PBV was 56 (14) mL/m2, with a reduction to 48 (12) mL/m2 immediately after PBV (14.2% decrease, P=.0002), and 45 (13) mL/m2 (23.2% decrease, P<.0001) 30 days after PBV. In the present study, the maximum indexed volume in LA pre-PBV was 59.3 (14.1) mL/m2, with a reduction to 49.8 (14.6) mL/m2 (16% decrease, P<.001) at 72h and to 46.5 (12.1) mL/m2 (21.5% decrease, P<.001) 12 months after the procedure.
Unexpectedly and in opposition to what we have reported previously in relation to other populations (normal volunteers, patients with dilated cardiomyopathy and patients with hypertrophic cardiomyopathy),5 3D LA volumes were smaller than 2D LA volumes. We wonder if this finding could be the result of some sort of influence of rhythm in the population analyzed (up to 21.4% of the patients had AF). We hypothesize that other analyses considering RT3DE derived from a single heart beat and with a larger population could generate different results.
Importantly, another notable finding of the present study was the acute and progressive improvement of the LAEF. LAEF seems to be a useful index in several clinical situations.20,21 In our investigation, the observation of acute as well as temporal progressive LAEF improvement, which could positively impact the future follow-up of MVS patients, was also identified by both 2- and 3D echocardiography.
LA volumes are measured using various imaging techniques with various concordances. In a recent study comparing 64-slice computed tomography and 2D and RT3DE echocardiography,22 a better correlation was observed for computed tomography and RT3DE (r=0.95, P<.001) compared to 2D echocardiography and computed tomography (r=0.86, P<.001). Comparisons between magnetic resonance imaging and LA RT3DE analysis have yielded good results,23 with small intra- and interobserver variability. In the present study, the LA RT3DE intra- and interobserver variability were considered to be adequate. In agreement with previous observations.24,25 we believe that RT3DE could become the technique of choice for daily LA analysis, considering its higher sensitivity to volume modifications.14
LimitationsThe small number of patients included in this analysis is a limitation to the results of this study. The use of RT3DE derived from 2-4 heart beats rather than from a single beat could be considered another limitation.
ConclusionsIn symptomatic MVS patients undergoing PBV analyzed by 2- and 3D echocardiography, improvements in LA reverse remodeling and LAEF were observed 72h and 12 months after the procedure.
Conflicts of interestNone declared.