Keywords
INTRODUCTION
Physicians routinely have to integrate information from various diagnostic tests. This information can come from various sources (images, quantitative data, schematic representations) in diverse formats (radiographic films, color photographs, digital images), but it must be integrated adequately so that the physician can reach a correct conclusion.
The aim of this study is to present a method for integrating the anatomic information relative to the epicardial coronary arteries obtained from coronariography with physiological information about tissue perfusion from tomographic radionuclide studies of myocardial perfusion. With this method, the coronary arterial tree visualized by catheterization is superimposed on the three-dimensional epicardial surface extracted from tomographic images of the myocardial perfusion scan. This integration makes it possible to view the coronary tree and myocardial perfusion in a single three-dimensional display, from any possible angle because of the maneuverability of the integrated image obtained.
Although some previous studies have developed this presentation format,1,2 until now the information obtained by injecting a radionuclide marker during occlusion of a coronary artery in the course of an angioplasty has not been available. This method makes it possible to compare the area of the perfusion defect with the occluded coronary artery, which allows the unification of this information to be validated.3 This procedure is based on the absence of redistribution of the technetium-marked compounds (99mTc-tetrofosmin), which makes it possible to obtain a delayed image of the myocardial situation at the time of the injection.
METHODS
Patients
In order to validate the unification method and correctly associate each coronary vessel with a specific territory, and thus evaluate the correct superimposition of the vessel on the territory, we selected 3 patients. The patients had not had a previous infarction, had stable angina and a positive effort stress test, were receiving medical treatment and were scheduled for revascularization by angioplasty and/or stent according to clinical criterion. Patients gave informed consent and had single-vessel disease: a) 68 year-old man with proximal stenosis of 95% of the anterior descending artery; b) a 46 year-old man with proximal stenosis of 75% of the dominant right coronary artery, and c) a 54 year-old man with dominant right coronary artery and stenosis of 90% of the circumflex coronary. All of the patients had a normal left ventricular systolic function (ejection fraction 58%, 65%, and 63%, respectively).
Coronariography
Images of the coronariography and tomographic radionuclide scan of myocardial perfusion were obtained in digital format. The coronariographic study was carried out with Philips Optimus M200 biplanar equipment, with a visual field of 7", after previous calibration of the distance between the emitter and intensifier (to adjust the magnification factor). A digital recording of the angiographic images was made on a compact disk (CD) using DICOM file software.
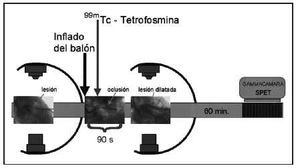
Once the arterial lesion was located, the balloon catheter was introduced in the stenotic zone. The balloon was inflated 10-15 s later and 22 mCi of 99mTc-tetrofosmin was administered intravenously. The balloon was kept inflated for a total time of 90 s (Figure 1).

Fig. 1. Diagram of the coronariographic and scintigraphic procedure, with administration a dose of 99mTc-tetrofosmin during occlusion.
Once dilation concluded, the biplanar images were repeated to confirm the result of the dilation, but not necessarily the orthogonal ones. These biplanar images were stored with their angular and azimuthal values for their later spatial localization.
Myocardial perfusion SPET
Once the angiographic study concluded (approximately 60 min after administering the radionuclide dose), the patient was transferred to the nuclear medicine service to obtain the corresponding tomographic radionuclide images at the time of the occlusion. The radionuclide scan was made with a single-head Elscint SP-4 gammacamera. Images were acquired using a low-energy, high-resolution collimator, adapting the window of detection to 99mTc, and obtaining 60 images in matrix of 64,2 with an enlargement factor of 1.2. A semicircular orbit of 180° was made beginning at the 30° right anterior oblique position, at a rate of 22 s per image.
Patients were scheduled two days later for tomographic myocardial perfusion radionuclide scan (SPET) in baseline resting conditions. A new dose of 99mTc-tetrofosmin (22 mCi) was administered at rest. Detection was carried out 60 min after radionuclide administration and the same acquisition method was used. The tomographic studies were processed at a workstation, and the tomographic reconstruction was made by filtered retroprojection (Butterworth filter, frequency 0.4, order 5), obtaining reoriented coronal sections (short-axis sections). These sections were stored in Interfile 3.3 format with the orbit parameters, angle of detection, interval, and time per image.
Three-dimensional reconstruction, identification of structures, and integration
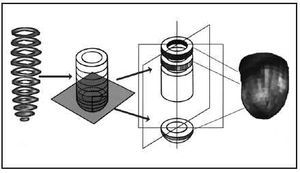
The images originating from coronariography (DICOM format) and SPET (interfile format) were imported to a workstation for three-dimensional reconstruction and unification. The short-axis sections were superimposed from the base to the apex, isolating the apical cap. In the apical zone, circumferential profiles were made of the maximum counts based on spherical coordinates (assuming that the apical zone is a hemisphere), and in the rest of the myocardium the profiles were made from cylindrical coordinates4,5 (Figure 2). Once the profiles were made, three-dimensional modeling was generated based on small triangles (Figure 3), which were adapted to the real distance, measured in the short-axis sections, to fit the morphology of the three-dimensional model to the real morphology of the subject´s myocardium. In addition, each triangle was colored with the level of color representative of the maximal counts found in the profile zone.

Fig. 2. Scheme of the three-dimensional reconstruction of myocardial perfusion images from short-axis sections.

Fig. 3. Three-dimensional model based on small triangles, before rendering.
The epicardial and endocardial contours also were modeled. For this purpose, it was initially assumed that the standard thickness was 1 cm.6 For each short-axis section, calculations were made from the profile of maximum counts, following a Gaussian curve of count densities, of the epicardial contour (the outer profile of maximum counts) and endocardial contour (the inner profile of maximum counts). The initial thickness was fitted to the real thickness observed in each short-axis section, and the three-dimensional epicardial and endocardial model was generated.7
Finally, the model based on small triangles was rendered to obtain a smooth, continuous transition between triangles, thus generating the final solid volumetric display that expressed the perfusion of the underlying myocardium on its surface.7 On the epicardial model, the structure of the anterior interventricular sulcus was identified (defined by the right and left ventricular union on the anterior face), and served as a reference for positioning the catheterization images.
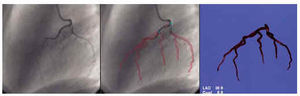
The biplanar coronariographic images of the left and right coronary artery were presented simultaneously. On this bidimensional visualization, the coronary artery superimposition vectors were traced by triangulation, either automatically or with the aid of the operator, so that two images of the coronary vessels could be drawn simultaneously8 (Figure 4). Once these vectors were isolated, a three-dimensional display of the coronary vessels could be generated. In order to verify the adequacy of this 3D display, bidimensional visualizations of the 3D image were generated at the same angles at which the catheterization images were obtained, then superimposed for confirmation.9

Fig. 4. Process of digitalizing the coronary tree. On the left, the angiographic image of the left coronary artery. In the center the vessel contours are delimited (in red) and the superimpositions are marked (clear blue). On the right, the three-dimensional image of the selected coronary tree.
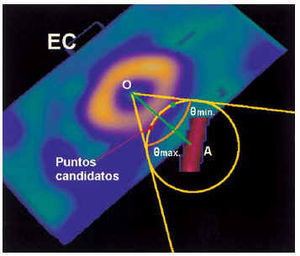
The three-dimensional models of the epicardium and coronary vessels were scaled to the same proportions and adjusted to their exact location on the epicardial surface. The ICP (iterative closest point)10 algorithm was used for this purpose. For each segment of the coronary vessels, its position was fitted iteratively to the zone of epicardial surface closest to the vessel (Figure 5). Schematically, the epicardial surface was sampled for each segment. An interaction cone was delimited from the center of the myocardial mass and vessel segment, a sphere of interaction was delimited centering on the vessel and intersecting the epicardial surface, and, within the zone of intersection, the epicardial zone closest to the vessel was sought iteratively.

Fig. 5. Functional scheme of the ICP (iterative closest point) algorithm. Within the cone of interaction from the center of the section (O), with an opening of ± theta degrees, the sphere centering on the vessel is englobed (A) and the possible, or candidate, points of interaction are marked (red line). The most probable (red point) is defined as the sphere/red line interaction closest to the OA line of union. SA indicates short axis.
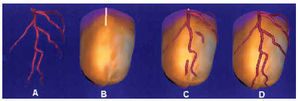
Once the vessels were modeled on the epicardial surface, the surface texture was adjusted and the combined unified display was generated (Figure 6). Finally, the three-dimensional myocardial perfusion of each patient was compared with a database of normality for tetrofosmin (ECT), shading in black (blackout) the myocardial zones less perfused than the standard deviations defined by the database of normality for each sector.11,12

Fig. 6. A: Three-dimensional model of the anterior descending coronary (the same as in Figure 4). B: 3D model of the epicardium with the anterior interventricular sulcus marked and the isolated 3D coronary tree shown. C: Superimposition of the first section of the anterior descending coronary and anterior interventricular sulcus and fit of the coronary vessels to the epicardial surface using the ICP (iterative closest point) algorithm. D: Unified final display.
RESULTS
No patient presented complications during catheterization. Only one patient complained of mild precordial discomfort at the end of balloon inflation, showing a slight depression in the ST segment (0.5 mm) that remitted in the first minute after dilation.
In the 3 patients selected, the three-dimensional reconstruction of the epicardial contour and complete coronary tree were made correctly (Figures 7-9). In every case, the coronary vessels were correctly delineated (the occluded vessel shown by a line profiled in navy blue and the healthy vessel in red) on the coronariographic image. The zones of superimposition were colored light blue to better identify them on orthogonal images. The point of occlusion was outlined in green. In the unified three-dimensional display the coronary vessels were colored red, whereas the distal section of the occluded coronary vessel was colored green. This coloring made it possible to check the agreement between the compromised zone of epicardium (extension of the perfusion defect in black) and the anatomical distribution of the occluded vessel.

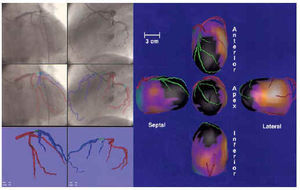
Fig. 7. Patient with occlusion of the anterior descending artery. On the left, the process of digitalization, selection of coronary vessels, and three-dimensional display of the left coronary tree (the vessel distal to the occlusion is shown in blue). On the right, unified three-dimensional image of the right and left coronary tree (the vessel distal to the occlusion is in green) on the epicardial surface colored with myocardial perfusion. The zone of hypoperfusion corresponding to the occluded artery is indicated in black.

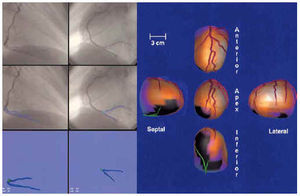
Fig. 8. Patient with occlusion of the right coronary artery. On the left, the process of digitalization, selection of the coronary vessel from the angle of the posterior interventricular sulcus, and three-dimensional display of the right coronary tree selected (in blue). On the right, unified three-dimensional image with the right and left coronary tree (the vessel distal to the occlusion is in green) on the epicardial surface colored with myocardial perfusion. The zone of hypoper fusion corresponding to the occluded artery is indicated in black.

Fig. 9. Patient with occlusion of the circumflex coronary artery. On the left, the process of digitalization, selection of coronary branches, and three-dimensional display of the left coronary tree (the vessel distal to the occlusion is shown in blue). On the right, the unified three-dimensional display of the right and left coronary tree (the vessel distal to the occlusion is in green) on the epicardial surface colored with myocardial perfusion. The zone of hypoperfusion corresponding to the occluded artery is indicated in black.
In Figure 7, the process and the results of three-dimensional fusion obtained during occlusion of the anterior descending coronary artery are illustrated. On the left can be seen the digitalization, isolation, and selection of the left coronary vessels, and the isolated three-dimensional display of the left coronary tree with the point of occlusion marked in the two biplanar views obtained. On the right is shown the three-dimensional display of myocardial perfusion, with the area of low uptake due to coronary occlusion in black, and the rest of the myocardium and its corresponding perfusion expressed on the surface. Good agreement is observed between the occluded zone (in black) and the epicardial distribution of the occluded vessel (in green).
In Figure 8, the process and the results obtained in the patient with occlusion of the right coronary are shown. There is good agreement between the compromised zone (in black) and the epicardial distribution of the occluded vessel (in green). In this case, only the posterior interventricular section of the right coronary artery is shown because it is the only one superimposable on the epicardial contour.
In Figure 9 can be seen the process and results obtained in the patient with occlusion of the circumflex coronary artery. The agreement between the occluded zone (in black) and the epicardial distribution of the occluded vessel (in green) is excellent.
DISCUSSION
The progressive improvement in the display of tomographic radionuclide images of myocardial perfusion has entailed, on the one hand, better delimiting the myocardial territories affected and, on the other hand, optimizing the visualization format so that it is closer to reality. In the 1980s, the myocardial perfusion studies were made with planar technology and a display of three views (anterior, 40° left oblique anterior, and lateral left).13 In the early 1990s, tomographic studies began with a bidimensional display of the realigned myocardial sections (short axis, horizontal long axis, and vertical long axis) following the display standards of the American Society of Nuclear Cardiology, the American College of Cardiology, and the Society of Nuclear Medicine.14 Nonetheless, tomographic images still had to be assessed one by one.
Polar images were designed15 to summarize tomographic information in a single bidimensional image that also serves as a basis for quantifying myocardial perfusion studies, since they summarize the entire myocardium in a single image. The main problem of the polar map is the distortion that is produced when volumetric information is expressed in a single plane. In the mid-1990s, to avoid this distortion of the polar maps, three-dimensional models of the epicardial surface began to be displayed,16-18 eventually reaching the current displays with modulated color on the surface.1,19 At the same time, coronariographic studies also evolved. Their acquisition format passed from photographic film to digital images on CD. In addition, biplanar images were simultaneously obtained with double arc equipment and quantitative analysis of coronary stenoses was introduced.
All this returns to the cardiologist, who must integrate the information from both techniques precisely in order to extract the maximum amount of information.20-25 The current formats of tomographic myocardial perfusion radionuclide scans include displays of tomographic sections, quantified polar maps and, in some cases, three-dimensional images with color modulation. The present formats of displaying catheterization images include reviewing film in digital format (in the hemodynamics laboratory) or exporting it to CD format, which the cardiologist can visualize with a specific program on a personal computer. The summary of the information that reaches the clinical cardiologist integrates a selection of the best biplanar views of coronary stenoses plus a general image of the tree, accompanied by quantitative assessment, when made, of the coronary stenoses.
The method described does not increase the diagnostic performance of either SPET or coronariography, since the limitations of both techniques are reflected in the three-dimensional images obtained, but it facilitates the localization and identification of the responsible vessel. Previously, results have been reported that demonstrate an acceptable correlation between SPET and coronariography,26 obviating the need for three-dimensional images. However, unifying the images of myocardial perfusion and coronariography could greatly facilitate integration by the cardiologist of information from both examinations, since the myocardial perfusion and coronariographic data are condensed into a single display. This not only benefits cardiologists because if the process of generating a unified display is integrated in a rapid program combining catheterization and nuclear medicine information, hemodynamics and nuclear medicine specialists also benefit.
The performance of catheterization with radionuclide images of a previous myocardial perfusion study allows the hemodynamics specialist to rapidly and directly evaluate the responsible lesion, as well as to determine if a perfusion defect corresponds to one artery or another. This facilitates therapeutic decision-making, and provides a positioning reference for the equipment of the angles of the three-dimensional coronariographic images that best delimit the lesion.
The benefit for the nuclear medicine specialist would also be important, since an image of the patient´s coronary tree from previous coronariography would enormously improve the accuracy of results, particularly in the conflictive borderline territories between two coronary vessels. In addition, this coronariographic data would be available for future follow-up studies of coronary artery disease, thus facilitating the identification of the artery causing the perfusion defects before performing interventionist catheterization, if called for.
Currently there are SPET processing programs that include generic coronary trees (based on dominance). These images are easily superimposed on the three-dimensional images of myocardial perfusion, adapting the vessel pattern to the size of the ventricle, even with the gated-SPET technique, for each phases of the cardiac cycle from systole to diastole, adapting to volumetric changes in ventricular contraction.
In summary, the three-dimensional superimposition of myocardial perfusion and coronariographic images is technically possible using the information from SPET and coronariographic images that are not necessarily orthogonal nor simultaneous. This makes it possible to integrate anatomic (coronary tree) and functional (myocardial perfusion tissue) information that can improve decision-making by the cardiologist and the treatment of coronary patients. In the future, work should be done to potentiate the automaticity and speed of these integration programs, as well as their inclusion in the routine work of hemodynamics and nuclear medicine teams. This would make this information available immediately to clinical cardiologists, interventionists, and nuclear medicine specialists at their monitors for use in daily practice.
Correspondencia: Dr. S. Aguadé Bruix.
Servicio de Medicina Nuclear. Hospital Universitari Vall d'Hebron.
P.o de la Vall d'Hebron, 119-129. 08035 Barcelona. Spain.