Despite the advances in sudden cardiac death (SCD) prediction in hypertrophic cardiomyopathy (HCM), interest in new risk markers is growing.1 Late gadolinium enhancement (LGE) quantified as a percentage of left ventricular (LV) mass in cardiac magnetic resonance (CMR) has been suggested as an independent predictor for SCD.2 Areas of interstitial fibrosis or myocyte disarray also seem to be important to the genesis of ventricular arrhythmias.3
Tissue tracking imaging enables quantitative assessment of myocardial mechanics by evaluating myocardial deformation. Reduced strain was shown to correlate with interstitial fibrosis3 and strain values were described as being lower in areas of hypertrophied nonenhanced myocardium, suggesting that mechanisms such as myocyte disarray may also contribute.4 Given the combination of image quality with the possibility of easy postprocessing analysis, feature tracking cardiac magnetic resonance (FT-CMR) is increasingly used in clinical practice. Global measurements are more reproducible than regional ones; although feasible, there is limited experience of the use of 3D strain measurements.
Our aim was to analyze the association between LV 2D global strain measurements using FT-CMR, morphologic features and prognostic markers in HCM.
We retrospectively reviewed consecutive HCM patients followed up clinically at 2 referral centers, who were older than 16 and had a diagnostic CMR assessment during follow-up. Those with HCM caused by metabolic or syndromic diseases or with evidence of coronary artery disease (coronary stenosis ≥ 50% or subendocardial LGE on CMR) were excluded. We defined “ventricular arrhythmias” (VA) as nonsustained ventricular tachycardia on 24h-Holter monitoring (timing decided by the attending physician), sustained ventricular tachycardia, ventricular fibrillation or SCD. SCD risk was estimated using the score proposed in the European Society of Cardiology 2014 guidelines.
CMR imaging was acquired on 1.5 T scanners and imaging analysis was performed by 2 expert readers (one in each center). LGE was assessed 10 to 15minutes after intravenous administration of gadobutrol/gadoterate meglumine using a phase-sensitive inversion-recovery sequence. The LV short-axis stack of LGE images was first assessed visually for the presence of LGE. Quantification of LGE was then performed by 1 expert reader (N. Dias Ferreira) on all LGE-positive studies by measuring regions with signal intensity> 5SD above remote myocardium and expressed as a percentage of LV mass. 2D peak global radial strain (GRS), global longitudinal strain (GLS) and global circumferential strain (GCS) were evaluated retrospectively on steady state free precession sequences using a commercially available software (cvi42, Circle Cardiovascular Imaging Inc, Calgary, Canada). Endocardial and epicardial borders were manually drawn in the end-diastolic and end-systolic frame in the long-axis slices and in all short-axis slices comprised between the base and the apex. GLS was averaged from the 3 standard longitudinal views while GRS and GCS were averaged from the basal, mid and apical LV short-axis planes.
Comparisons between groups were performed using the Student t test, Mann–Whitney U, Kruskal-Wallis, chi-square or Fisher exact tests as appropriate. Correlations were measured by the Spearman's coefficient. Statistical significance was defined as a P value <.05.
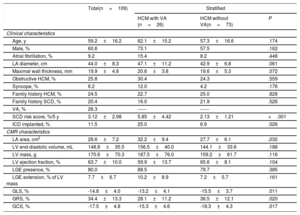
A total of 109 HCM patients (60.6% males), with a mean age of 59.2±16.2 years, were included in the study. Mean follow-up was 39±25 months and VA were documented in 26 patients (26.3%): 24 patients with nonsustained ventricular tachycardia and 2 with SCD. Mean estimated baseline SCD risk at 5 years was 3.12±2.98% (79.1% low-risk, 11.6% intermediate-risk and 9.3% high-risk). LGE was observed in 80% of patients and involved 7.7±6.7% of LV mass. Mean GLS, GRS and GCS were −14.8±4.0%, 34.4±13.3% and−17.5±4.8%, respectively. Table 1 summarizes clinical and CMR characteristics of the total population and after stratification for the presence of VA.
Clinical and CMR characteristics of total population and after stratification by presence of VA
| Total(n=109) | Stratified | |||
|---|---|---|---|---|
| HCM with VA (n=26) | HCM without VA(n=73) | P | ||
| Clinical characteristics | ||||
| Age, y | 59.2±16.2 | 62.1±15.2 | 57.3±16.6 | .174 |
| Male, % | 60.6 | 73.1 | 57.5 | .162 |
| Atrial fibrillation, % | 9.2 | 15.4 | 8.2 | .448 |
| LA diameter, cm | 44.0±8.3 | 47.1±11.2 | 42.9±6.8 | .061 |
| Maximal wall thickness, mm | 19.9±4.8 | 20.6±3.8 | 19.6±5.3 | .072 |
| Obstructive HCM, % | 25.8 | 30.4 | 24.3 | .559 |
| Syncope, % | 6.2 | 12.0 | 4.2 | .176 |
| Family history HCM, % | 24.5 | 22.7 | 25.0 | .828 |
| Family history SCD, % | 20.4 | 16.0 | 21.9 | .526 |
| VA, % | 26.3 | ------ | ------ | |
| SCD risk score, %/5 y | 3.12±2.98 | 5.85±4.42 | 2.13±1.21 | <.001 |
| ICD implanted, % | 11.5 | 25.0 | 6.9 | .026 |
| CMR characteristics | ||||
| LA area, cm2 | 28.6±7.2 | 32.2±9.4 | 27.7±6.1 | .032 |
| LV end-diastolic volume, mL | 148.8±35.5 | 156.5±40.0 | 144.1±33.6 | .188 |
| LV mass, g | 170.6±70.3 | 187.5±76.0 | 159.2±61.7 | .116 |
| LV ejection fraction, % | 63.7±10.0 | 59.9±13.7 | 65.6±8.1 | .104 |
| LGE presence, % | 80.0 | 88.5 | 79.7 | .385 |
| LGE extension, % of LV mass | 7.7±6.7 | 10.2±8.9 | 7.2±5.7 | .161 |
| GLS, % | -14.8±4.0 | -13.2±4.1 | -15.5±3.7 | .011 |
| GRS, % | 34.4±13.3 | 28.1±11.2 | 36.5±12.1 | .020 |
| GCS, % | -17.5±4.8 | -15.3±4.6 | -18.3±4.3 | .017 |
CMR, cardiac magnetic resonance; GCS, global circumferential strain; GLS, global longitudinal stain; GRS, global radial strain; HCM, hypertrophic cardiomyopathy; ICD, implantable cardioverter-defibrillator; LA, left atrium; LGE, late gadolinium enhancement; LV, left ventricle; SCD, sudden cardiac death; VA, ventricular arrhythmias.
Unless otherwise indicated, values are mean±standard deviation or percentage.
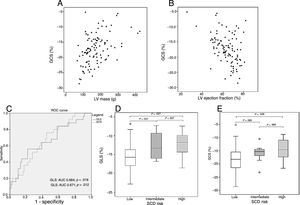
Impaired strain values correlated with higher LV mass (GLS: r=0.46; GRS: r=−0.46; GCS: r=0.47 – figure 1A; P <.001 for all), reduced LV ejection fraction (GLS: r=−0.33; GRS: r=0,44; GCS: r=−0.41 – figure 1B; P <.003 for all) and LGE extension (GLS: r=0.24, P=.027; GRS: r=−0.34, P=.001; GCS: r=0.37; P <.001).
 and ejection fraction (B) showing a correlation between the 2 variables. Receiver operating curve for the ability of GLS and GCS to predict ventricular arrhythmias (C). Boxplots of GLS (D) and GCS (E) stratified by sudden cardiac death risk category. AUC, area under the curve; GCS, global circumferential strain; GLS, global longitudinal stain; SCD, sudden cardiac death; LV, left ventricular.")
Scatter plots of GCS values relative to left ventricle mass (A) and ejection fraction (B) showing a correlation between the 2 variables. Receiver operating curve for the ability of GLS and GCS to predict ventricular arrhythmias (C). Boxplots of GLS (D) and GCS (E) stratified by sudden cardiac death risk category. AUC, area under the curve; GCS, global circumferential strain; GLS, global longitudinal stain; SCD, sudden cardiac death; LV, left ventricular.
Patients with VA had worse strain values (GLS−13.2±4.1% vs−15.5±3.7%, P=.011; GRS 28.1±11.2% vs 36.5±12.1%, P=.02; GCS−15.3±4.6% vs−18.3±4.3%, P=.017), table 1. Receiver operating curve for the ability of GLS and GCS to predict VA showed an area under the curve of 0.664 (95%CI, 0.535–0.793) and 0.671 (95%CI, 0.552–0.789) respectively – figure 1C.
Patients with low estimated risk of SCD had better GLS values than those at intermediate (−15.5±3.8 vs−12.6±3.5; P=.031; figure 1D) and high-risk (−12.2±3.6, P=.027; figure 1D). They also had better GCS values compared with those at high-risk (−18.0±4.5 vs−14.5±4.3, P=.028; figure 1E) and a tendency toward better values compared with patients at intermediate SCD risk (−15.9±3.3, P=.065; figure 1E).
The correlations found between strain and LV mass, ejection fraction and LGE extension are consistent with previous studies using FT-CMR.5,6 However, LGE extension was not significantly different in patients with or without VA. This might be explained in part by the relatively small population. Another study limitation was the residual number of sudden cardiac deaths; mirroring the methodology in other small studies, we have included nonsustained ventricular tachycardia in the arrhythmic composite outcome. Additionally, as we recruited only patients who underwent CMR, it is possible that a selection bias existed.
In our cohort, mean strain values were within the normal range. However, they were significantly better in patients with lower arrhythmic risk.
In conclusion, worse strain measurements were associated with a more severe HCM phenotype, the presence of VA and a higher estimated risk of SCD. Larger prospective studies are needed to assess its incremental value relative to the existing markers of SCD risk in HCM.
Supplementary data associated with this article can be found in the online version available at http://dx.doi:10.1016/j.rec.2020.02.008