Cardiopulmonary exercise testing (CPET) is a valuable tool for functional evaluation of patients with Fontan circulation and can be performed on a treadmill or a cycle ergometer, depending on the laboratory. Although both modalities analyze the same parameters, there is limited information on the differences in values obtained from each type of test in this group of patients. In this study, the results of CPET were retrospectively compared in 19 patients with Fontan circulation, performed sequentially on a treadmill and a cycle ergometer. All patients were aged 16 years and were clinically stable, and there were no clinical or therapeutic changes between the 2 tests. The study was approved by the local ethics committee, and all patients provided informed consent.
The protocols used were the ramped Bruce or modified ramped Bruce protocols for the treadmill, and the ramped protocol at 10-15W/min for the cycle ergometer. During the test, patients breathed through a face mask (7450-Series V2, Hans-Rudolph, United States) connected to a gas analysis system Ergostik-Cardiopart (Geratherm-AMEDTEC, Germany). Peripheral oxygen saturation (SpO2) was monitored using a pulse oximeter, and blood pressure was recorded.
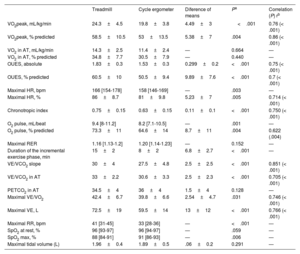
Maximal effort was defined as a respiratory exchange ratio (RER) ≥ 1.10. The analyzed parameters are summarized in table 1. The anaerobic threshold was determined using the V-slope method. The VE/VCO2 slope was considered until the respiratory compensation point. Predicted oxygen consumption (VO2) was calculated using the Wasserman formula. The predicted values of the oxygen uptake efficiency slope (OUES) were calculated using the Buys equation for Caucasian adults aged 20 to 60 years and the Akkerman equation for individuals aged 16 to 20 years.
Parameters of the cardiopulmonary stress test and correlations
| Treadmill | Cycle ergometer | Diference of means | Pa | Correlation (P) rb | |
|---|---|---|---|---|---|
| VO2peak, mL/kg/min | 24.3±4.5 | 19.8±3.8 | 4.49±3 | <.001 | 0.76 (< .001) |
| VO2peak, % predicted | 58.5±10.5 | 53±13.5 | 5.38±7 | .004 | 0.86 (< .001) |
| VO2 in AT, mL/kg/min | 14.3±2.5 | 11.4±2.4 | — | 0.664 | — |
| VO2 in AT, % predicted | 34.8±7.7 | 30.5±7.9 | — | 0.440 | — |
| OUES, absolute | 1.83±0.3 | 1.53±0.3 | 0.299±0.2 | <.001 | 0.75 (< .001) |
| OUES, % predicted | 60.5±10 | 50.5±9.4 | 9.89±7.6 | <.001 | 0.7 (< .001) |
| Maximal HR, bpm | 166 [154-178] | 158 [146-169] | — | .003 | — |
| Maximal HR, % | 86±8.7 | 81±9.8 | 5.23±7 | .005 | 0.714 (< .001) |
| Chronotropic index | 0.75±0.15 | 0.63±0.15 | 0.11±0.1 | <.001 | 0.750 (< .001) |
| O2 pulse, mL/beat | 9.4 [8-11.2] | 8.2 [7.1-10.5] | — | .001 | — |
| O2 pulse, % predicted | 73.3±11 | 64.6±14 | 8.7±11 | .004 | 0.622 (.004) |
| Maximal RER | 1.16 [1.13-1.2] | 1.20 [1.14-1.23] | — | 0.152 | — |
| Duration of the incremental exercise phase, min | 15±2 | 8±2 | 6.8±2.7 | <.001 | — |
| VE/VCO2 slope | 30±4 | 27.5±4.8 | 2.5±2.5 | <.001 | 0.851 (< .001) |
| VE/VCO2 in AT | 33±2.2 | 30.6±3.3 | 2.5±2.3 | <.001 | 0.705 (< .001) |
| PETCO2 in AT | 34.5±4 | 36±4 | 1.5±4 | 0.128 | — |
| Maximal VE/VO2 | 42.4±6.7 | 39.8±6.6 | 2.54±4.7 | .031 | 0.746 (< .001) |
| Maximal VE, L | 72.5±19 | 59.5±14 | 13±12 | <.001 | 0.766 (< .001) |
| Maximal RR, bpm | 41 [31-45] | 33 [28-36] | — | <.001 | — |
| SpO2 at rest, % | 96 [93-97] | 96 [94-97] | — | .059 | — |
| SpO2 max, % | 88 [84-91] | 91 [86-93] | — | .006 | — |
| Maximal tidal volume (L) | 1.96±0.4 | 1.89±0.5 | .06±0.2 | 0.291 | — |
AT, anaerobic threshold; FC, heart rate; OUES, oxygen uptake efficiency slope; PETCO2, partial respiratory CO2 pressure; RER, respiratory exchange ratio (VCO2/VO2); RR, respiratory rate; SpO2max, peripheral oxygen saturation at maximal effort; VCO2, carbon dioxide production; VE, ventilation; VO2, oxygen consumption.
The values are expressed as No. (%), mean±standard deviation, or median [interquartile range].
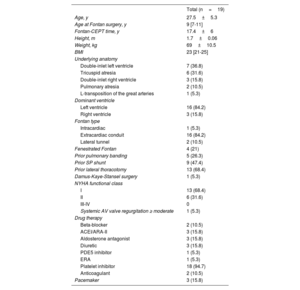
A total of 38 tests were conducted in 19 patients (mean age, 27.5±5.3 years). The mean interval between the treadmill exercise test and the cycle ergometer test was 7.6 (2-12) months. The baseline characteristics of the study cohort are shown in table 2. Differences were found between the 2 modalities, both in oxygen uptake during peak exercise (VO2peak) and related parameters, as well as in ventilatory efficiency parameters (table 1). However, there was good correlation of the main CPET parameters between the 2 tests since they measure the same parameters in the same individual.
Baseline characteristics
| Total (n=19) | |
|---|---|
| Age, y | 27.5±5.3 |
| Age at Fontan surgery, y | 9 [7-11] |
| Fontan-CEPT time, y | 17.4±6 |
| Height, m | 1.7±0.06 |
| Weight, kg | 69±10.5 |
| BMI | 23 [21-25] |
| Underlying anatomy | |
| Double-inlet left ventricle | 7 (36.8) |
| Tricuspid atresia | 6 (31.6) |
| Double-inlet right ventricle | 3 (15.8) |
| Pulmonary atresia | 2 (10.5) |
| L-transposition of the great arteries | 1 (5.3) |
| Dominant ventricle | |
| Left ventricle | 16 (84.2) |
| Right ventricle | 3 (15.8) |
| Fontan type | |
| Intracardiac | 1 (5.3) |
| Extracardiac conduit | 16 (84.2) |
| Lateral tunnel | 2 (10.5) |
| Fenestrated Fontan | 4 (21) |
| Prior pulmonary banding | 5 (26.3) |
| Prior SP shunt | 9 (47.4) |
| Prior lateral thoracotomy | 13 (68.4) |
| Damus-Kaye-Stansel surgery | 1 (5.3) |
| NYHA functional class | |
| I | 13 (68.4) |
| II | 6 (31.6) |
| III-IV | 0 |
| Systemic AV valve regurgitation ≥ moderate | 1 (5.3) |
| Drug therapy | |
| Beta-blocker | 2 (10.5) |
| ACEI/ARA-II | 3 (15.8) |
| Aldosterone antagonist | 3 (15.8) |
| Diuretic | 3 (15.8) |
| PDE5 inhibitor | 1 (5.3) |
| ERA | 1 (5.3) |
| Platelet inhibitor | 18 (94.7) |
| Anticoagulant | 2 (10.5) |
| Pacemaker | 3 (15.8) |
ARA-II, angiotensin II receptor antagonists; ERA, endothelin receptor antagonist; ACE inhibitors, angiotensin-converting enzyme inhibitors; BMI, body mass index; PDE5 inhibitor, phosphodiesterase 5 inhibitor; NYHA, New York Heart Association; CPET, cardiopulmonary exercise testing; S-P, systemic-pulmonary.
Values are expressed as No. (%), mean±standard deviation, or median [interquartile range].
Regarding respiratory pattern, both maximal ventilation and maximal respiratory rate were higher on the treadmill, with no differences in peak tidal volume (V). At maximal effort, peripheral oxygen saturation (SpO2) was lower on the treadmill. There were no differences in the maximal respiratory exchange ratio (RER).
The incremental phase on the treadmill was a mean of 6.8minutes longer than on the cycle ergometer. On the Borg scale at maximal effort, no differences were found in the level of dyspnea but higher levels of lower limb fatigue were reached on the cycle ergometer.
In our cohort, both VO2peak and oxygen pulse (O2pulse) and the oxygen uptake efficiency slope (OUES) were higher on the treadmill. This is because the use of larger muscle groups on the treadmill involves higher metabolic demand. Patients with Fontan circulation have significant cardiovascular limitations for exercise, with difficulty in increasing stroke volume and preload,1 as well as significant peripheral limitations associated with lower muscle mass and weakness of the peripheral musculature.
The difference in VO2peak between the 2 modalities in Fontan circulation (23.8%) was greater than previously described values in healthy populations (5%-10%)2 and was similar to that found in heart failure with reduced ejection fraction (16%-23%).3 Therefore, similar to patients with chronic obstructive pulmonary disease and chronic heart failure4,5, those with Fontan circulation may have more pronounces weakness of the quadriceps, leading to greater difficulty in maintaining effort on the cycle ergometer due to muscle fatigue. This accentuates the difference in VO2peak observed between the 2 modalities compared with the healthy population. The greater quadriceps weakness also explains why the duration of the incremental phase on the treadmill was more prolonged, and a higher level of lower limb fatigue was reached on the Borg scale during the cycle ergometer test.
Our data also reveal a higher ventilatory response and lower ventilatory efficiency on the treadmill. In Fontan circulation, there is poor distribution of pulmonary blood flow, which, combined with the inability to recruit alveoli during exercise, may be more pronounced on the treadmill than on the cycle ergometer due to the postural difference.
On the treadmill (in an upright position), the arrival of blood flow from the inferior vena cava to the pulmonary branches could be more compromised due to the effect of gravity than on the cycle ergometer (seated position), which accentuates the ventilation-perfusion mismatch and explains the lower ventilatory efficiency observed on the treadmill. Additionally, the arm muscles are active during exercise on the treadmill but not during the cycle ergometer test, which could be an additional source of reflex impulses to the respiratory centers.
Furthermore, a higher minute ventilation was observed at maximal effort on the treadmill, primarily due to an increase in respiratory rate with no changes in tidal volume. This type of ventilation (rapid and shallow breaths) results in a greater increase in dead space, which does not favor gas exchange.
Finally, our study does not allow us to clarify the physiopathological mechanism behind the greater desaturation on the treadmill. A possible explanation is that exercise on the treadmill exacerbates the V/Q mismatch and leads to a larger right-to-left shunt than the cycle ergometer. The limitations of this study include the lack of arterial blood gas measurements to calculate the dead space/tidal volume ratio, its retrospective nature, the small sample size, and the time elapsed between sequential tests.
In conclusion, there are significant differences between the 2 exercise modalities in patients with Fontan circulation, as there is a higher VO2peak and worse ventilatory efficiency on the treadmill. Accurate analysis of these data is of utmost importance due to their prognostic value. The observed changes between the 2 tests could be attributed to the differences between the modalities and may not imply a worsening of functional capacity. Ideally, patients should be followed up using the same exercise modality to enable proper comparisons between tests.
FUNDINGNone.
AUTHORS’ CONTRIBUTIONSR. Ladrón-Abia performed data collection and analysis and drafted the manuscript. B. Manso García, P. Cejudo Ramos and P. Gallego critically analyzed the work and drafted and revised the manuscript. M. Gaboli and M.J. Rodríguez Puras revised the manuscript.
CONFLICTS OF INTERESTNone.


