In December 2019, a cluster of cases of severe acute respiratory syndromes was first reported in Wuhan (China). A novel coronavirus was isolated and was named SARS-CoV-2.1 By April 1, 2020, the disease caused by SARS-CoV-2, known as COVID-19 (Coronavirus disease 2019), was declared a global pandemic by the World Health Organization.2
Although the main clinical manifestation of this new virus occurs in the respiratory system, other organs such as the heart can also be affected. There are several mechanisms by which SARS-CoV-2 could cause myocardial damage. The presence of angiotensin-converting enzyme-2 receptors (used by this virus to invade the pneumocyte) in cardiomyocytes could be associated with the development of myocarditis, which can cause systolic dysfunction and heart failure (HF).3 Another mechanism of cardiac damage could be the high degree of inflammatory activity. COVID-19 precipitates a cytokine storm with increased levels of interleukin (mainly 2, 7 and 10) and other proinflammatory cytokines, such as granulocyte-colony stimulating factor and tumor necrosis factor, among other mediators of the systemic and local inflammatory response. This proinflammatory storm can reduce flow to the coronary arteries, as well as destabilize coronary atherosclerosis plaques, associated with a hypercoagulable state that precipitates the microvascular thrombosis responsible for myocardial damage and the consequent elevation of troponin (Tn).4,5
In situations of hypoxemia or sustained hypotension, type 2 acute myocardial infarction may also occur. Finally, stress cardiomyopathy or tachycardias due to adrenergic discharge, either endogenous or exogenous, are other forms of myocardial damage related to this virus.6
This work was conducted to evaluate the impact on mortality, HF and on both combined of TnI elevation in COVID-19, both in patients with and without previous heart disease (HD), defined as a history of ischemic heart disease, at least moderate heart valve disease, or left ventricular dysfunction (ventricular ejection fraction <40%).
From March 10 to April 6, 2020, we included all patients with confirmed SARS-CoV-2 infection in our health area who were admitted to hospital (n=245). Of these, 33 (14.1%) required intensive critical care. A total of 27 deaths were recorded (11%), and 35 (14.3% patients) developed HF. A total of 42 patients (17.1%) had HD. Of these, 15 (35.7%) had elevated Tn compared with 13.3% of patients without HD.
Table 1 summarizes the baseline characteristics of COVID-19 patients and provides a comparison of the cohorts with normal and elevated TnI values, as well as the results of the univariate analysis for the association of death and HF for all hospitalized patients, respectively.
Baseline characteristics of the total and subgroup population and variables associated with mortality and heart failure
| Baseline characteristics of the total and subgroup population | ||||
|---|---|---|---|---|
| Total populationN=245 (100%) | Elevated troponin levelsn=42; (17.1%) | Normal troponin levelsn=203 (82.9%) | P | |
| Clinical presentation | ||||
| Days of symptoms | 6.6± 4.8 | 5.4±4.6 | 6.8±4.8 | .077 |
| Fever | 198 (80.8) | 31 (73.8) | 167(82.3) | .205 |
| SaO2 <95% | 134 (54.7) | 30 (71.4) | 104 (51.2) | .017 |
| Demographic characteristics | ||||
| Age, y | 67.6±15.7 | 77.2±10.8 | 65.6±15.9 | <.001 |
| Female sex | 99 (40.4) | 12 (28.6) | 87 (42.9) | .086 |
| Obesity | 27 (11.0) | 7 (16.7) | 20 (9.9) | .199 |
| Health worker | 12 (4.9) | 1 (2.4) | 11 (5.4) | .406 |
| Retirement home | 8 (3.3) | 3 (7.1) | 5 (2,5) | .120 |
| Dementia | 10 (4.1) | 5 (11.9) | 5 (2.5) | .005 |
| Dependency | 27 (11.0) | 12 (28.6) | 15 (7.4) | <.001 |
| Cardiovascular risk factors | ||||
| Current smoker | 7 (2.9) | 0 (0.0) | 7 (3.4) | .222 |
| Hypertension | 117 (47.8) | 27 (64.3) | 90 (44.3) | .018 |
| Diabetes mellitus | 61 (24.9) | 20 (47.6) | 41 (20.2) | <.001 |
| Dyslipidemia | 114 (46.5) | 25 (59.5) | 89 (43.8) | .064 |
| Peripheral artery disease | 20 (8.2) | 12 (28.6) | 8 (3.9) | <.001 |
| Heart disease | ||||
| Isquemic heart disease | 24 (9.8) | 9 (21.4) | 15 (7.4) | .005 |
| Left ventricular disfunction | 13 (5.3) | 8 (19.0) | 5 (2.5) | <.001 |
| Valvular disease | 12 (4.9) | 2 (4.8) | 10 (4.9) | .964 |
| Atrial fibrillation | 15 (6.1) | 7 (16.7) | 8 (3.9) | .002 |
| Pulmonary disease | ||||
| Pulmonary disease | 48 (19.6) | 7 (16.7) | 41 (20.2) | .600 |
| COPD/asthma | 31 (12.7) | 7 (16.7) | 24 (11.9) | .390 |
| OSAHS | 12 (4.9) | 0 (0.0) | 12 (5.9) | .106 |
| Other comorbidities | ||||
| Renal impairment, eGFR <30mL/min | 14 (5.7) | 9 (21.4) | 5 (2.5) | <.001 |
| Stroke/TIA | 13 (5.3) | 7 (16.7) | 6 (3.0) | <.001 |
| Neoplasia | 5 (2.0) | 4 (9.5) | 1 (2.0) | .864 |
| Hypothyroidism | 10 (4.1) | 2 (4.8) | 8 (3.9) | .807 |
| Autoimmune disease | 15 (6.1) | 2 (4.8) | 13 (6.4) | .686 |
| Laboratory test (admitted patients only) | ||||
| pO2 <60 mmHg | 176 (71.7) | 36 (85.7) | 140 (68.7) | .027 |
| pCO2 >45 mmHg | 16 (6.3) | 7 (16.7) | 9 (4.1) | .002 |
| Hemoglobin, g/dL | 13.2±1.9 | 12.3±2.6 | 13.4±1.7 | .015 |
| Leucocytes, 103/μL | 65±3.4 | 8.0±4.7 | 6.2±3.1 | .021 |
| Lymphoocytes, 102/μL | 0.9±0.8 | 0.7±1.2 | 0.9±0.7 | .099 |
| Platelets, 103/μL | 201.1±98.3 | 187.1±108.9 | 201.9±96.4 | .771 |
| Creatinine, mg/dL | 1.2±0.9 | 1.8±1.5 | 1.0±0.7 | .002 |
| D-dimer, ng/mL | 2779.8±10370.3 | 4351.5±6419.8 | 2460.6±10985.6 | .294 |
| Ferritin, ng/mL | 926.2±998.4 | 1291.8±1407.2 | 856.8±888.6 | .090 |
| C-reactive protein, mg/dL | 12.2±13.5 | 15.5±11.7 | 11.5±13.7 | .083 |
| Interleukin-6, pg/mL | 113.1±408.0 | 355.0±942.1 | 71.3±186.1 | .117 |
| Previous treatments | ||||
| Antiplatelet therapy | 36 (14.7) | 14 (33.3) | 22 (10.8) | <.001 |
| Anticoagulation | 27 (11.0) | 12 (28.6) | 15 (7.4) | <.001 |
| Beta-blockers | 37 (15.1) | 14 (33.3) | 23 (11.3) | <.001 |
| ACEI/ARB | 81 (33.1) | 20 (47.6) | 61 (30.0) | .028 |
| Corticosteroids | 20 (8.2) | 4 (9.5) | 16 (7.9) | .724 |
| Variables associated with mortality and heart failure | ||||||
|---|---|---|---|---|---|---|
| Variables | Mortality | Heart failure | ||||
| OR | 95%CI | P | OR | 95%CI | P | |
| Days of symptoms, per d | 0.91 | 0.83-1.02 | .096 | 1.06 | 0.99-1.13 | .081 |
| Fever | 0.81 | 0.31-2.14 | .671 | 0.77 | 0.32-1.82 | .552 |
| SaO2 <95% | 4.16 | 1.52-11.39 | .005 | 4.83 | 1.93-12.12 | .001 |
| Age, per y | 1.11 | 1.06-1.16 | <.001 | 1.02 | 0.99-1.04 | .196 |
| Female sex | 0.30 | 0.11-0.82 | .019 | 0.98 | 0.47-2.04 | .958 |
| Obesity | 2.02 | 0.70-5.88 | .195 | 1.05 | 0.34-3.24 | .934 |
| Health worker | - | - | - | 0.53 | 0.07-4.26 | .552 |
| Retirement home | 5.32 | 1.20-23.68 | .028 | 0.85 | 0.10-7.15 | .883 |
| Dementia | 3.77 | 0.91-15.54 | .067 | - | - | - |
| Dependency | 3.46 | 1.31-9.19 | .013 | 0.45 | 0.10-1.98 | .291 |
| Current smoker | - | - | - | 1.00 | 0.12-8.57 | 1.000 |
| Hypertension | 1.20 | 0.54-2.68 | .652 | 1.04 | 0.51-2.13 | .917 |
| Diabetes mellitus | 8.14 | 3.42-19.37 | <.001 | 1.99 | 0.94-4.25 | .073 |
| Dyslipidaemia | 1.50 | 0.67-3.36 | .321 | 1.89 | 0.91-3.91 | .088 |
| Peripheral artery disease | 7.23 | 2.63-19.86 | <.001 | 2.90 | 1.03-8.14 | .044 |
| Ischemic heart disease | 4.14 | 1.53-11.17 | .005 | 2.21 | 0.81-6.02 | .122 |
| Left ventricular dysfunction | 5.97 | 1.80-18.82 | .004 | 4.21 | 1.29-13.71 | .017 |
| Valvular disease | 4.57 | 1.28-16.34 | .020 | 3.53 | 0.93-11.47 | .066 |
| Atrial fibrillation | 4.73 | 1.48-15.08 | .009 | 3.33 | 1.07-10.42 | .038 |
| Pulmonary disease | 2.29 | 0.96-5.49 | .062 | 1.52 | 0.66-3.50 | .327 |
| COPD/asthma | 2.21 | 0.81-5.99 | .120 | 1.94 | 0.76-4.91 | .164 |
| OSAHS | 2.90 | 0.73-11.46 | .128 | 1.21 | 0.25-5.78 | .809 |
| eGFR <30 mL/min | 7.50 | 2.38-23.68 | .001 | 1.70 | 0.45-6.41 | .436 |
| Stroke/TIA (prior) | 4.04 | 1.15-14.15 | .029 | 0.49 | 0.06-3.85 | .494 |
| Cancer (prior) | 2.06 | 0.22-19.11 | .526 | 4.18 | 0.67-25.98 | .125 |
| Hypothyroidism | 0.89 | 0.11-7.34 | .916 | 2.72 | 0.67-11.06 | .162 |
| Autoimmune disease | - | - | - | 2.33 | 0.70-7.79 | .168 |
| pO2 <60 mmHg | 3.34 | 0.97-14.52 | .056 | 2.09 | 0.83-5.29 | .120 |
| pCO2> 45 mmHg | 0.56 | 0.07-4.47 | .586 | 11.31 | 3.72-34.34 | <.001 |
| Hemoglobin, per 1 g/dL | 0.69 | 0.56-0.84 | <.001 | 0.92 | 0.76-1.11 | .366 |
| Leukocytes, per 1000 | 1.23 | 1.11-1.36 | <.001 | 1.11 | 1.01-1.21 | .027 |
| Lymphocytes, per 100 | 0.90 | 0.51-1.61 | .728 | 0.09 | 0.03-0.31 | <.001 |
| Platelets, per 100 000 | 1.20 | 0.84-1.72 | .315 | 1.19 | 0.85-1.65 | .307 |
| Creatinine, per 1 g/dL | 1.64 | 1.14-2.34 | .007 | 1.51 | 1.08-2.10 | .016 |
| D-dimer, per 100 units | 1.01 | 1.00-1.01 | .049 | 1.00 | 0.99-1.00 | .770 |
| Ferritin, per 100 units | 1.02 | 0.98-1.06 | .473 | 1.05 | 1.02-1.09 | .002 |
| CRP, per unit | 1.02 | 0.99-1.05 | .068 | 1.05 | 1.02-1.08 | .003 |
| Interleukine-6, per unit | 1.00 | 1.00-1.01 | .358 | 1.01 | 1.00-1.01 | .018 |
| Antiplatelet therapy | 1.37 | 0.48-3.89 | .553 | 0.96 | 0.34-2.67 | .941 |
| Anticoagulation | 10.83 | 4.30-27.24 | <.001 | 5.56 | 2.31-13.56 | <.001 |
| ACEI/ARBs | 1.22 | 0.53-2.79 | .642 | 1.23 | 0.59-2.60 | .580 |
| Beta-blockers | 5.08 | 2.13-12.12 | <.001 | 2.71 | 1.17-6.26 | .020 |
| Corticosteroids | 0.40 | 0.05-3.13 | .385 | 1.06 | 0.30-3.84 | .924 |
ACEI, angiotensin-converting enzyme inhibitors; ARB, angiotensin receptor blocker; COPD, chronic obstructive pulmonary disease; CRP, C reactive protein; eGFR, estimated glomerular filtration rate; OSAHS, obstructive sleep apnea-hypopnea syndrome; pO2, partial pressure of oxygen; SaO2, oxygen saturation; TIA, transient ischemic attack.
Unless otherwise indicated, the data are expressed as No. (%) or mean±standard deviation.
Multivariate analyses were adjusted by those variables with a P <.05 value in the univariate analysis:
• Adjustment for mortality by age, sex, SaO2 <95%, retirement home, dependency, diabetes mellitus peripheral artery disease, heart disease, atrial fibrillation prior stroke, chronic kidney disease, hemoglobin leukocytes, creatinine, D-dimer, anticoagulation, B-blockers.
• Adjustment for heart failure by: SaO2 <95%, peripheral artery disease, ventricular dysfunction, atrial fibrillation, hypercapnia, leukocytes, lymphocytes, creatinine, ferritin, CRP, interleukine-6, anticoagulation, B-blockers.
• Adjustment for the combined of death and heart failure for: age, sex, SaO2 <95%, retirement home, dependency, diabetes mellitus, peripheral artery disease, heart disease, atrial fibrillation, prior stroke/TIA, hypercapnia, hemoglobin, leukocytes, lymphocytes, creatinine, D-dimer, ferritin, CRP, IL-6, anticoagulation, beta-blockers.
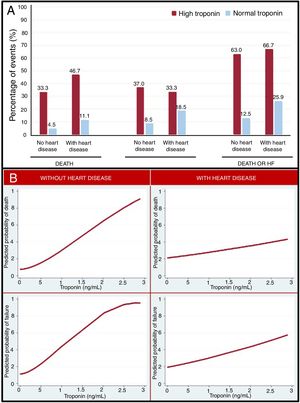
Figure 1A represents the clinical complications observed in patients with high or normal TnI, based on the prior presence of HD. In all groups, TnI elevation identified a group of patients with a worse prognosis, but the rate of events in patients with elevated TnI compared with those with normal TnI was higher in patients without HD than in those with HD.

In the adjusted and nonadjusted analyses of the association between TnI and the clinical complications observed during hospitalization, TnI elevation was associated with higher mortality (odds ratio [OR], 334; 95% confidence interval [95%CI], 4.91-2285.10; P=.025), but not with a higher risk of developing HF (OR, 3.12; 95%CI, 0.72-13.63; P=.130). The combined outcome of mortality and HF was more frequent (OR, 5.58; 95%CI, 1.24-25-12, P=.025) in the group with elevated TnI.
On multivariate analysis of the association between TnI and clinical complications, both in patients with and without previous HD, TnI elevation was related to higher mortality (OR, 4.93; 95%CI, 1.24-19.52; P=.023), HF (OR, 4.28; 95%CI, 1.30-14.07; P=.017), and with the combined outcome of mortality or HF (OR, 7.09; 95%CI, 2.28-22.03; P=.001) in patients without HD, but not in patients with previous HD (P=.561, P=.337 and P=.992, respectively).
Figure 1B describes the relationship between TnI and the predicted probability of death or HF. As Tn rose, there was an increase in the risk of developing adverse outcomes. This relationship was more robust in patients without previous HD.
Tn elevation in patients without HD could indicate more severe infection and respiratory distress, which could determine the prognosis of COVID-19. In contrast, in patients with previous HD, Tn elevation may not only be related to the infectious process, but also to their underlying disease, so that, by itself, it does not identify the severity of COVID-19.
These findings could have relevant clinical implications. Tn elevation allows easy and rapid identification of a group of patients with a worse prognosis. This predictive power of risk of death or HF was particularly significant in patients without previous HD. Based on these results, TnI determination should be routinely included in patients hospitalized for COVID-19.