Iron overload cardiomyopathy is common in low-risk myelodysplastic syndrome (MDS) patients requiring repeat red blood cell (RBC) transfusions. Early diagnosis is essential to establish an effective treatment with iron chelators and improve their survival,1 and the detection of myocardial iron overload (MIO) modifies its strategy by intensifying the therapy.
T2* by cardiac magnetic resonance (cMR) is the gold standard for MIO diagnosis. Recently, small studies carried out in thalassemia mayor (TM) suggest the usefulness of new imaging techniques such as T1 mapping being reduced in individuals with MIO.2,3
We performed a prospective observational study to analyze the usefulness of T1 and T2 mapping in the assessment of transfusion-dependent low-risk MDS patients (including very low, low and intermediate risk groups from the Revised-International Prognostic Scoring System classification [IPSS-R]), older than 18 years, who provided their authorization by signing informed consent. Exclusion criteria were those patients belonging to very high or high-risk MDS groups according to IPSS-R classification and those who had never received transfusions. The study was approved by the local ethics committee.
Thirty-one low-risk MDS patients were recruited between January 2016 and February 2017 (table 1). Patients underwent a 1.5-Tesla cMR (Philips Healthcare, Netherlands) including cardiac morphology and function assessment, late gadolinium enhancement, myocardial and hepatic T2* mapping (multiecho-gradient sequences including 15 echo times from 1-16 milliseconds), native T1 (modified look locker inversion recovery -MOLLI-with-5(3)3 acquisition scheme) and T2 (multi-echo gradient-spin-echo sequence) mapping according to recommendations.4 Mapping postprocessing was performed using Medis 2.1 software, plotting the ROI or “region-of-interest” in the left ventricle mid-septum segment in short axis.
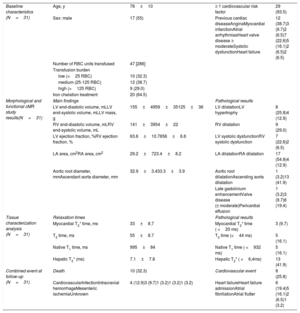
Baseline characteristics, main results of the cardiac magnetic resonance assessment and evolution.
| Baseline characteristics (N=31) | Age, y | 76±10 | ≥ 1 cardiovascular risk factor | 29 (93.5) |
| Sex: male | 17 (55) | Previous cardiac diseaseAnginaMyocardial infarctionAtrial arrhythmiasHeart valve disease ≥ moderateSystolic dysfunctionHeart failure | 12 (38.7)3 (9.7)2 (6.5)7 (22.6)5 (16.1)2 (6.5)2 (6.5) | |
| Number of RBC units transfused | 47 [286] | |||
| Transfusion burden | ||||
| low (<25 RBC) | 10 (32.3) | |||
| medium (25-125 RBC) | 12 (38.7) | |||
| high (>125 RBC) | 9 (29.0) | |||
| Iron chelation treatment | 20 (64.5) | |||
| Morphological and functional cMR study results(N=31) | Main findings | Pathological results | ||
| LV end-diastolic volume, mLLV end-systolic volume, mLLV mass, g | 155±4959±35125±36 | LV dilatationLV hypertrophy | 8 (25.8)4 (12.9) | |
| RV end-diastolic volume, mLRV end-systolic volume, mL | 141±3954±22 | RV dilatation | 9 (29.0) | |
| LV ejection fraction, %RV ejection fraction, % | 63.6±10.7656±6.6 | LV systolic dysfunctionRV systolic dysfunction | 7 (22.6)2 (6.5) | |
| LA area, cm2RA area, cm2 | 29.2±723.4±8.2 | LA dilatationRA dilatation | 17 (54.8)4 (12.9) | |
| Aortic root diameter, mmAscendant aorta diameter, mm | 32.9±3.433.3±3.9 | Aortic root dilatationAscending aorta dilatation | 1 (3.2)13 (41.9) | |
| Late gadolinium enhancementValve disease (≥ moderate)Pericardial effusion | 1 (3.2)3 (9.7)6 (19.4) | |||
| Tissue characterization analysis (N=31) | Relaxation times | Pathological results | ||
| Myocardial T2* time, ms | 33±8.7 | Myocardial T2* time ( <20 ms) | 3 (9.7) | |
| T2 time, ms | 55±8.7 | T2 time (<44 ms) | 5 (16.1) | |
| Native T1 time, ms | 995±84 | Native T1 time ( <932 ms) | 5 (16.1) | |
| Hepatic T2* (ms) | 7.1±7.8 | Hepatic T2* ( <6,4ms) | 13 (41.9) | |
| Combined event at follow-up (N=31) | Death | 10 (32.3) | Cardiovascular event | 8 (25.8) |
| CardiovascularInfectionIntracranial hemorrhageMesenteric ischemiaUnknown | 4 (12.9)3 (9.7)1 (3.2)1 (3.2)1 (3.2) | Heart failureHeart failure admissionAtrial fibrillationAtrial flutter | 6 (19.4)5 (16.1)2 (6.5)1 (3.2) | |
cMR, cardiac magnetic resonance; LA, left atria; LV, left ventricle; RA, right atria; RBC, red blood cells; RV, right ventricle.
Data are expressed as No. (%) or mean±standard deviation.
Measures and pathological results according to established normal values4 and for T1 and T2 mapping those extracted from a cohort of 292 healthy controls performed using the same local technique (native T1 993±62ms, T2 52±8ms).
cMR study revealed a high prevalence of unknown structural heart disease (51.6%) (table 1) and up to 16.1% of patients showed pathological reduction in relaxation times (table 1).
We studied the T1 and T2 mapping correlation with iron overload parameters (transfusion burden, biochemical parameters, and hepatic and myocardial T2*).
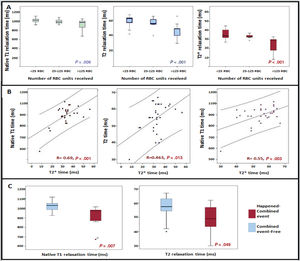
T2*, T1 and T2 times were significantly reduced as the RBC transfusion burden increased (figure 1A). We found a 65 RCB received cutoff to detect a pathological reduction of T1 (< 932ms) (area under the curve 0.762, sensitivity 80%, specificity 66%).

Myocardial T1, T2 and T2* mapping results in low-risk myelodysplastic syndrome patients. A: relationship between T1, T2 and T2* times with the RBC transfused. B: correlation between T1, T2 and T2* times. C: association between T1 and T2 times and the combined event: mortality from any cause and/or cardiovascular event. RBC, red blood cell.
T2*, T1 and T2 times were also significantly reduced as the serum ferritin levels increased (T2* R=-0.533, P=.001; T1 R=-0.501, P <.001; T2 R=-0.36, P=.039).
T1 and T2 times showed a positive correlation with the values of the gold standard myocardial T2* (figure 2 B). In addition, T1 and T2 times showed a statistically significant positive correlation. Patients with MIO defined by T2* (< 20ms) showed significantly lower values of T2 (42 vs 56ms, P=.014) and T1 (803 vs 1012ms; P <.001) compared with patients with normal T2*. In contrast, T1 and T2 mapping did not correlate with liver T2*.
We analyzed the association of T1 and T2 mapping with the combined event: mortality from any cause and/or cardiovascular event (newly diagnosed HF, atrial or ventricular arrhythmia) during follow-up.
After a median of 2.4 [0.7] years, 10 (32.3%) patients had the combined event (table 1). A total of 19.4% of patients developed both cardiovascular event and later death.
All patients with a T2* <20ms at the inclusion (3 patients; 9.7%) had the combined event at follow-up compared with those with normal T2* (100% vs 76%; P=.023). Patients who had the combined event had significantly lower native T1 (974 [131] vs 1029 [66]; P=.007), T2 (49 [16] vs 58 [9]; P=.049) and T2 (30 [15] vs 33 [5]; P=.047) times than those with an event-free course (figure 1C).
To the best our knowledge, this is the first study in MDS patients that analyzes cMR tissue characterization techniques other than T2*.
Our results highlight the relationship between T1 and T2 maps and MIO defined by T2*, the transfusion burden, and ferritin levels. The highest proportion of patients with pathological reduction of T1 compared with reduced T2* in our population suggests that T1 could be affected earlier than T2* in the presence of MIO, similar to TM reports.5 T1 and T2 mapping reduction probably suggests incipient iron deposition in patients with normal T2* and absence of other heart disease. The correlation observed between T1 and the gold standard T2* is stronger than in the case of T2. Moreover, the 65 RCB cutoff observed to detect pathological reduction of T1 is lower than the classic 100 RCB for MIO risk. This could play a role in the early detection of iron overload cardiomyopathy, leading to optimize the iron chelating treatment that would modify the course of the disease.
Regarding the prognostic usefulness of parametric techniques, our study in the MDS population corroborates the relationship of pathological myocardial T2* to the development of adverse events similar to TM patients. Regarding native T1 and T2, we suggest for the first time its relationship to adverse events in a hematological disease with transfusion dependence. Advanced age, comorbidities, and cardiac remodeling secondary to chronic anemia probably contribute to the high prevalence of previously undiagnosed structural heart disease and the high incidence of cardiovascular events observed in our population.
As other limitations, this is a single-center observational study, with a small number of patients and short-term follow-up.
In conclusion, myocardial tissue characterization with T1 and T2 mapping in patients with transfusion-dependent low-risk MDS is significantly related to transfusion burden, ferritin levels, and myocardial T2*. Patients who develop the combined cardiovascular event and/or death from any cause in the follow-up more frequently exhibit myocardial T2* below 20ms and lower values of myocardial native T1 and T2. T1 seems to be affected earlier than T2* and to provide prognostic usefulness, and is probably a marker for early chelation therapy in this population.
FUNDINGThis work was funded by a Gerencia Regional de Salud de Castilla y León grant (GRS1203/A/15), and a Río Hortega contract (CM19/00055) supported by the Instituto de Salud Carlos III in Spain (Co-funded by European Social Fund “Investing in your future”).
CONFLICTS OF INTERESTA. Martín-García reports personal fees from Daichii Sankyo, personal fees from Bayer, personal fees from Pfizer, personal fees from Novartis, and nonfinancial support from MSD, outside the submitted work. M. Díez-Campelo reports grants and other support from NOVARTIS, during the conduct of the study, as well as grants from CELGENE and from TAKEDA, outside the submitted work.
The authors appreciate the selfless participation of all patients included in the study.