Keywords
INTRODUCTION
In ST-segment elevation myocardial infarction (STEMI), the timely re-establishment of blood flow in the infarct related artery via primary percutaneous coronary intervention (pPCI) is crucial. However, in spite of Thrombolysis in Myocardial Infarction (TIMI) flow grade 3 in the epicardial coronary artery, perfusion at tissue level may be impaired; a phenomenon referred to as microvascular obstruction (MVO). Cardiovascular magnetic resonance (CMR) allows for a comprehensive assessment of STEMI patients1 with accurate detection of MVO.2,3
Several studies have shown that the presence of MVO is associated with adverse outcome, unfavourable left ventricular remodelling and higher mortality.4-6
Monitoring of ST-segment changes, especially ST-segment resolution (STR), has been employed in the past as a simple measure of epicardial reperfusion quality in STEMI.7 Furthermore, STR has been used as a surrogate end-point for MVO in the past7,8 but the value of STR for detecting CMR-derived MVO is conflicting9,10,11 and the relationship between ST-segment changes and MVO remains to be clarified.
We analyzed the usefulness of STR and the extent of the sum of ST-segment elevation (sumSTE) for detecting CMR-derived MVO in a consecutive group of patients with STEMI treated with pPCI and re-established TIMI flow grade 3 in the infarct related artery.
METHODS
Patients
We prospectively included 100 consecutive patients admitted to a university hospital for a first STEMI treated with pPCI within 12 hours after the onset of chest pain. The inclusion criteria were: a) stable clinical course without complications during hospitalization; b) no contraindications to CMR; and c) TIMI flow grade 3 in the infarct related artery after revascularization. We excluded 4 patients because of claustrophobia and 7 patients due to TIMI flow grade ≤2 after pPCI. Patients with inconclusive ECG (bundle branch block or ventricular pacing) were excluded (4 cases). Therefore, the final study group comprised 85 patients. All patients gave written informed consent and the study protocol was approved by the local ethics committee.
Percutaneous Coronary Intervention and Angiography
pPCI was performed within 12 hours of symptom onset in all patients. TIMI flow grade12 before and after the procedure was assessed. Myocardial blush grade13 was evaluated after pPCI. Angiographic data was analyzed by an experienced investigator unaware of patient identity, ECG and CMR results using standard software (HM3000, Philipps, Best, The Netherlands).
ECG Analysis
A standard 12 lead ECG was recorded upon admission and at 90 minutes, 6 hours, 24 hours, 48 hours, and 96 hours after pPCI at a paper speed of 25 mm/s and an amplification of 10 mm/mV. ECG data was evaluated by an observer unaware of patient identity, angiographic data and CMR results. The isoelectric line was defined as the level of the preceding TP-segment. Extent of ST-segment elevation was measured 20 ms after the J-point in every lead. The following ECG parameters were determined:
- Sum of ST-segment elevation (sumSTE): sumSTE was manually calculated as the sum of ST-segment elevation in all leads using previously validated algorithms as the sum of elevation in V1-6, I, and aVL for anterior infarction and as the sum of elevation in leads II, III, aVF, V5, and V6 for non-anterior infarction.7,14,15 For dichotomic univariate analysis of sumSTE we implemented cut-off values established on the basis of the area under the receiver operating characteristics curves (AUC) for predicting MVO by maximizing the observed overall diagnostic accuracy (minimizing the number of false positives plus the number of false negatives).
- ST-segment resolution: STR was defined as the percent reduction in the sumSTE obtained on admission and each time point following pPCI. Complete STR was considered for a reduction of ≥70%.7,15
Cardiovascular Magnetic Resonance Imaging
CMR (1.5-T scanner, Sonata Magnetom, Siemens, Erlangen, Germany) was performed at least 48 hours after cardiac catheterization in accordance with our laboratory protocol.16,17 Images were acquired by a phased-array body surface coil during breath-holds and were ECG-triggered. Cine images (steady-state free precession sequence; repetition time / echo time: 3.2/1.6 ms, flip angle: 61 degrees, matrix: 256x128, slice thickness: 6 mm, temporal resolution: 26 ms) were acquired in 2-, 3-, 4-chamber views and every 1 cm in short-axis views.
Late enhancement imaging was performed in the same projections used for cine images at least 10 minutes after administering 0.1 mmol/kg of gadolinium-diethylenetriaminepentaacetic acid (Magnograf, Juste S.A.Q.F., Madrid, Spain). A segmented inversion recovery imaging with steady state free precession sequence was used (repetition time / echo time: 2.5/1.1 ms, slice thickness: 6 mm, flip angle: 50 degrees, matrix: 195x192) nullifying myocardial signal.
Cardiovascular Magnetic Resonance Imaging Data analysis
CMR studies were analyzed by an experienced observer blinded to all patient, angiographic and ECG data using customized software (QMASS MR 6.1.5, Medis, Leiden, The Netherlands). Segment location was defined according to the 17-segment model18. Left ventricular mass (g/m2), ejection fraction (%), and volumes (mL/m2) were quantified by manual definition of endocardial borders of all short-axis slices in cine-images. Late gadolinium enhancement was considered in the case of signal intensity >2 standard deviations with respect to a remote non-infarcted area in late gadolinium enhancement imaging.16,19 Infarct size was calculated as the percentage of left ventricular mass showing late gadolinium enhancement.17
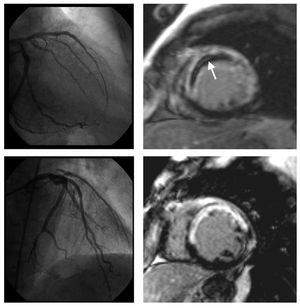
Microvascular obstruction: on a segmental basis MVO was visually defined in late enhancement imaging as a lack of contrast uptake in the core of a segment surrounded by tissue showing late enhancement 2 (Figure 1). On a patient basis, significant microvascular obstruction was considered if it was detected in at least 1 segment. Intraobserver variability for the detection of MVO using this criterion in our laboratory was 1%.

Figure 1. Coronary angiography and late gadolinium enhancement cardiovascular magnetic resonance imaging of two patients with an anterior myocardial infarction. After primary percutaneous intervention, TIMI flow grade 3 was established in the left anterior descending artery (left upper and lower panel). In one patient, on cardiovascular magnetic resonance imaging (right upper panel), late enhancement sequences show a large area of transmural necrosis along the anteroseptal wall with a lack of contrast arrival in the core of the infarcted area (arrow). While infarct size was comparable, no evidence of microvascular obstruction was present in the other patient (right lower panel).
Statistical Analysis
All data were tested for normal distribution using the one-sample Kolmogorov-Smirnov test. Continuous normally distributed data were expressed as the mean (standard deviation) and compared using Student's t test. Non-parametric data were expressed as the median with the interquartile range (IQR) and were compared with the Mann-Whitney U test. Group percentages were compared using the χ2 test or Fisher's exact test where appropriate.
Receiver operating characteristic curve analysis for predicting MVO was performed for STR and sumSTE at all time points. The areas under the receiver operating characteristic curve were compared.
In order to determine the predictive value of sumSTE and STR, a logistic regression model was applied, adjusted by variables showing a P-value <.1 in univariate analyses (Table 1). These variables were: systolic blood pressure, anterior infarction and peak creatine kinase MB. Odds ratios with the respective 95% confidence intervals were computed.

Statistical significance was considered for 2-tailed P-value <.05. SPSS 13.0 (SPSS Inc, Chicago, Illinois, USA) and STATA 9.0 (StataCorp, College Station, Texas, USA) were used.
RESULTS
The baseline characteristics and angiographic data of all patients are displayed in Table 1. The mean age was 60 (13) years (range, 31-90) with the majority of the patients being male (81%). Median time from pain onset to revascularization was 210 minutes [141-420]. Abnormal TIMI flow grade (0-2) was present in 87% prior to pPCI with an occluded infarct related artery in 78% of the cases. A stent was placed in 96% of patients and TIMI flow grade 3 in the infarct related artery was established in all cases. Myocardial blush grade 2-3 was observed in 77% after pPCI.
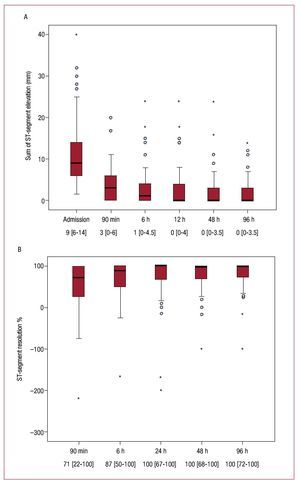
The evolution of sumSTE and STR over time in the entire patient population is displayed in Figure 2. The median sumSTE on arrival was 9.0 mm [6.0-14.0] and dropped to 3.0 mm [0.0-6.0] after pPCI (Figure 2A). Accordingly, the median STR at 90 min after pPCI was 71% [22-100] (Figure 2B). Both indexes showed a progressive normalization over time. The percentage of patients displaying complete STR (≥70%) steadily increased over time (53% at 90 min, 67% at 6h, 73% at 24h, 74% at 48h, and 77% at 96h).

Figure 2. A: sum of ST-segment elevation (mm).B: extent ST-segment resolution (%) on admission and after revascularization in the entire group of patients. Data at the bottom of the graphs indicate the median with the interquartile range.
Cardiovascular Magnetic Resonance Imaging Results
CMR imaging was performed 6 (2) days after pPCI. The clinical course between both examinations was stable in all patients. MVO was present in 37 patients (44%). Clinical and angiographic characteristics of the patients with and without evidence of MVO on CMR imaging are displayed in Table 1.
Patients with MVO-infarctions were younger (56 [14] years vs 63 [12]; P=.02), had more anterior infarctions (68% vs 33%; P=.002), a larger median peak creatine kinase MB 334 [162-503] ng/mL vs 85 [44-197]; P<.0001) and there was a trend towards a lower systolic blood pressure (119 [26] mmHg vs 130 [25]; P=.05).
On CMR imaging, patients with MVO-infarctions showed a larger infarct size (37 [23%] vs 11 [9]; P<.0001), a lower left ventricular ejection fraction (44 [13%] vs 59 [12]; P<.0001) and larger endsystolic (54 [31] mL/m2 vs 29 [14]; P<.0001) and end-diastolic (93 [33] mL/m2 vs 70 [18]; P<.0001) left ventricular volumes and mass (81 [19] g/m2 vs 65 [15]; P<.0001).
Relationship of SumSTE and STR With Microvascular Obstruction
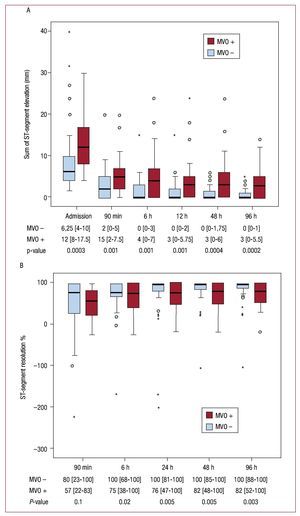
In MVO-infarctions, the extent of sumSTE was significantly larger before and at all time points after revascularization compared to non-MVO-infarctions (P≤.001 at all time points). In patients with MVO-infarctions, the median sumSTE at 24 hours after revascularisation smoothly reached 3 mm and did not drop further during the following measurements. In patients without MVO the median sumSTE at 6 hours reached 0 mm (Figure 3A). The amount of STR did not differ significantly at 90 min after pPCI between MVO and non-MVO infarctions (P=.1). In the following measurements patients with non-MVO infarctions had a significant larger amount of STR than did patients with MVO infarctions (P≤.02 from 6 h to 96 h) (Figure 3B).

Figure 3. A: time course of the sum of ST-segment elevation (mm). B: ST-segment resolution (%) according to the presence of microvascular obstruction on cardiovascular magnetic resonance imaging. The sum of ST-segment elevation was significantly higher at all time points in patients with microvascular obstruction (MVO) compared to patients without MVO. For ST-segment resolution there was no statistically significant difference at the first measurement after revascularization between the 2 groups. During the following measurements patients without MVO displayed a significant larger amount of STR. Data at the bottom of the graphs indicate the median with the interquartile range and the P-value for comparison of patients with and without MVO.
Table 2 shows the areas under the receiver operating characteristic curve of sumSTE and STR at all time points for predicting MVO. SumSTE yielded a significantly larger area under the curve at every measurement compared to the corresponding STR at that time point.

Since STR is habitually dichotomized according to complete (≥70%) versus incomplete (<70%) the following analyses were carried out: When dichotomized according to complete STR (≥70% vs <70%) there was no significant difference in the prevalence of MVO between the 2 groups at 90 minutes (36% vs 52%; P=.1). Only from 24 hours after revascularization onwards, patients with complete STR displayed a significantly lower prevalence of MVO (Table 3).

According to the best cut-off derived from the area under the receiver operating characteristic curve, sumSTE at 90 minutes after pPCI was dichotomized (sumSTE ≤3 vs sumSTE >3 mm). Patients with sumSTE >3 mm had a higher prevalence of MVO than patients with sumSTE ≤3 (63% vs 28%; P=.001). The diagnostic accuracy of sumSTE >3 and complete STR (≥70%) at 90 minutes after pPCI is displayed in Table 4. SumSTE >3 mm yielded a higher diagnostic accuracy for predicting MVO than STR≥70%.

Multivariable Analysis
A multivariate logistic regression model for predicting MVO at 90 minutes after pPCI, adjusted for those variables showing a P-value <.1 in the univariate analyses, was performed. The variables included were: age, diabetes, smoker, systolic blood pressure, anterior infarction, median peak creatine kinase MB, involvement of the proximal left anterior descending artery, sumSTE >3 mm at 90 min and STR ≥70% at 90 min. Anterior infarction (OR, 4.2; 95% CI, 1.8-11.2; P=.04) and sumSTE >3 mm at 90 min after pPCI (OR, 3.1; 95% CI, 1.2-8.4; P=.02) were the only parameters associated with the presence of MVO on CMR imaging.
DISCUSSION
The main finding of the present study is that monitoring of ST-segment characteristics is useful for predicting MVO in patients with STEMI treated with pPCI and re-established TIMI flow grade 3 in the infarct related artery. The amount of SumSTE at 90 min after pPCI was shown to be a simple predictor of MVO even after adjustment for baseline characteristics and angiographic data.
Microvascular Obstruction
In spite of restoration of epicardial blood flow in STEMI, impairment at the microvascular level can occur, a phenomenon referred to as MVO.20,21 It has been demonstrated that patients with MVO-infarctions have poor recovery of left ventricular function and are at high risk for development of heart failure and death.20 Several non-invasive and invasive indexes such as angiographic parameters,9,10 myocardial contrast echocardiography,20,22 or scintigraphy23 have been used for the evaluation of MVO.
CMR has become the gold standard in cardiovascular imaging and allows for a comprehensive assessment of a wide range of parameters in patients with STEMI,1 including infarct size and MVO.2,3 The presence of MVO on CMR imaging has been shown to predict less functional recovery24 and post infarction complications independent of infarct size.21
ST-Segment Analysis for Assessing Microvascular Perfusion. Role of ST-Segment Resolution
The ECG, as a widely available, rapid and simple method, has been applied as a tool for assessing the success of reperfusion after thrombolysis.25 STR is useful for predicting the patency of the infarct related artery and thus epicardial reperfusion but its relationship to perfusion on the microcirculatory level remains unclear. Several studies investigating microvascular perfusion assessed by myocardial contrast echocardiography or angiographic blush scores have shown that a lack of STR is indicative of MVO.13,14,26
So far, the relationship between STR and CMR-derived MVO has been barely explored in STEMI patients with a patent infarct related artery after pPCI and existing data on the association of CMR-derived MVO with STR is conflicting.9,10,11
Two studies in the past reported no significant relationship with STR and CMR-derived MVO.9,10 While in another study CMR-derived MVO analyzed in first pass perfusion and late enhancement was related to incomplete STR, defined as ≥70%.11
In our series of patients, there was not a significant association of STR with MVO at 90 min after pPCI neither as a continuous nor as a binary variable. Nevertheless, in the following measurements patients with MVO-infarctions displayed a significant lower amount of STR that did patients without MVO-infarctions. Accordingly, after 24 hours after revascularization and onwards, patients with complete STR (≥70%) had a significantly lower prevalence of MVO.
Sum of ST-Segment Elevation and Microvascular Obstruction
In the present study, SumSTE was significantly larger throughout all measurements in patients with MVO-infarctions. When dichotomized (>3 mm vs ≤3 mm) sumSTE at 90 minutes after pPCI yielded a higher diagnostic accuracy for detecting MVO than complete STR and accordingly MVO was more frequent in patients displaying a high sumSTE (>3 mm)(63% vs 28%; P=.001). In a multivariate analysis adjusted for clinical and angiographic parameters, the presence of an elevated sumSTE (>3 mm) at 90 minutes after revascularization was an independent predictor of MVO. Of note, sumSTE on admission yielded the largest AUC for predicting MVO. The exact implications of this finding remain to be determined.
STR highly depends on pre-procedural extent of sumSTE.27 As a relative measure, STR reflects resolution of the initial sumSTE not taking into account the absolute extent of sumSTE neither on admission nor after pPCI, thus not incorporating the remaining microvascular injury after revascularization. At the first measurement after revascularization we did not detect a significant association of STR with MVO neither as a continuous variable nor as a binary variable using a well established cut-off (≥70% vs <70%). Nevertheless at 24 hours after revascularization the association of STR with MVO reached statistical significance. The lower discriminative value of STR might be owed to several reasons. For example, a patient who displays complete STR might still have a significant amount of sumSTE after pPCI and thus have a higher probability of MVO. Of note and of implications for clinical practice is, that sumSTE constitutes a simple index that yields a better diagnostic accuracy and can be obtained with one single measurement compared with 2 measurements (on arrival and at a later time point) necessary in order to determine STR for predicting MVO. Moreover, the information on the status of the microcirculation after pPCI offered by sumSTE is already available at an early time point (90 minutes after revascularization) when this information is most appreciated by the clinician.
It has been demonstrated that myocardial microcirculation displays a dynamic behaviour within the first days and months after STEMI.16 These dynamic changes in abnormal perfusion are likely reflected by the smooth normalization in the extent of sumSTE observed in our study, advocating the ECG as a non-invasive tool for assessing the status of the microcirculation in the first phase after STEMI. This observation highlights the value of serial electrocardiographic examinations after STEMI since the behaviour of the microcirculation, mirrored by ST-segment changes, displays marked differences between patients with MVO and without MVO.
Limitations and Strengths of the Study
The results of our study have to be interpreted with caution because of the small sample size. Nevertheless, CMR is a highly reproducible modality with a very low interobserver and intraobserver variability accounting for a smaller number of patients necessary to detect significant differences. Since CMR data were evaluated by one experienced observer, interobserver variability for the CMR indexes is not available.
Of note, myocardial blush grade was not significantly associated with the presence of CMR-derived MVO. The focus of the present study was to investigate the association of ST-segment changes with MVO. A possible explanation for the finding that myocardial blush grade was not associated with MVO might be that this variable is more operator-dependent and might have yielded better results if evaluated in a core laboratory.
CONCLUSIONS
Our study demonstrates the value of ST-segment monitoring for prediction of CMR-derived MVO. MVO was best predicted by the extent of sumSTE. Therefore, the assessment of ST-segment changes should not only involve the evaluation of STR after pPCI but should also focus on the remaining sumSTE. This simple bedside measure provides information on the quality of microvascular reperfusion after pPCI.
ABBREVIATIONS
CMR: cardiovascular magnetic resonance
MVO: microvascular obstruction
pPCI: primary percutaneous intervention
STEMI: ST-segment elevation myocardial infarction
STR: ST-segment elevation resolution
sumSTE: sum of ST-segment elevation
SEE ARTICLE ON PAGES 1120-2
This study was funded by Carlos III Health Insitute (Grant HERACLES and PI08128).
Correspondence: Dr. V. Bodi.
Departamento de Cardiología. Hospital Clinico y Universitario, INCLIVA, Universidad de Valencia.
Blasco Ibanez, 17. 46010 Valencia. Spain.
E-mail: vicentbodi@hotmail.com
Received March 15, 2009.
Accepted for publication May 13, 2010.