Controlling childhood obesity is a global health priority.1 Obesity is associated with comorbidity in childhood and, if it persists, leads to a higher risk for diseases in adulthood.2 According to the Spanish National Health Survey, the prevalence of obesity in the 2- to 17-year-old population age group increased from 8.4% in 1993 to 10.5% in 2011.3 The factors most widely studied by researchers to explain the high incidence of childhood obesity are energy balance, food intake, physical activity, and sedentary behavior.4
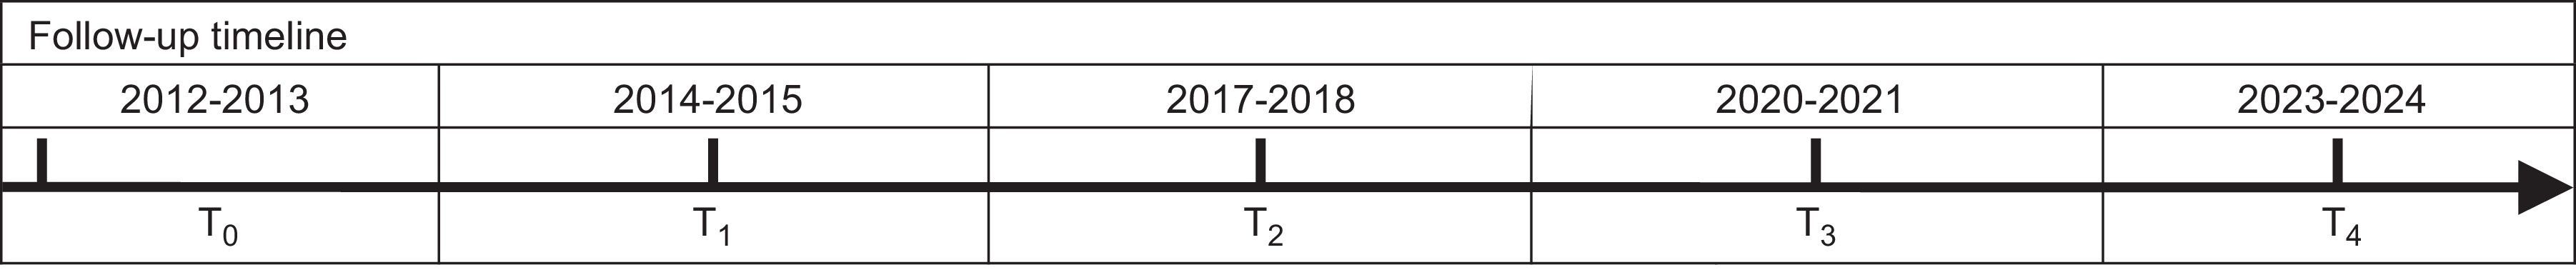
The Longitudinal Childhood Obesity Study (ELOIN) is a prospective, population cohort study that started in 2012 and aims to describe variations in overweight and obesity, determine the association of overweight and obesity with sociodemographic and lifestyle factors, and estimate their impact on health. This dynamic cohort and the baseline sample are composed of children aged 4 years. Follow-up measurements are being recorded at ages 6, 9, 12, and 14 years. The target population is children born between 15 January 2008 and 30 November 2009, living in the Madrid Autonomous Community, and under the care of one of the 31 pediatricians in the Madrid Sentinel Primary Care Physician Network. The study design has already been described in the literature.5 We collected data for the baseline sample in 2 consecutive steps: at a physical examination performed by the pediatrician at the health center, followed by a structured computer-assisted telephone interview with the person in charge of the child's nutrition.
We sent a letter to the children's families to explain the study aims and obtained the families’ written informed consent. The study protocol was approved by the Ethics Committee of Hospital Ramón y Cajal, Madrid.
Table 1 shows the study variables and procedures. At the physical examination, 2 standard measurements were taken of the child's weight, height, waist circumference, and blood pressure. Digital scales were used for weight, a telescopic measuring rod for height, a nonstretchable measuring tape to measure the waist circumference above the iliac crests, and a validated aneroid sphygmomanometer was used to record blood pressure. Obesity was defined in accordance with the criteria of the World Health Organization, the International Obesity Task Force, and the Spanish anthropometric tables designed by Fundación Orbegozo.
Study Variables, Data Collection Methods, and Follow-up Timeline
| Methods | Measurements | Variables |
|---|---|---|
| Physical examination: anthropometry | Weight status | Mean values for weight, height, waist circumference, and systolic and diastolic blood pressure. Body mass index. Child's weight and height, reported by accompanying adult. Diagnosed comorbidities: allergies, asthma, hypertension, etc. |
| Computer-assisted telephone interview questionnaire on eating and lifestyle | Eating habits, quality of life, diet assessment, physical exercise, sleep, use of TV/gaming/computer screens, and neighborhood facilities | Child: breast milk and introduction of solids (4 y). Energy intake: food types, macronutrients and micronutrients based on food composition tables. Eating habits: diet changes, school meals, daily meal patterns, frequency of fast food intake. Physical activity (h/wk), sleep (h/d), use of computer, TV and game console (h/d). Health-related quality of life score (from age 6 y). Parents: reported weight and height. Physical activity and sedentary behavior. Neighborhood sports and exercise facilities. |
| Social factors | Socioeconomic status, family size/structure, and parents’ educational level and purchasing power. | |
| Blood sample at ages 9 and 14 y | Blood-based biomarkers | All samples: lipids (total cholesterol, HDL-C, LDL-C, triglycerides), glucose, insulin, glycated hemoglobin (HbA1c), C-reactive protein, calcium, phosphate, alkaline phosphatase, ferritin, and transferrin. Vitamins A, B12, E, folic acid, D, and individual carotinoids. Subsample for genetic markers: selected gene testing of expression in lymphocytes. |
| Medical records: primary care electronic medical record (APMADRID) and specialist records (MBDS) | Past medical history and medications | Anthropometric values, health problems and diagnosed comorbidities, eating habits and sleep. Laboratory tests: blood lipids, glucose, minerals, vitamins. Prescription medication and vaccinations. Use of health care services (These variables will be collected from records from birth onwards.) |
| Age 4 y | Age 6 y | Age 9 y | Age 12 y | Age 14 y |
|---|---|---|---|---|
| Data collection | ||||
| - Physical examination - Questionnaire - Medical records | - Physical examination - Questionnaire - Medical records | - Physical examination - Questionnaire - Medical records - Blood samples | - Physical examination - Questionnaire - Medical records | - Physical examination - Questionnaire - Medical records - Blood samples |
HDL-C, high-density lipoprotein cholesterol; HT, hypertension; LDL-C, low-density lipoprotein cholesterol; MBDS, Minimum Basic Data Set; TV, television.
The questionnaire included the following modules: sociodemographic variables, dietary patterns and lifestyles, semiquantitative food frequency based on the Martin-Moreno et al questionnaire,6 and quality of life (KINDSCREEN-10).
Laboratory tests were performed following standard procedures and quality controls. The following data were collected from the child's medical records from birth: growth and development (weight and height), health problems (cardiometabolic and musculoskeletal disorders, upper respiratory tract obstruction, anxiety, depression and behavior disorders), laboratory tests, medication, vitamin supplements, and vaccinations. Data were taken from the child's single primary care electronic medical record (APMADRID program) and hospitalization records (Minimum Data Set). A unique identity code was applied to each child to ensure medical record traceability throughout the Madrid Autonomous Community.
In 2011, we conducted a pilot study and trained staff to standardize measurements. To encourage participation, we organized activities with families and pediatricians. The project was published in the Madrid Autonomous Community Health Website.
For the statistical analysis, qualitative variables are expressed as relative frequencies and quantitative variables as mean and standard deviation. The association between determinants was assessed with multilevel logistic regression models using anthropometric status (body mass index at baseline and changes during follow-up) as a dependent variable. In view of the complex sampling design, we applied a 95% confidence interval in all analyses.
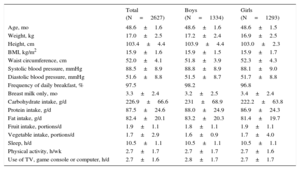
In total, 2627 of the 4571 children screened at aged 4 years participated in the questionnaire and examination, representing a response rate of 57.5%. Participants (Table 2) had a mean body mass index of 15.9 and a systolic and diastolic blood pressure of 88.5 and 51.6 mmHg, respectively. Mean daily intake for carbohydrates, proteins and fats was 226.9 g, 87.5 g and 82.4 g, respectively. Mean fruit and vegetable portions per day were 1.9 and 1.7, respectively. Weekly physical activity was 2.7 hours and daily use of television, game console and computer was 2.7 hours.
Anthropometric, Nutritional and Lifestyle Characteristics, and Blood Pressure in the Baseline Sample
| Total (N=2627) | Boys (N=1334) | Girls (N=1293) | |
|---|---|---|---|
| Age, mo | 48.6±1.6 | 48.6±1.6 | 48.6±1.5 |
| Weight, kg | 17.0±2.5 | 17.2±2.4 | 16.9±2.5 |
| Height, cm | 103.4±4.4 | 103.9±4.4 | 103.0±2.3 |
| BMI, kg/m2 | 15.9±1.6 | 15.9±1.5 | 15.9±1.7 |
| Waist circumference, cm | 52.0±4.1 | 51.8±3.9 | 52.3±4.3 |
| Systolic blood pressure, mmHg | 88.5±8.9 | 88.8±8.9 | 88.1±9.0 |
| Diastolic blood pressure, mmHg | 51.6±8.8 | 51.5±8.7 | 51.7±8.8 |
| Frequency of daily breakfast, % | 97.5 | 98.2 | 96.8 |
| Breast milk only, mo | 3.3±2.4 | 3.2±2.5 | 3.4±2.4 |
| Carbohydrate intake, g/d | 226.9±66.6 | 231±68.9 | 222.2±63.8 |
| Protein intake, g/d | 87.5±24.6 | 88.0±24.9 | 86.9±24.3 |
| Fat intake, g/d | 82.4±20.1 | 83.2±20.3 | 81.4±19.7 |
| Fruit intake, portions/d | 1.9±1.1 | 1.8±1.1 | 1.9±1.1 |
| Vegetable intake, portions/d | 1.7±2.9 | 1.6±0.9 | 1.7±4.0 |
| Sleep, h/d | 10.5±1.1 | 10.5±1.1 | 10.5±1.1 |
| Physical activity, h/wk | 2.7±1.7 | 2.7±1.7 | 2.7±1.6 |
| Use of TV, game console or computer, h/d | 2.7±1.6 | 2.8±1.7 | 2.7±1.7 |
BMI, body mass index; TV, television.
Unless otherwise indicated, the data are expressed as mean±standard deviation.
The ELOIN study lays the foundations to prospectively follow upa representative sample of children. Its main strength lies in its longitudinal, population cohort design that includes children with a broad socioeconomic status, geographical residence, and origin. The data from the ELOIN study cohort through to adult age will help improve our clinical-epidemiological knowledge of the factors associated with the onset and persistence of childhood obesity and its short- and long-term impact on health.
The characteristics of the baseline sample are quite similar to the characteristics of the general population. However, the percentage of mothers with primary school education or below is slightly lower in the ELOIN study than in Madrid in general. The main challenge in follow-up will be to maintain high participation levels, and to achieve this we have designed engagement strategies to be implemented by the pediatricians and a telephone call and alert system for the families.
We believe that the ELOIN study is a viable project with a design that makes efficient use of health resources. The study results will provide an excellent opportunity to strengthen prevention strategies and control childhood obesity in our region.
FundingThis study has been partly funded by the Madrid Department of Health under project no. RS_AP10-13.
We are grateful to the families for their voluntary participation, to the pediatricians for their contribution, and to the companies Demométrica and Sondaxe for the interviews.