
Evidence indicates an association between mortality and volume for certain health care processes and therapeutic procedures. The link between volume and outcomes in coronary artery bypass grafting is well established in Spain.1 In the United States, research has found a relationship between a higher volume of primary percutaneous coronary interventions (pPCIs) and a lower mortality rate in acute myocardial infarction.2 In England and Wales, high-volume hospitals exhibit a shorter delay to pPCI, which is related to lower mortality rates.3
To analyze the association between volume and in-hospital mortality in pPCI in Spanish National Health System hospitals, we used the Minimum Data Set to perform a retrospective observational study of in-hospital events in patients admitted for ST-segment elevation acute myocardial infarction (STEMI). We selected events from a 3-year period (2017-2019) with a principal diagnosis of STEMI. We excluded events with an admission to discharge time ≤ 1 day, with voluntary discharges, or with discharges to unknown locations, as well as those with no record on the type of discharge, patient age, discharge date, or principal diagnosis. STEMI events were identified in which pPCI was performed without accompanying fibrinolysis. Due to the characteristics of the Minimum Data Set in the Spanish National Health System and the anonymous character of the data analyzed, informed consent and ethics committee approval were not necessary.
Transfer events between hospitals were concatenated in a single event, which was assigned to the hospital with the highest complexity according to RECALCAR typology.4 We excluded events that, after concatenation, had another hospital as the discharge destination, meaning that the final outcome was unknown, as well as STEMI events attributed to centers lacking a catheterization laboratory. In addition, to avoid selection bias, we also excluded events corresponding to centers that had a transfer percentage to another hospital without identification of the final discharge destination > 1.5 times the interquartile range.
The risk-adjusted mortality rate (RAMR) was calculated using multilevel logistic regression models with a previously described methodology.1 The number of pPCI procedures performed in each hospital during the study period was the volume variable. To discriminate between high- and low-volume centers, we used 2 methods: a) a k-medians clustering algorithm,1 and b) distribution in 4 groups based on the number of pPCIs performed in the study period: < 300, 300 to 599, 600 to 899, and ≥ 900. In both cases, we eliminated hospitals that performed fewer than 25 pPCI procedures per year. All statistical comparisons were 2-sided, and differences were considered significant at P < .05; odds ratios (ORs) were calculated with their 95% confidence intervals (95%CIs).
In the period from 2017 to 2019, 61 142 STEMI index events were identified in 89 centers with a catheterization laboratory, with a crude mortality rate (CMR) in admitted patients of 8.4%. Of these patients, 46 698 (76.4%) underwent pPCI. The demographic characteristics, most relevant comorbidities, and CMRs of these patients are shown in table 1 overall and grouped by the number of pPCIs per center.
Profile of patients with ST-segment elevation acute myocardial infarction treated with pPCI in hospitals with a catheterization laboratory by volume.
| pPCI | < 300 | 300-< 600 | 600-< 900 | ≥ 900 | Total | P |
|---|---|---|---|---|---|---|
| Patients, n | 3461 | 18 792 | 17 127 | 7318 | 46 698 | |
| Age, y | 63.84±12.71 | 63.76±12.98 | 63.72±12.94 | 62.85±12.8 | 63.61±12.9 | .890 |
| Women, % | 23.55 | 22.77 | 22.77 | 22.86 | 22.84 | <.001 |
| Anterior myocardial infarction, % | 35.74 | 40.52 | 40.87 | 42.13 | 40.55 | <.001 |
| History of coronary artery bypass grafting | 0.92 | 0.61 | 0.63 | 0.74 | 0.66 | <.001 |
| History of percutaneous transluminal angioplasty | 14.13 | 10.41 | 12.35 | 12.72 | 11.76 | .577 |
| Metastatic cancer, acute leukemia, and other severe cancers (CC 8-9) | 0.95 | 0.80 | 0.92 | 0.89 | 0.87 | <.001 |
| Diabetes mellitus or complications of diabetes mellitus except proliferative retinopathy (CC 17) | 27.42 | 26.55 | 24.58 | 25.10 | 25.66 | .170 |
| Protein-calorie malnutrition (CC 21) | 0.20 | 0.23 | 0.18 | 0.33 | 0.23 | .416 |
| Chronic liver disease (CC 27-29) | 1.24 | 1.54 | 1.42 | 1.59 | 1.48 | .383 |
| Dementia or other specified brain disorders (CC 51-53) | 1.94 | 1.74 | 1.59 | 1.59 | 1.67 | .214 |
| Major psychiatric disorders (CC 57-59) | 0.66 | 0.69 | 0.87 | 0.77 | 0.76 | .620 |
| Hemiplegia, paraplegia, paralysis, functional disability (CC 70-74, 103-104, 189) | 0.29 | 0.29 | 0.29 | 0.38 | 0.30 | <.001 |
| Cardiogenic shock (R57.0) | 3.61 | 5.56 | 5.04 | 5.86 | 5.27 | <.001 |
| Cardiorespiratory failure (CC 84) | 10.40 | 8.21 | 7.20 | 9.07 | 8.14 | <.001 |
| Congestive heart failure (CC 85) | 9.30 | 14.04 | 9.75 | 14.64 | 12.21 | .495 |
| AMI complications (I23.4, I23.5, I51.1, I51.2) | 0.03 | 0.08 | 0.11 | 0.11 | 0.09 | <.001 |
| Other complications of acute coronary syndrome (I23.0, I23.1, I23.2, I23.3, I23.6, I23.7, I23.8, I24.1) | 0.72 | 1.10 | 1.45 | 1.08 | 1.20 | <.001 |
| Valvular and rheumatic heart disease (CC 91) | 8.06 | 12.31 | 13.98 | 16.40 | 13.25 | <.001 |
| Hypertension (CC 95) | 46.69 | 45.68 | 44.65 | 42.44 | 44.87 | .004 |
| Stroke (CC 99-100) | 0.35 | 0.28 | 0.20 | 0.07 | 0.22 | .413 |
| Cerebrovascular disease (CC 101-102, 105) | 1.70 | 1.76 | 1.68 | 1.46 | 1.68 | .048 |
| Vascular disease and complications (CC 106-108) | 4.36 | 4.37 | 4.19 | 4.99 | 4.40 | .143 |
| Chronic obstructive pulmonary disease (CC 111) | 6.10 | 6.49 | 5.90 | 6.23 | 6.20 | .623 |
| Pneumonia (CC 114-116) | 0.84 | 1.01 | 1.05 | 0.93 | 1.00 | <.001 |
| Renal failure (CC 135-140) | 8.44 | 9.00 | 7.38 | 9.70 | 8.47 | .543 |
| Trauma; other injuries (CC 166-168, 170-174) | 1.36 | 1.20 | 1.10 | 1.23 | 1.18 | <.001 |
| Crude mortality rate | 4.42 | 5.42 | 5.39 | 4.66 | 5.21 | .009 |
| RSMR | 5.4±1.1 | 5.5±1.8 | 5.9±1.5 | 4.4±0.7 | 5.5±1.6 | <.001 |
CC, condition categories (groups of comorbidities)5; pPCI, primary percutaneous coronary intervention; RAMR, risk-adjusted (in-hospital) mortality rate.
Values represent % or mean ± standard deviation.
The adjustment for the in-hospital mortality of the STEMI patients treated with pPCI was very good (AUROC=.886). Although the clinical significance was weak, significant differences were found in the RAMR among hospitals belonging to RECALCAR4 groups 3, 4, and 5 (5.28±1.21, 5.56±1.74, and 5.43±0.97; P < .001).
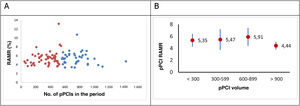
The clustering algorithm identified high-volume centers as those performing more than 545 pPCIs in the study period (182 pPCIs/y). Compared with “low-volume” centers, the RAMR of STEMI events treated with pPCI was slightly lower in “high-volume” centers. This was statistically significant but not clinically significant. They also showed lower dispersion (5.4±1.5 vs 5.5±1.8; P < .001) (figure 1A). In addition, the variable “high volume” was not statistically significant when it was included in the adjustment model for in-hospital mortality risk (OR=1.03; 95%CI, 0.87-1.24; P=.674). When the RAMR was compared by volume group, centers with more than 900 pPCIs in the period (mean, 300 pPCIs/y; 7 centers, 16% of all events) showed a statistically and clinically significant lower RAMR (4.43±0.65 vs 5.65±1.62; P < .001) (figure 1B).
 mortality rate.")
The Minimum Data Set does not provide information on whether patients have been treated in a coronary care unit, intensive cardiac intensive care unit (CICU), or intensive care unit. Given the association between CICU availability and improved STEMI outcomes,6 our lack of information on this aspect is a limitation of this study.
In conclusion, no clear association was found in Spanish National Health System hospitals between pPCI volume and STEMI and pPCI mortality, although centers performing ≥ 300 pPCIs on average per year show lower mortality. No differences were found between the remaining hospitals grouped by pPCI volume.
FUNDINGThis work was made possible by an unconditional grant from the Fundación Interhospitalaria de Investigación Cardiovascular.
AUTHORS’ CONTRIBUTIONSA. Fernández Ortiz: conception and design, data analysis and interpretation, and manuscript drafting. M. García-Márquez: data acquisition, analysis, and interpretation. A. Viana Tejedor: critical review of intellectual content. F. Noriega Sanz: critical review of intellectual content. C. Ferrera Duran: critical review of intellectual content. J. Elola: conception and design, data acquisition, analysis, and interpretation, and manuscript drafting. All of the authors have reviewed and approved the final version of the manuscript.
CONFLICTS OF INTERESTNone.