The EPINUT research group (reference 920325) at the Universidad Complutense de Madrid conducts research into the links between obesity and cardiovascular risk in Spain, in partnership with Arkopharma Pharmaceutical laboratories and the Spanish Society of Dietetics and Food Sciences (Sociedad Española de Dietética y Alimentación [SEDCA]).1 Here we present preliminary data on the prevalence of metabolic syndrome components and the “metabolically healthy” phenotype in a large population of adults with overweight or obesity.
Cross-sectional data were collected from 7972 study participants (6683 women and 1289 men) with a body mass index (BMI) ≥ 25. Participants were aged 18 to 74 years and were recruited by Arkopharma dieticians during consultations at 137 locations distributed across 47 of the 50 Spanish provinces. Recruitment took place between January 15, 2013 and February 15, 2014, and the study population represents 85.50% of patients treated in this period. The study was conducted in compliance with the Declaration of Helsinki.2
For each participant, measurements were taken of body height (cm), body mass (kg), and waist circumference (cm), and BMI (body mass in kg divided by the square of body height in m2) and the waist-to-height ratio were calculated. Hypertension, hyperglycemia, and hypercholesterolemia were assessed from blood pressure, serum glucose, and serum cholesterol recordings according to International Diabetes Federation criteria.3 Participants were also considered to have these metabolic syndrome components if they were taking specific medication to control them. Participants with normal values for these parameters were considered metabolically healthy.
Study participants were classified according to age (18-24, 25-34, 35-44, 45-54, 55-64, and 65-74 years) and BMI range (overweight: BMI 25.0-29.9kg/m2; grade-1 obesity: BMI 30.0-34.9kg/m2; grade-2 obesity: BMI 35.0-39.9kg/m2; grade-3 obesity: BMI > 39.9kg/m2). Between-category comparisons were made with Student's t test and the ANOVA and chi-square tests, using SPSSv.21.0.
Within the study population, 50.1% of men and 42.5% of women were hypertensive (≥ 130/85mmHg). The figures were similar for hypercholesterolemia, which affected 47.3% of men (high-density lipoprotein cholesterol <40mg/dL) and 42.3% of women (high-density lipoprotein cholesterol < 50mg/dL). Elevated fasting glucose (≥ 100mg/dL) was recorded in 25.5% of men and 20% of women. For all 3 of these metabolic syndrome components, differences were statistically significant (P < .001) between the youngest participants (18-24 years) and the oldest (65-74 years).
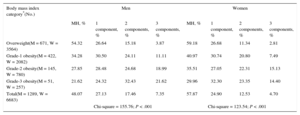
The prevalence of the metabolically healthy phenotype declined significantly with obesity grade (P < .001) and was higher for women in all BMI categories (P < .001) (Table 1). The overall proportion of metabolically healthy obese participants (31.7%) was similar to that reported in a series of 11 520 Spanish adults (28.9%).4 Among male participants, 27.1% had only 1 metabolic syndrome component, 17.5% had 2, and 7.4% had all 3 (hypertension, hypercholesterolemia, and hyperglycemia). A lower proportion of women had metabolic-syndrome components (P < .05): 24.9% had 1 component, 12.5% had 2, and 4.7% had all 3.
Prevalence of the Metabolically Healthy Phenotype and Number of Metabolic Syndrome Components as a Function of Overweight or Obesity Status
| Body mass index category*(No.) | Men | Women | ||||||
|---|---|---|---|---|---|---|---|---|
| MH, % | 1 component, % | 2 components, % | 3 components, % | MH, % | 1 component, % | 2 components, % | 3 components, % | |
| Overweight(M = 671, W = 3564) | 54.32 | 26.64 | 15.18 | 3.87 | 59.18 | 26.68 | 11.34 | 2.81 |
| Grade-1 obesity(M = 422, W = 2082) | 34.28 | 30.50 | 24.11 | 11.11 | 40.97 | 30.74 | 20.80 | 7.49 |
| Grade-2 obesity(M = 145, W = 780) | 27.85 | 28.48 | 24.68 | 18.99 | 35.51 | 27.05 | 22.31 | 15.13 |
| Grade-3 obesity(M = 51, W = 257) | 21.62 | 24.32 | 32.43 | 21.62 | 29.96 | 32.30 | 23.35 | 14.40 |
| Total(M = 1289, W = 6683) | 48.07 | 27.13 | 17.46 | 7.35 | 57.87 | 24.90 | 12.53 | 4.70 |
| Chi-square = 155.76; P < .001 | Chi-square = 123.54; P < .001 | |||||||
M, men; MH, metabolically healthy; W, women.
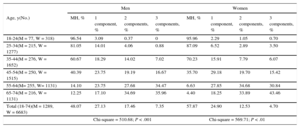
Table 2 shows the relationship between the number of metabolic syndrome components and age category. The proportion of metabolically healthy participants declined with age, and the decline was particularly notable from the age of 45 years. The instability of healthy obesity was highlighted by an 11-year study of 1051 participants aged 18 to 65 years in Pizarra (Málaga, Spain), which showed the importance of considering how long an individual has been overweight.5 Further important information came from a 20-year study of 2561 adults in the UK aged 19 to 62 years; by the end of the study, half of the obese participants who initially had no other risk factors had developed a metabolic comorbidity.6 In both studies, the appearance of metabolic syndrome components in people with excess body weight increased sharply between the fourth and fifth decades of life.
Prevalence of the Metabolically Healthy Phenotype and Number of Metabolic Syndrome Components as a Function of Age
| Men | Women | |||||||
|---|---|---|---|---|---|---|---|---|
| Age, y(No.) | MH, % | 1 component, % | 2 components, % | 3 components, % | MH, % | 1 component, % | 2 components, % | 3 components, % |
| 18-24(M = 77, W = 318) | 96.54 | 3.09 | 0.37 | 0 | 95.96 | 2.29 | 1.05 | 0.70 |
| 25-34(M = 215, W = 1277) | 81.05 | 14.01 | 4.06 | 0.88 | 87.09 | 6.52 | 2.89 | 3.50 |
| 35-44(M = 276, W = 1652) | 60.67 | 18.29 | 14.02 | 7.02 | 70.23 | 15.91 | 7.79 | 6.07 |
| 45-54(M = 250, W = 1515) | 40.39 | 23.75 | 19.19 | 16.67 | 35.70 | 29.18 | 19.70 | 15.42 |
| 55-64(M= 255, W= 1131) | 14.10 | 23.75 | 27.68 | 34.47 | 6.63 | 27.85 | 34.68 | 30.84 |
| 65-74(M = 216, W = 1131) | 12.25 | 17.10 | 34.69 | 35.96 | 4.40 | 18.25 | 33.89 | 43.46 |
| Total (18-74)(M = 1289, W = 6683) | 48.07 | 27.13 | 17.46 | 7.35 | 57.87 | 24.90 | 12.53 | 4.70 |
| Chi-square = 510.68; P < .001 | Chi-square = 569.71; P < .01 | |||||||
M, men; MH, metabolically healthy; W, women.
Women generally have a greater interest than men in losing weight and are consequently more likely to attend a dietetic consultation. This tendency is reflected in the imbalance between the numbers of men and women in our series, which is a limitation of the study. Other limitations are the cross-sectional nature of the study and the sourcing of data from a single provider. The analysis of abdominal obesity is still in progress and will provide further information about the link between excess weight and the other metabolic syndrome components. Nonetheless, the preliminary results presented here provide an overview of the prevalence of metabolic syndrome components in Spanish people with overweight and obesity and support the hypothesis that apparently healthy obesity naturally progresses to cardiometabolic deterioration.