Cardiac magnetic resonance has evolved into a crucial modality for the evaluation of cardiomyopathy due to its ability to characterize myocardial structure and function. In the last few years, interest has increased in the potential of “mapping” techniques that provide direct and objective quantification of myocardial properties such as T1, T2, and T2* times. These approaches enable the detection of abnormalities that affect the myocardium in a diffuse fashion and/or may be too subtle for visual recognition. This article reviews the current state of myocardial T1 and T2-mapping in both health and disease.
Keywords
Standard approaches for myocardial characterization with cardiac magnetic resonance (CMR) include T1-weighted, T2-weighted, and late gadolinium enhancement (LGE) imaging that allow the visualization of fatty infiltration, edema, or necrosis/scarring.1 These sequences rely on relative changes in signal intensity between abnormal and normal myocardium. However, they are hampered by their often semiquantitative nature and their inherent limitations in depicting diffuse myocardial processes with no “normal” reference myocardium at the time of imaging. Myocardial mapping with CMR is quickly evolving as an objective and quantitative approach for the noninvasive characterization of myocardial properties such as extracellular volume expansion, edema, or other abnormalities in tissue composition. In this article, we review state-of-the-art myocardial T1- and T2- mapping in health and disease. Older T2*-mapping approaches that can detect iron overload or intramyocardial hemorrhage are reviewed elsewhere.2
T1- AND T2-MAPPINGA detailed description of the physics principles of CMR is beyond the scope of this review. Briefly, CMR generates images by transferring energy to 1H water and fat protons, which is in turn released as they recover their baseline state (“relax”), and which can be detected and mapped into a spatial distribution of protons. The speed of this relaxation is determined by T1 and T2 (longitudinal and transverse relaxation times, respectively). T1 and T2 times are intrinsic tissue properties that also depend on the magnetic field strength: T1 lengthens at higher fields whereas T2 remains relatively constant,3 although myocardial T2 tends to shorten.4 Gadolinium-based contrast agents change relaxation times, specifically shortening T1.
A T1- or T2-map is an image in which signal intensity in each voxel is directly proportional to the T1 or T2 time of the tissue within. These times can be compared with those of remote myocardium in focal or heterogeneous processes, or with normal reference values in cases of diffuse disease. While LGE detects localized replacement fibrosis,5 T1-mapping techniques were initially developed to study diffuse interstitial fibrosis, although their applications continue to expand. The main purpose of T2-mapping is the detection of edema.2
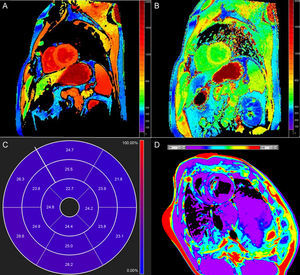
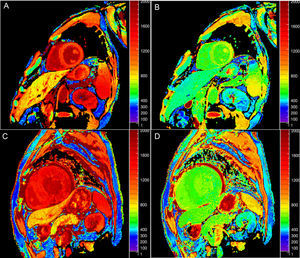
Native T1 TimeOne potential application of T1-mapping is the quantification of native (or precontrast) myocardial T1 (Figure 1A). Native T1 can be prolonged or shortened in a variety of clinical conditions (see below). Since contrast administration is not needed, native T1-mapping offers diagnostic potential in patients with relative contraindications to gadolinium (ie, advanced renal failure). The histopathological correlates of T1 remain incompletely elucidated, but T1 reflects changes in both the intracellular and extracellular compartments, and is influenced by the presence of edema, collagen or other proteins, iron, and lipids.6
Postcontrast T1 Time, postcontrast T1 map (B), 17-segment extracellular volume diagram (C) and T2 map (D). A-C: normal individual; D: normal experimental animal.")
T1 can be calculated after the administration of gadolinium (Figure 1B). Most gadolinium agents are extracellular compounds: they distribute in the intravascular and interstitial compartments but not within the cells. Thus, reduced postcontrast T1 either reflects access to the intracellular space (loss of cell membrane integrity in, for example, acute necrosis) and/or interstitial space expansion that is largely considered a surrogate of interstitial fibrosis.7 Although this was the first approach for clinical myocardial T1-mapping,8 postcontrast T1 use has fallen somewhat out of favor because of its dependency on time after gadolinium administration, contrast dose, body composition, renal clearance, heart rate, and hematocrit.5 Approaches to correct for these variations have nonetheless been proposed.9–12
Partition Coefficient (λ)λ represents the relationship between changes in pre- and postcontrast myocardium and blood T1 and is calculated as:
where R1 is tissue relaxivity (1/T1) and ΔR1 is R1postcontrast – R1precontrast13
λ attempts to account for interindividual variations in contrast dose, time after contrast or renal clearance by correcting for precontrast T1 as well blood T1 changes, and is also less sensitive to magnetic field strength.14 However, it remains sensitive to some confounders, particularly blood plasma volume (see below).
Extracellular VolumeExtracellular volume (ECV) (Figure 1C) incorporates a correction for blood plasma volume and is calculated as:13

ECV maps can also be generated. Ideally, hematocrit should be quantified simultaneously to the CMR scan;6,15 however, this recommendation has been challenged based on logistical considerations as well as considerable variability in hematocrit determinations.16 Furthermore, an approach using hematocrit estimated from blood R1 has recently been proposed and validated16 that may obviate the need for actual quantification.
In normal conditions, the extracellular space represents approximately 25% of myocardial volume.5,15 Extracellular volume combines both the interstitial and intravascular space and, similar to postcontrast T1, is often considered a surrogate of interstitial fibrosis.15 Extracellular volume can be quantified during a slow, continuous infusion of contrast or reasonably approximated at least 15min after a bolus injection,17,18 although the latter tends to overestimate large ECV values.18 While ECV is less sensitive to confounding factors, the sequences used may still be prone to errors and some influence of gadolinium concentration (in turn influenced by contrast dose, postcontrast delay, or body habitus) remains.6,17,19,20
Today, native T1 and ECV are the preferred indices derived from T1-mapping.6
Native T2 TimeT2 time lengthens in proportion to water content,21 and consequently increased T2 largely reflects myocardial edema. Standard T2-weighted images are limited because of susceptibility to artifacts and subjective interpretation, so T2-mapping (Figure 1D) offers the potential for more objective detection and quantification of inflammation and/or reperfusion related edema.
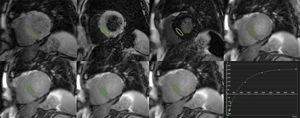
T1 AND T2 QUANTIFICATIONCardiac magnetic resonance sequences for T1-mapping rely on the generation of images at different degrees of longitudinal relaxation to generate a signal intensity vs time curve (Figure 2) from which T1 is calculated. This can be accomplished by repeated acquisitions with varying inversion-recovery times8,22; however, this requires multiple breath-holds. Thus, sequences have been designed that enable acquisition of all necessary images in a single breath-hold and in the same phase of the cardiac cycle. The first one, developed in 2004, is termed modified look-locker inversion recovery (MOLLI).23 A number of modifications of MOLLI and alternative approaches have been proposed,15,24 including a shortened version (shMOLLI) that allows for reduced breath-holding.12
, and signal intensity (in this case in the septum) is plotted against inversion times to obtain the T1 time.")
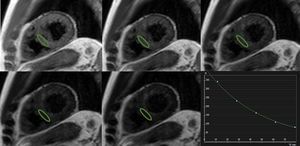
Similarly, T2-mapping relies on fitting a curve of signal intensity values on different times during transverse relaxation (Figure 3). This is typically achieved by using preparatory T2 pulses25 or different echo times during acquisition,26 with different sequences showing specific strengths and limitations.4 Although less pronounced and systematically explored in comparison with T1-mapping, some potential heart rate dependency of measured T2 values has been described.27,28
, and signal intensity (in this case in the septum) is plotted against echo times to obtain the T2 time.")
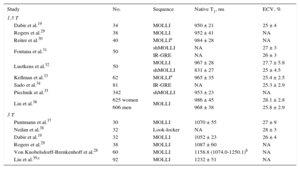
Normal values for native myocardial T1 times and ECV19,28–39 are shown in Table 1. Native T1 time at 1.5 T is approximately 900-1000ms (longer at 3 T), whereas normal ECV is in the order of 20% to 30%, in good agreement with expected values.5 As noted before, postcontrast T1 times depend on several technical and physiological factors, and reported normal λ values have ranged from 0.25 to 0.70.19,29,36 Multiple publications have reported increasing ECV with age.19,28,35,38,40 The largest study to date with 1231 individuals36 confirmed these associations, particularly in men, and reported higher precontrast T1 and ECV in women, as also noted by others.34,41 The presence of abnormal T1-based indices, particularly native T1 and ECV, allows for the identification of diseased myocardium,29,33,34,40 and respective thresholds of approximately 1000ms (at 1.5 T) and 30% have been used.33,42–45 In 52 patients with either dilated or hypertrophic cardiomyopathy (DCM and HCM, respectively) and 30 controls, native T1 showed the highest accuracy in differentiating between healthy and diseased myocardium with a sensitivity of 100%, specificity of 96%, and diagnostic accuracy of 98% (area under the curve = 0.99; 95% confidence interval [95%CI], 0.96-1.00; P < .001).37
Normal Myocardial Native T1 Times and Extracellular Volume (Studies With ≥ 30 Participants)
| Study | No. | Sequence | Native T1, ms | ECV, % |
|---|---|---|---|---|
| 1.5 T | ||||
| Dabir et al.19 | 34 | MOLLI | 950 ± 21 | 25 ± 4 |
| Rogers et al.29 | 38 | MOLLI | 952 ± 41 | NA |
| Reiter et al.30 | 40 | MOLLIa | 984 ± 28 | NA |
| Fontana et al.31 | 50 | shMOLLI | NA | 27 ± 3 |
| IR-GRE | NA | 26 ± 3 | ||
| Luetkens et al.32 | 50 | MOLLI | 967 ± 28 | 27.7 ± 5.8 |
| shMOLLI | 831 ± 27 | 25 ± 4.5 | ||
| Kellman et al.33 | 62 | MOLLIa | 965 ± 35 | 25.4 ± 2.5 |
| Sado et al.34 | 81 | IR-GRE | NA | 25.3 ± 2.9 |
| Piechnik et al.35 | 342 | shMOLLI | 953 ± 23 | NA |
| Liu et al.36 | 625 women | MOLLI | 986 ± 45 | 28.1 ± 2.8 |
| 606 men | 968 ± 38 | 25.8 ± 2.9 | ||
| 3 T | ||||
| Puntmann et al.37 | 30 | MOLLI | 1070 ± 55 | 27 ± 9 |
| Neilan et al.38 | 32 | Look-locker | NA | 28 ± 3 |
| Dabir et al.19 | 32 | MOLLI | 1052 ± 23 | 26 ± 4 |
| Rogers et al.29 | 38 | MOLLI | 1087 ± 60 | NA |
| Von Knobelsdorff-Brenkenhoff et al.28 | 60 | MOLLI | 1158.8 (1074.0-1250.1)b | NA |
| Liu et al.39,c | 92 | MOLLI | 1232 ± 51 | NA |
ECV, extracellular volume; IR-GRE, inversion-recovery gradient recalled echo; MOLLI, modified look-locker inversion recovery, NA, not applicable; shMOLLI, short MOLLI.
T1 times and extracellular volume values expressed as mean ± standard deviation.
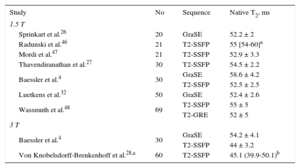
Table 2 summarizes normal myocardial T2 values.4,27,28,32,46–48 At 1.5 T, T2 is in the order of 50-60ms (slightly shorter at 3 T) and a possible increase with aging has been reported.49 Although far less validated, T2 can also be used to differentiate normal from abnormal myocardium with a cutoff in the vicinity of 60ms.27,50–52
Normal Myocardial Native Myocardial T2 Times (Studies With ≥ 20 Participants)
| Study | No | Sequence | Native T2, ms |
|---|---|---|---|
| 1.5 T | |||
| Sprinkart et al.26 | 20 | GraSE | 52.2 ± 2 |
| Radunski et al.46 | 21 | T2-SSFP | 55 [54-60]a |
| Mordi et al.47 | 21 | T2-SSFP | 52.9 ± 3.3 |
| Thavendiranathan et al.27 | 30 | T2-SSFP | 54.5 ± 2.2 |
| Baessler et al.4 | 30 | GraSE | 58.6 ± 4.2 |
| T2-SSFP | 52.5 ± 2.5 | ||
| Luetkens et al.32 | 50 | GraSE | 52.4 ± 2.6 |
| Wassmuth et al.48 | 69 | T2-SSFP | 55 ± 5 |
| T2-GRE | 52 ± 5 | ||
| 3 T | |||
| Baessler et al.4 | 30 | GraSE | 54.2 ± 4.1 |
| T2-SSFP | 44 ± 3.2 | ||
| Von Knobelsdorff-Brenkenhoff et al.28,a | 60 | T2-SSFP | 45.1 (39.9-50.1)b |
GraSE, gradient-spin-echo sequence; T2-GRE, T2-prepared gradient recalled echo; T2-SSFP, T2-prepared steady state free precession.
T2 times expressed as mean ± standard deviation.
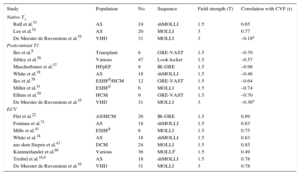
Beyond phantom and animal experiments, T1-mapping techniques have been validated against histology of human myocardium8,16,18,22,31,41,43,53–60 (Table 3). Importantly, these studies comprise a variety of clinical scenarios including HCM, DCM, heart failure with preserved ejection fraction, end-stage heart failure, or valvular heart disease. Most studies used endomyocardial biopsy for validation, although 2 evaluated whole explanted hearts. Two reports demonstrated significant correlations of native T1 with collagen volume fraction, although a third study failed to find a significant association. Most studies also identified significant correlations between postcontrast T1 and collagen amount, typically less consistent than for ECV (Table 3). Extracellular volume tends to provide higher values than collagen volume fraction, probably reflecting the fact that the interstitial space is not occupied by connective tissue exclusively.
Validation Studies of T1-mapping Against Histopathology (Collagen Volume Fraction)
| Study | Population | No. | Sequence | Field strength (T) | Correlation with CVF (r) |
|---|---|---|---|---|---|
| Native T1 | |||||
| Bull et al.53 | AS | 19 | shMOLLI | 1.5 | 0.65 |
| Lee et al.54 | AS | 20 | MOLLI | 3 | 0.77 |
| De Meester de Ravenstein et al.55 | VHD | 31 | MOLLI | 3 | –0.18a |
| Postcontrast T1 | |||||
| Iles et al.8 | Transplant | 6 | GRE-VAST | 1.5 | –0.70 |
| Sibley et al.56 | Various | 47 | Look-locker | 1.5 | –0.57 |
| Mascherbauer et al.57 | HFpEF | 9 | IR-GRE | 1.5 | –0.98 |
| White et al.18 | AS | 18 | shMOLLI | 1.5 | –0.46 |
| Iles et al.58 | ESHFb/HCM | 12 | GRE-VAST | 1.5 | –0.64 |
| Miller et al.41 | ESHFb | 6 | MOLLI | 1.5 | –0.74 |
| Ellims et al.59 | HCM | 9 | GRE-VAST | 1.5 | –0.70 |
| De Meester de Ravenstein et al.55 | VHD | 31 | MOLLI | 3 | –0.36a |
| ECV | |||||
| Flet et al.22 | AS/HCM | 26 | IR-GRE | 1.5 | 0.89 |
| Fontana et al.31 | AS | 18 | shMOLLI | 1.5 | 0.83 |
| Mille et al.41 | ESHFb | 6 | MOLLI | 1.5 | 0.75 |
| White et al.18 | AS | 18 | shMOLLI | 1.5 | 0.83 |
| aus dem Siepen et al.43 | DCM | 24 | MOLLI | 1.5 | 0.85 |
| Kammerlander et al.60 | Various | 36 | MOLLIc | 1.5 | 0.49 |
| Treibel et al.16,d | AS | 18 | shMOLLI | 1.5 | 0.78 |
| De Meester de Ravenstein et al.55 | VHD | 31 | MOLLI | 3 | 0.78 |
AS, aortic stenosis; CVF, collagen volume fraction; DCM, dilated cardiomyopathy; ECV, extracellular volume; ESHF, end-stage heart failure; GRE, gradient recalled echo; HCM, hypertrophic cardiomyopathy; HFpEF, heart failure with preserved ejection fraction; IR, inversion recovery; MOLLI, modified look-locker Inversion recovery; r, correlation coefficient; shMOLLI, short MOLLI; VAST, variable temporal sampling of k-space; VHD, valvular heart disease.
Histological validation of T2-mapping is much scantier. So far, only 1 investigation has demonstrated T2 elevation in biopsy-proven myocarditis,51 and 1 modern T2-mapping sequence has been compared with actual myocardial water content at contemporary field strengths.61
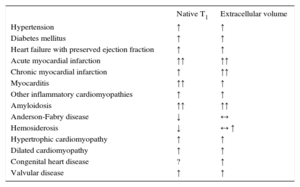
CLINICAL T1- AND T2-MAPPINGT1-mapping has been most extensively employed in clinical studies. With the exception of iron and lipid accumulation, myocardial diseases lead to elevations in native T1 (Table 4). Not surprisingly, ECV also increases in most disorders, particularly in myocardial infarction (MI) and amyloidosis (Table 4). T2-mapping has been mostly used in acute ischemic and inflammatory disease.
Changes in Native T1 and Extracellular Volume in Different Diseases
| Native T1 | Extracellular volume | |
|---|---|---|
| Hypertension | ↑ | ↑ |
| Diabetes mellitus | ↑ | ↑ |
| Heart failure with preserved ejection fraction | ↑ | ↑ |
| Acute myocardial infarction | ↑↑ | ↑↑ |
| Chronic myocardial infarction | ↑ | ↑↑ |
| Myocarditis | ↑↑ | ↑ |
| Other inflammatory cardiomyopathies | ↑ | ↑ |
| Amyloidosis | ↑↑ | ↑↑ |
| Anderson-Fabry disease | ↓ | ↔ |
| Hemosiderosis | ↓ | ↔ ↑ |
| Hypertrophic cardiomyopathy | ↑ | ↑ |
| Dilated cardiomyopathy | ↑ | ↑ |
| Congenital heart disease | ? | ↑ |
| Valvular disease | ↑ | ↑ |
↑: increase; ↓: decrease; ↔: unchanged;?: unknown.
Reduced postcontrast T1 time has been demonstrated in both heart failure with reduced left ventricular (LV) ejection fraction and heart failure with preserved ejection fraction, with correlations with the degree of diastolic dysfunction.8,57 An increase in native T1 and ECV has also been reported and validated in DCM.37,43 Myocardial mapping of T2, ECV and, particularly, native T1 was found useful in the identification of early stages of nonischemic DCM and its differentiation from athlete's heart in a recent study.47
Cardiovascular risk factors that contribute to heart failure, particularly heart failure with preserved ejection fraction, include but are not limited to arterial hypertension and diabetes mellitus. Recent studies demonstrated increased native T1 and ECV in the presence of hypertensive heart disease, defined as LV hypertrophy and/or altered mechanics, but not hypertension alone.62 An independent increase of ECV has also been shown in diabetes.63 Furthermore, abnormal T1-mapping indices suggestive of fibrosis are associated with increasing cardiovascular risk scores in the general population, particularly in men.64 Both in apparently healthy individuals and in disease, T1 indices have been linked to LV systolic and diastolic dysfunction, remodeling, and impaired energetics, even in the absence of LGE.20,40,42,65,66
In pulmonary hypertension, an increase in ECV has been demonstrated in the right ventricular insertion points at the septum in a large animal model67 and more recently in the free wall in patients,68 with a significant association with pulmonary hemodynamics and right ventricular performance.
Ischemic Heart DiseaseCardiac magnetic resonance imaging is highly accurate for determining ventricular volumes and ventricular function and has the additional advantage of being able to characterize the myocardium and demonstrate changes associated with the ischemic insult such as necrosis/fibrosis, edema, microvascular obstruction, and intramyocardial hemorrhage.69 Native T1- and T2-mapping can be used to detect myocardial edema in acute ischemic injury with higher accuracy and reproducibility than standard T2-weighted imaging.70,71 Sizing of the area-at-risk based on T1 and/or T2 elevations has been validated against fluorescent microspheres in animal models72 and scintigraphy in patients.44 T2-mapping has also enabled quantitative analysis of edema temporal evolution after MI.73
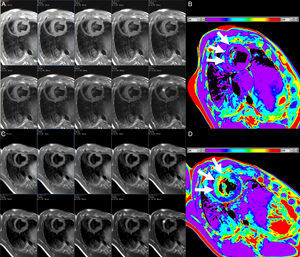
In the setting of MI, T1-mapping was used in an early study to evaluate acute (8 days) and chronic (6 months) infarct. Elevated native T1 (3 standard deviations above remote myocardium) detected acute MI with sensitivity and specificity of 96% and 91%, respectively, whereas postcontrast T1 was superior for the identification of chronic MI.74 Not surprisingly, ECV in infarcted regions is markedly elevated, typically ≥ 50%.33,34,75 Native T1 times are highest in the acute stage and tend to overestimate infarct size, consistent with higher edema content,74,75 and while they subsequently remain elevated, specificity is high but sensitivity is modest for the detection of chronic MI.76 T2 times are also elevated with acute MI (Figure 4), in which T2-mapping is again superior to standard T2-weighted imaging.50 T1 and T2 are reduced in the presence of microvascular obstruction and/or intramyocardial hemorrhage,50,75 and decreased native T1 in the MI core has been linked to an increased risk of subsequent death or hospitalization for heart failure.77
 and corresponding T2 maps (B and D) in an animal at baseline (A and B), and after experimentally induced myocardial infarction (C and D). Note the different signal intensity with increasing echo times in the anteroseptum after the infarct but not at baseline (asterisks). The T2 maps demonstrate normal T2 values in the anteroseptum at baseline, but markedly increased after myocardial infarction (white arrows). The color bars indicate the color-coded range of T2 values. Images courtesy of Dr. Javier Sánchez-González.")
Consecutive short axis views of a T2-mapping sequence with increasing echo times (A and C, from left to right and superior to inferior) and corresponding T2 maps (B and D) in an animal at baseline (A and B), and after experimentally induced myocardial infarction (C and D). Note the different signal intensity with increasing echo times in the anteroseptum after the infarct but not at baseline (asterisks). The T2 maps demonstrate normal T2 values in the anteroseptum at baseline, but markedly increased after myocardial infarction (white arrows). The color bars indicate the color-coded range of T2 values. Images courtesy of Dr. Javier Sánchez-González.
The feasibility of detecting ischemia during pharmacologic stress without contrast agents measuring changes in myocardial native T1 has been reported recently.78
Inflammatory CardiomyopathiesMyocarditisThe standard approach for the diagnosis of acute myocarditis on CMR relies on the combination of different techniques including T2-weighted imaging, early gadolinium enhancement, and LGE (Lake-Louise criteria).79 However, growing data demonstrate the superior diagnostic performance of myocardial mapping. T2 is abnormally elevated in acute myocarditis even in the absence of LGE or visually apparent wall motion abnormalities, and outperforms standard T2-weighted imaging.27 In 50 patients with suspected acute myocarditis (median time from clinical presentation, 3 days), native T1 time ≥ 990ms had 90% sensitivity and 91% specificity and accuracy for the differentiation from controls. It had higher sensitivity than T2-weighted imaging and LGE, which may be especially useful in detecting subtle focal disease and when gadolinium administration is not feasible.45 In another publication by the same group, native T1-mapping detected significantly larger areas of involvement than T2-weighted and LGE imaging, identified areas of injury where these techniques were negative, and improved diagnostic confidence in an additional 30% of cases.80 Similar findings of increased accuracy of native T1 vs Lake-Louise criteria and even ECV were reported in suspected myocarditis (median, symptom duration, 3 days) using a threshold of native T1 ≥ 1140ms at 3 T.81 In a more recent study, the same authors performed myocardial mapping in 34 patients with suspected acute myocarditis (median time also 3 days) as well as standard CMR and longitudinal strain quantification. Native T1- and T2-mapping demonstrated the highest accuracy (areas under the curve of 0.95 and 0.92, respectively), superior to ECV and standard criteria, which improved to 0.98 when native T1 and LGE were combined.32
Another investigation evaluated 104 patients with clinically diagnosed acute/subacute myocarditis (median time from symptom onset, 2 weeks) and presenting with either heart failure or chest pain. Extracellular volume provided the single best diagnostic accuracy (76%) compared with native T1- and T2-mapping (69% and 63%, respectively), which were in turn similar to Lake-Louise criteria (accuracies of 59%-70%). A stepwise use of LGE (highly specific) followed by global myocardial ECV (≥ 27%) if LGE was negative significantly improved the diagnostic accuracy in comparison with Lake-Louise criteria (90% vs 79%, P = .004).46 A report of 165 patients with clinically diagnosed myocarditis divided the population into those with acute (n = 61, median time from presentation, 5 days) and convalescent stages (n = 67; median, 6 months). While native T1-mapping showed the highest accuracy (99%) in the acute phase, again outperforming standard CMR, in the convalescent phase, LGE was superior (accuracy 94%). The authors demonstrated that acute myocarditis can be independently identified by native T1 > 5 standard deviations above the mean of the normal range, whereas convalescence was best defined by either abnormal native T1 > 2 standard deviations and/or the presence of LGE, with subsequent validation in an independent cohort.82 In 31 patients with new-onset heart failure (median time from presentation, 1 month), T2-mapping was able to distinguish between patients with and without histologically-proven inflammation with moderate accuracy (area under the curve = 0.78), whereas standard criteria, native T1, and ECV were not.51
Altogether, these finding suggests a potentially important role of myocardial mapping in the evaluation of myocarditis although, and similar to Lake-Louise criteria, the accuracy and usefulness of different indices are likely dependent on clinical presentation and stage of the disease.
OtherElevated native T1 and T2 times have been described in small series of patients with tako-tsubo cardiomyopathy.27,71 Similarly, more than half of 50 patients with proven extracardiac sarcoid demonstrated elevated T2 values regardless of the presence of LGE.83 After heart transplant, myocardial T2 lengthening can be a sign of ongoing or impending rejection, with normalization after immunosuppressive therapy.52,84
Preliminary studies indicate another potential use of CMR mapping for detecting cardiac involvement in autoimmune disorders. A series of 24 patients with systemic lupus erythematosus demonstrated increases in T2 times compared with controls, suggestive of subclinical myocardial inflammation.85 Other studies have reported increases in native T1 and ECV in rheumatoid arthritis and systemic scleroderma that correlate with markers of disease activity,86,87 as well as in lupus,88 independently of the presence of LGE. Whether these changes reflect inflammation, diffuse fibrosis, or both, is uncertain.
Infiltrative and Deposit CardiomyopathiesAmyloidosisIn cardiac amyloidosis, CMR often demonstrates a characteristic pattern of global, predominantly subendocardial LGE coupled with abnormal myocardial and blood-pool gadolinium kinetics.89 Although CMR is already highly accurate, T1-mapping can provide additional information (Figure 5).
 and postcontrast (B and D) T1 maps at 3 T in a patient without (upper row) and with cardiac amyloidosis (lower row). Note the increased native T1 and decreased postcontrast T1 in amyloidosis, translating into markedly increased extracellular volume (21% vs 46%, respectively).")
Native (A and C) and postcontrast (B and D) T1 maps at 3 T in a patient without (upper row) and with cardiac amyloidosis (lower row). Note the increased native T1 and decreased postcontrast T1 in amyloidosis, translating into markedly increased extracellular volume (21% vs 46%, respectively).
Native T1 is abnormally increased in different forms of cardiac amyloidosis. In 51 patients with systemic light-chain amyloid, myocardial T1 (1.5 T) was significantly elevated in those with cardiac involvement (1140 ± 61ms) compared with normal participants (958±20ms; P < .001). T1 was increased even when cardiac involvement was uncertain (1048 ± 48ms) or thought absent (1009 ± 31ms; P < .01 for both). A cutoff value of 1020ms was 92% accurate for identifying possible or definite cardiac involvement.90 Another series of 79 patients with light-chain and 85 with transthyretin amyloidosis demonstrated T1 increases in both types that were significant in comparison with controls and HCM patients (area under the curve = 0.85 against the latter). T1 time in transthyretin amyloidosis correlated with amyloid burden as determined by scintigraphy.91 A larger study92 confirmed these observations and the higher elevation of T1 in light-chain (1126 ± 70ms) compared with transthyretin amyloidosis (1101 ± 46ms; P < .05). As mentioned earlier, ECV is markedly elevated in amyloidosis, typically in the range of 40% to 70%,20,92–94 including segments without evident LGE or increased wall thickness.93 Again there seem to exist differences between amyloid subtypes, with higher ECV in the transthyretin variant (58 ± 6% vs 54 ± 7%; P = .001).92
Extracellular volume and native myocardial T1 correlate with markers of disease severity in amyloidosis, including wall thickness, systolic and diastolic dysfunction, electrocardiographic abnormalities, serum biomarkers, and functional class.90,92–94
Anderson-Fabry DiseaseAnderson-Fabry disease is a rare but underdiagnosed intracellular lipid disorder with associated LV hypertrophy. As opposed to other infiltrative disorders, native T1 is shortened but ECV remains normal, and the degree of reduction correlates with lipid content.95 A study evaluated patients with Anderson-Fabry disease (n = 44) or LV hypertrophy of other etiologies (n = 105), and healthy controls (n = 67). Native septal T1 was lower in Anderson-Fabry than in controls and was higher in hypertrophy (882 ± 47, 968 ± 32, and 1018 ± 74ms, respectively; P < .0001). There was no overlap between Anderson-Fabry and other forms of hypertrophy and, importantly, it was abnormal in genetically positive patients with normal wall thickness.96
HemosiderosisIron overload is another condition causing significant T1 shortening. Ferric iron alters the local magnetic field, usually characterized by the reduction in T2* (widely used in clinical practice).2 In the setting of myocardial iron overload, T1 also shortens, correlates strongly with T2*,97,98 and has been validated histologically in animal models.99 Native T1-mapping may therefore become an alternative method for cardiac iron detection (T1 < 900ms at 1.5 T) and quantification with the potential advantages of fewer image artifacts, improved identification of mild iron loading, and superior reproducibility.97 T2 also correlates with T2* and extent of iron deposition,99 and weaker (but significant) inverse associations have been described between T2* and ECV.98
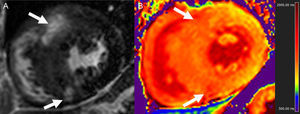
Hypertrophic CardiomyopathyIn a study of 130 HCM patients and 25 controls, T1-mapping was employed to evaluate both regional and diffuse patterns of myocardial fibrosis. Postcontrast T1 times were reduced in HCM (Figure 6), and while greater quantities of LGE were associated with reduced LV systolic function and less outflow tract obstruction, patients with lower postcontrast T1 had more severe diastolic impairment and dyspnea.59
 and corresponding native T1 map at 3 T (B) in a patient with hypertrophic cardiomyopathy. Note the increased T1 in the septum compared with the lateral wall, particularly in the areas of late gadolinium enhancement (arrows).")
Native T1 and ECV are also increased in HCM.34,37,65 Native T1 abnormalities have been reported in myocardial segments without LGE in HCM patients,37,65 although ECV was similar to that of healthy controls in 1 study.100 This may be explained by the concomitant presence of hypertrophic myocytes; thus, total ECV (ECV×myocardial mass) could be a better indicator of expansion in patients with HCM or amyloidosis.92 Extracellular volume and, particularly, native T1-mapping appear able to differentiate both HCM from hypertensive heart disease and sarcomere mutation carriers from normal controls, even in the absence of LV hypertrophy or LGE.42,101 These data provide additional support that fibrotic remodeling is triggered early in the disease process.
The ongoing Hypertrophic Cardiomyopathy Registry (NCT01915615), an international multicenter study planning to enroll 2750 HCM patients, is expected to provide important insights into the potential clinical value of T1-mapping in this disease.102
Congenital Heart DiseaseT1-mapping was performed in the systemic ventricle of 50 adults with various congenital abnormalities, demonstrating increased ECV, particularly in those with a systemic right ventricle and/or cyanotic disease.103 A recent publication also observed diffuse myocardial fibrosis in patients with repaired tetralogy of Fallot, and noted that biventricular ECV values were increased and positively correlated, likely secondary to an adverse interventricular interaction. Increased ECV was associated with both right ventricular volume overload and arrhythmia104 and may play a role in prognostication in these patients.105
Valvular Heart DiseaseAs shown in Table 3, several validation studies have demonstrated increases in native myocardial T1 and ECV in patients with aortic stenosis, with corresponding increases in interstitial fibrosis on histological samples. In young individuals with congenital aortic stenosis, ECV was higher than in normal participants and correlated with echocardiographic indexes of diastolic dysfunction.106 Although in that study ECV was not associated with stenosis severity, reports in older adults with degenerative disease have demonstrated such correlations, as well as associations with impaired LV diastolic and systolic performance.53,54,107
Regarding regurgitant lesions, a cross-sectional study compared 35 patients with asymptomatic moderate or severe primary degenerative mitral regurgitation and no class I indication for surgery with age- and sex-matched controls. Extracellular volume was increased in patients and was associated with increased LV and left atrial volumes, as well as reduced systolic function and peak oxygen consumption.108
PrognosisThe potential predictive significance of mapping indices is being actively explored. Early studies suggest ECV may be at least as prognostically meaningful as LV ejection fraction and highlight the role of myocardial interstitium in driving patient “vulnerability”.63,109 A large single-center series109 included 1172 consecutive patients without amyloidosis, HCM, or stress cardiomyopathy referred for CMR, and demonstrated an increased risk of death or hospitalization for heart failure over a median of 1.7 years (hazard ratio [HR] = 1.85 for every 5% increase in ECV; 95%CI, 1.50–2.2.7), adjusting for multiple confounders including age, LV ejection fraction, and MI size. The same group reported comparable prognostic significance in diabetics.63 In another series of 473 consecutive patient referred for CMR and without HCM, amyloid, or Anderson-Fabry disease, ECV was a predictor of subsequent cardiovascular events although it did not remain significant after adjustment for clinical variables.60 Extracellular volume calculated without direct hematocrit measurement has also shown an ability to predict mortality (HR = 1.9 for every 5% increase in ECV; 95%CI, 1.55-2.31).16
The above-mentioned studies have studied the associations of T1-mapping in unselected populations referred for CMR. More recently, a prospective, multicenter registry identified native T1 as the strongest independent predictor of mortality and heart failure hospitalization in 637 patients with nonischemic DCM followed-up for a median of 22 months.110 Another prospective study of 100 patients with ischemic and nonischemic DCM undergoing defibrillator implantation identified native T1 as an independent predictor of appropriate antiarrhythmic therapy on follow-up.111 In a prospective study of 100 subjects with heart failure with preserved ejection fraction, postcontrast T1, left atrial area, and pulmonary vascular resistance were significantly associated with outcome (death or heart failure hospitalization).57 In cardiac amyloidosis, visual determination of abnormal postcontrast myocardial T1 and contrast kinetics on a look-locker sequence was the strongest predictor of mortality (adjusted HR = 5.5; 95%CI, 2.7-11.0; P < .0001) in 90 patients with suspected cardiac involvement.112 In a recent series of 100 patients with systemic light-chain amyloidosis followed-up for a median of 23 months, both native T1 (> 1044ms at 1.5 T) and ECV (> 45%) were markers of increased risk of death, and ECV remained significantly associated with mortality in multivariate models (adjusted HR = 4.4; 95%CI, 1.4-14.4; P = .01).94
Although demonstration of edema with standard T2-weighted imaging has been linked to outcomes in acute coronary syndromes,113 no study has yet explored the potential prognostic implications of T2-mapping.
FUTURE DIRECTIONSMyocardial mapping with CMR is rapidly evolving into a useful approach for the diagnosis and characterization of various cardiomyopathies, providing objective, quantitative measurements even without the need for contrast agents. Nonetheless, a number of challenges still remain that need to be met before widespread clinical implementation. As previously discussed, different approaches for the quantification of myocardial T1 and T2 times have specific strengths and limitations and provide slightly different values (Table 1 and Table 2). Therefore, myocardial mapping will need to be standardized in a fashion similar to LGE imaging. In the meantime, results cannot necessarily be extrapolated across sequences, vendors, or sites, and centers performing T1- and T2-mapping should develop their own set of normative, reference values.6,15 Most sequences are sensitive to the presence of arrhythmia and there is also potential for errors from acquisition or analysis6,24,48; nonetheless, there is good interstudy and interscanner reproducibility, particularly for T1-mapping29,35,55,114 but also for T2-mapping.26,48 This indicates potential for use in clinical trials,115 and the feasibility of testing the effect of therapies has already been shown in animal models.116 It must be acknowledged, however, that myocardial mapping today is still not widely available, remains largely a research application, and in the United States it is not yet approved for clinical use.
Similar to LGE, abnormalities in myocardial relaxation times are nonspecific. While T2 lengthening is largely reflective of inflammation, and the number of diseases leading to native T1 shortening is limited, increases in native T1 and ECV can be found in virtually any cardiac disorder (Table 4). Thus, myocardial maps today are of limited use as stand-alone techniques and need to be interpreted within the clinical context. In addition, the diagnostic ability of myocardial mapping has often been tested against healthy controls, whereas in clinical practice differential diagnosis is more often needed in patients presenting with similar symptoms to those with the potential index disease. Finally, more and larger studies are needed to establish the incremental diagnostic and prognostic value of CMR mapping when accounting for other clinical variables, as well as the potential for guiding therapeutic interventions.
CONFLICTS OF INTERESTNone declared.