Keywords
INTRODUCTION
Left ventricular function is of prognostic value in many heart diseases. Traditionally, global systolic function is assessed using the ejection fraction. However, to date, a parameter has not been available to quantify regional systolic function. Currently, methodologies based on the movement of myocardial fibers are available that can measure deformation or strain (S) and the rate of deformation or strain rate (SR).1 Among them, 2-dimensional speckle-tracking echocardiography identifies speckles on the myocardial fibers and tracks their movements frame by frame. Thus, S is determined by the displacement of some myocardium speckles relative to others2,3 and SR is deformation over time.
Recently, a method called Vector Velocity Imaging (VVI) has been developed that uses speckle tracking. This has been used in several clinical settings4,5 and has recently been validated in situations involving ischemia.6-9 However, to date, the S and SR values calculated with this method in a healthy population have not been described.
This study was designed to determine these parameter values in healthy subjects, time-to-peak normalized by the length of the cycle (TPN) and their reproducibility.
METHODS
A total of 116 healthy volunteers were included who were recruited from hospital staff who wanted a cardiovascular health examination and agreed to participate. The study was approved by the hospital ethics committee.
The study only included asymptomatic subjects not under treatment, with no history of heart disease, and with normal physical examination, blood pressure (BP), ECG and Echocardiogram-Doppler ultrasound values. Three subjects were excluded due to BP ≥140/80 mmHg and 8 subjects due to poor echocardiographic image quality.
Echocardiographic Study
The echocardiographic study was performed using a Siemens Sequoia C-512 (Siemens Medical Solutions, Mountain View, Calif., USA) equipped with a 2.5 MHz-4 MHz transducer. Images were obtained in the transverse plane at the level of the papillary muscles and apical 4-chamber view with second harmonic, high temporal resolution imaging (60-100 images/s) and a high-quality ECG signal. The images were stored in digital format for subsequent offline analysis.
Analysis Using Vector Velocity Imaging
The echocardiographic images were processed using Syngo VVI software (Siemens Medical Solutions). The peak systolic values of S and SR for each segment were analyzed. The time from QRS onset to peak was measured (Figure 1). The time-to-peak/length of the cycle relationship was called time-to-peak normalized (TPN). The mean value of the 6 segments was considered to be the global value of the ventricle.

Figure 1. Circumferential strain (A) and strain rate (B) values of the 6 segments analyzed in the transverse plane. Lc indicates length of the cycle; Tp, time-to-peak; TPN, time-to-peak normalized calculated as Tp/Lc.
Variability Study
Using VVI, the ventricles of 20 subjects were assessed by 2 expert echocardiologists blinded to the results of each other. One of the experts repeated the assessment 3 weeks later. Data of all the segments were included.
Statistical Analysis
The quantitative variables are expressed as mean (standard deviation). The Shapiro-Wilk test was used to determine the normality of the distribution. The Student t test (normal distribution) was used to analyze differences between 2 independent samples or the Mann-Whitney-Wilcoxon U test otherwise. The coefficient of variability was used to study intra-observer and inter-observer variability. This was calculated as the standard deviation expressed as a percentage of the mean value of 2 sets of paired observations. A P-value <.05 was used as cutoff for statistical significance. The statistical calculations were performed using the SPSS.12 statistical package (SPSS, Chicago, Ill., USA).
RESULTS
The demographic and echocardiographic characteristics of the 105 subjects are shown in Table 1.

Strain
The values were obtained by examining the images of a complete cardiac cycle. The circumferential S value was obtained from images acquired in the transverse plane and the longitudinal S value from images acquired in the apical view. The mean peak values of each segment and of the global value of the ventricle, as well as the time-to-peak and its relation to the duration of the cycle are shown in Table 2.

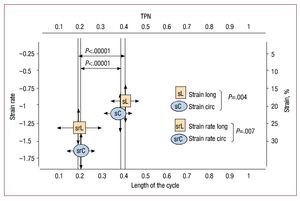
The mean circumferential S values were greater than the longitudinal S values (22.20 [4.81] vs 19.84 [4.59]; P=.004). Furthermore, the circumferential S values of the lower segments was greater than those of the anterior segments (23.92 [7.04] vs 20.49 [6.69]; P<.0001).
Strain Rate
The values obtained are shown in Table 2. The mean circumferential SR values were greater than those of the mean longitudinal SR (1.64 [0.48] vs 1.30 [0.49]; P<.0001) (Figure 2). The inferior segments had greater circumferential SR values than those of the anterior segments (1.73 [0.62] vs 1.57 [0.58]; P=.007).

Figure 2. Strain and strain rate values and their corresponding time-to-peak normalized in a population of 105 healthy subjects. It can seen that the time-to-peak normalized values of the strain rate are significantly shorter than those of strain. sC indicates circumferential strain; sL, longitudinal strain; srL, longitudinal strain rate; srC, circumferential strain rate; TPN, time-to-peak normalized.
There were no differences between sexes in any of the parameters studied.
Reliability of the Method
Intra-observer and inter-observer variability were as follows: circumferential S, 13.42% and 15.5%; longitudinal S, 15.96% and 15.79%; circumferential SR, 14.78% and 13.47%; and longitudinal SR, 17.9% and 15.02%.
DISCUSSIONThe S and SR values could be useful to quantify regional ventricular function. This study provides normalized data quantified as spatial and temporal values. The addition of the variable time to TPN could be useful to characterize various pathologies such as myocardial ischemia.
Experimental studies10-12 and clinical studies13,14 have demonstrated that ischemia induces reductions and delays in deformation in ischemic segments. Thus, a parameter such as TPN, whose normal values are reported in this study, could be useful to define late strain in a simple, noninvasive and easily reproducible manner. Future studies should assess its real potential. In addition, there were no differences between sexes in any of the parameters studied. Reproducibility was moderate. Future improvements in image definition and the algorithms that delineate the myocardium-blood interface could improve reproducibility.
Limitations
In total, 8 subjects were excluded from the study due to poor echocardiographic image quality (7%), and thus 93% completed the study. Subject age ranged between 18 years and 60 years, and so the data cannot be extrapolated to subjects younger or older than these ages, respectively.
In conclusion, we provide time-to-peak values normalized for S and SR that could serve as a reference to define late contraction as marker of ischemia. No differences were observed between sexes. Intra-observer and inter-observer variability were moderate and remain open to improvement.
Correspondence: Dra. I. Rodríguez Bailón.
Angel Guimerá, 2, P3, 1-D. 29017 Málaga. Spain.
E-mail: irodriguezbailon@gmail.com
Received February 23, 2009.
Accepted for publication October 7, 2009.