The echocardiographic technology known as three-dimensional wall motion tracking offers three-dimensional images of the myocardium and provides multiple measures of deformation, one of which is known as “area strain” (AS), which combines left ventricular longitudinal and circumferential deformations. Our aim was to describe the normal maximum systolic reference AS value in a sample of healthy subjects. Sixty consecutive subjects without known cardiovascular risk factors or diseases were enrolled, and left ventricular AS was measured. Overall mean AS was –38.87±5.89%. Mean values at the level of the basal, middle, and apical segments were –38.42%±7.58%, –38.74%±6.34%, and −43.18%±12.81%, respectively. Thus, our results show for the first time the reference values for AS in healthy subjects.
Keywords
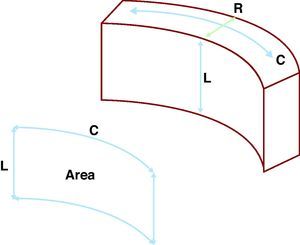
The evaluation and quantification of left ventricular myocardial deformations are mainstays in the assessment of the majority of echocardiographic examinations. Normally, this evaluation is subjective, which implies a significant amount of intra and interobserver variability, as well as a major learning curve. Recently, three-dimensional echocardiography (3D-Echo) has been incorporated into routine clinical practice in many echocardiography laboratories, as it provides many advantages in the evaluation and study of heart diseases.1, 2 A new technology called three-dimensional wall motion tracking (3D-WMT) is capable of providing three-dimensional (3D) images of the myocardium and obtains multiple measures of deformation, allowing for a complete assessment in very little time.3, 4 Among these parameters, area strain (AS) stands out as a particularly novel method with a high potential for clinical applications. This new parameter combines an analysis of both the longitudinal and circumferential deformation of the left ventricle. This provides an estimate of the subendocardial surface deformation, which is inversely proportional to the radial deformation (systolic thickening and diastolic thinning) of the ventricular wall, and is the first area of the endocardium to be affected in several different cardiopathies (Figure 1). In other words, 3D tracking of myocardial displacement can be broken up into the 3 spatial axes: longitudinal, circumferential, and radial, in the case of the left ventricular myocardium. Comparing the displacement of 2 different points, we can obtain information regarding myocardial deformation or strain in each of these 3 different directions. By combining 2 of these directions, we can observe a surface. By combining longitudinal and circumferential deformation in a given segment of the myocardium, we can obtain the deformation of the subendocardial surface, which is inversely proportional to the deformation of the myocardium in the third dimension, in this case, the radial one. Unfortunately, we still do not have reliable reference values for this parameter.

Figure 1. Theoretical basis for the area strain parameter. The myocardium is incompressible. As such, during systole, as the longitudinal length (L) decreases along with the circumferential dimension (C), the radial dimension (R) must increase, with the opposite occurring during diastole. Area strain is a parameter that combines longitudinal and circumferential deformations, thus assessing the percentage change to the endocardial surface. This parameter is potentially easier to determine and more sensitive to pathological changes than an evaluation of the radial deformation.
Our objective is to describe the maximum normal systolic reference value of AS in a sample of healthy subjects.
METHODS Study PopulationWe recruited 60 consecutive subjects with no known cardiovascular risk factors or diseases. The participants were all hospital employees or patients without heart-related diseases. All were informed as to the diagnostic techniques that were to be employed and gave their consent. To determine the diagnostic power of the study variable, we also included a group of 30 patients with hypertension of at least 2 years duration and without any other known heart disease.
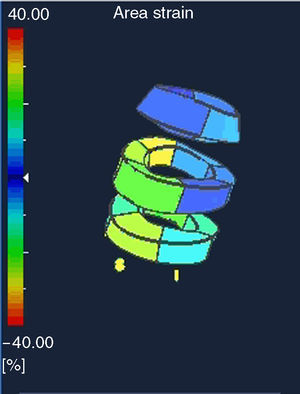
Two-Dimensional and Three-Dimensional Echocardiographic StudyAll patients underwent a two-dimensional echocardiographic examination, followed by a 3D-Echo examination using an ArtidaTM machine (Toshiba Medical Systems, Japan). For the two-dimensional (2D) examination, we used a PST-30SBT 1-5MHz probe, and for the 3D exam, a PST-25SX 1-4MHz (Toshiba Medical Systems, Japan). The temporal resolution of the 3D examination varied between 17 and 22 volumes per second. The 3D data matrix was stored in a digital system. More details regarding data acquisition and analysis were previously published (Figure 2).4, 5 We obtained the total maximum systolic AS value for the left ventricle semi-automatically, as well as the mean value for each segment (basal, middle, and apical).

Figure 2. Three-dimensional representation of the three-dimensional data matrix used for assessing total and segmental area strain values. This is a doughnut-type representation of the left ventricle with 3 levels: basal, middle, and apical.
Statistical MethodsWe used PSAW 13.0 statistical software for all analyses (SPSS Inc., Chicago, Illinois, United States). Quantitative variables have been expressed as mean±standard deviation. Qualitative data have been shown as absolute numbers (percentages). Data were compared using chi-square tests and Student's t-tests. The measurements for AS in the first 20 patients were repeated, both by a second observer and by the first observer a second time, in order to analyze the inter- and intraobserver reproducibility of the results using an intraclass correlation coefficient. Findings are represented graphically using the Bland-Altman method. We confirmed a normal data distribution using the Kolmogorov-Smirnov test.
RESULTSWe studied 60 patients, with a mean age of 38.37±14.56 years, 31 of whom were male (51.7%). No patients were excluded due to a poor acoustic window.
The values for the echocardiographic variables are shown in Table 1. This table also shows the AS values obtained. The mean maximum systolic value of AS for the left ventricle was –38.87 ± 5.89%. The mean values in the basal, middle, and apical segments were –38.42±7.58%, –38.74±6.34%, and –43.18±12.81%, respectively. The standard deviations for these values are shown in Table 1, along with the significantly different results for these variables in hypertensive patients. Mean AS values by segment are shown in Table 2.
Table 1. Baseline Characteristics.
| Variable | Control group | AHT group | P |
| Male | 31 (51.7) | 20 (66.7) | .1 |
| Age (years) | 38.37±14.56 | 41.93±14.62 | .28 |
| Interventricular septal thickness (mm) | 8.73±1.69 | 11.31±2.3 | <.001 |
| Posterior wall (mm) | 7.96±2.3 | 9.24±3.5 | <.001 |
| LVTDD (mm) | 47.02±6.21 | 51.32±5.24 | <.001 |
| LVTSD (mm) | 29.4±5.63 | 31.32±7.42 | <.001 |
| LVTDV (ml) | 105.12±31.18 | 115.47±21.34 | <.001 |
| LVTSV (ml) | 35.06±15.29 | 37.65±12.64 | .27 |
| Left atrial volume index (ml/m2) | 16.93±6.87 | 27.34±7.98 | <.001 |
| Right atrial volume index (ml/m2) | 16.65±7.44 | 19.56±8.45 | <.001 |
| E (m/s) | 0.86±0.2 | 0.71±0.28 | <.001 |
| A (m/s) | 0.77±0.8 | 0.92±0.35 | <.001 |
| Ep (cm/s) | 6.80±1.64 | 7.51±0.56 | .22 |
| Total AS (%) | –38.87±5.89 | –23.47±4.2 | <.001 |
| Total ASSD (%) | 9.23±2.81 | 9.8±3.5 | .46 |
| Basal segment AS (%) | –38.42±7.58 | –24.29±5.4 | <.001 |
| Basal segment ASSD (%) | 8.99±3.76 | 9.9±3.5 | .27 |
| Middle segment AS (%) | –38.74±6.34 | –22.85±4.33 | <.001 |
| Middle segment ASSD (%) | 7.17±3.22 | 7.5±3.03 | .63 |
| Apical segment AS (%) | –43.18±12.81 | –24.5±6.7 | <.001 |
| Apical segment ASSD (%) | 7.39±5.74 | 8.32±6.21 | .66 |
| Non-visualized segments (no) | 3.7±1.9 | 3.58±1.79 | .18 |
| Non-visualized basal segments (no) | 0.08±0.4 | ||
| Non-visualized middle segments (no) | 0.4±0.76 | ||
| Non-visualized apical segments (no) | 3.2±1.4 |
AHT, arterial hypertension; AS, area strain; ASSD, area strain standard deviation; Ep, E prime (mean Doppler tissue imaging of mitral annulus); LVTDD, left ventricle telediastolic diameter; LVTDV, left ventricle telediastolic volume; LVTSD, left ventricle telesystolic diameter; LVTSV, left ventricle telesystolic volume.
Data are expressed as no. (%) or mean±standard deviation.
Table 2. Mean Area Strain Values by Segment.
| Segment | AS, % | Segment | AS, % | Segment | AS, % | Segment | AS, % |
| Basal anteroseptal | –37.05 | Basal lateral | –39.4 | Mid inferior | –45.05 | Apical septal | –41.98 |
| Basal inferoseptal | –36.9 | Basal anterior | –42.1 | Mid posterior | –39.98 | Apical inferior | –46.14 |
| Basal inferior | –39.32 | Mid anteroseptal | –37.45 | Mid lateral | –37.21 | Apical lateral | –39.65 |
| Basal posterior | –37.45 | Mid inferoseptal | –38.52 | Mid anterior | –36.25 | Apical anterior | –43.84 |
AS, area strain.
We must point out that 3.7±1.9 segments were not visualized, and therefore not analyzed. Few basal segments were not visualized; the numbers increased for middle segments and again for apical segments (Table 1).
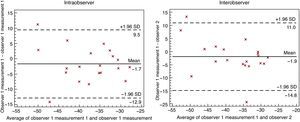
The intra- and interobserver variability analyses (Table 3) were quite acceptable, with intraclass correlation indices >0.7, except for interobserver variability in the apical segments, which was below 0.7 and even reached 0.27 (Table 3). The Bland-Altman figures representing the level of intra- and interobserver concordance are shown in Figure 3.
Table 3. Interobserver and Intraobserver Variability.
| ICC (95% CI) | P | |
| Intraobserver | ||
| Total AS | 0.74 (0.57-0.85) | <.001 |
| Basal AS | 0.76 (0.6-0.86) | <.001 |
| Middle AS | 0.71 (0.52-0.83) | <.001 |
| Apical AS | 0.64 (–1.01-0.94) | .12 |
| Interobserver | ||
| Total AS | 0.76 (0.29-0.92) | .005 |
| Basal AS | 0.78 (0.33-0.92) | .004 |
| Middle AS | 0.84 (0.5-0.95) | .001 |
| Apical AS | 0.27 (–2.23-0.84) | .332 |
AS: area strain; CI: confidence interval; ICC: intraclass correlation coefficient.

Figure 3. Bland-Altman graphs representing intra- and interobserver concordance of the calculation for area strain. SD, standard deviation.
DISCUSSIONThe results from this study have for the first time established reference values for the new parameter denominated AS, which is obtained using 3D-WMT technology. This parameter could prove particularly useful in the analysis of various heart diseases, and may become an accurate and early marker for myocardial damage, since the subendocardial layer of the myocardium, the region analyzed by this technique, is one of the earliest and most severely affected areas in several heart conditions. The study of ventricular myocardial displacement has been the object of special interest since Torrent-Guasp6 described the structure of the myocardium (“el miocardio ventricular configura una banda extendida desde la raíz de la arteria pulmonar a la raíz de la aorta que delimita, describiendo en el espacio una helicoide, dos cavidades, los llamados ventrículos”[the ventricular myocardium consists of a band that extends from the root of the pulmonary artery to the root of the aorta, which it delimits, creating a helical space with two cavities, called the ventricles]). Understanding the spatial orientation of these muscle fibers allows (still theoretically) the early detection of myocardial damage before the body's compensatory mechanisms can return the classically used evaluation parameters of systolic function to normal levels, as has been suggested in previous studies.5 From a theoretical standpoint, this new parameter, AS, should be more sensitive in detecting anomalies located in the subendocardium, since it deals with a measurement of the surface that combines 2 different longitudinal variables. However, more studies must be carried out in order to validate this hypothesis.
The relevance of the findings from our study lies in the fact that, until now, no standard reference values have been published for this variable. Without these data, the interpretation of clinical results is very limited. In light of the data presented here, we hope that AS can become a commonly used parameter in any echocardiographic laboratory.
The results from this study have provided reference values and an estimation of the variability of AS measurements, as well as the level of concordance in repeated measurements taken by the same observer and by different observers. The fact that both intra- and interobserver concordance was progressively lower from basal to apical segments is interesting. This finding could be explained by the greater number of segments with a lower quality echocardiogram in the apical area, which either must be excluded or not evaluated at the same level of quality as those in the middle and basal segments.
It is also important to point out that one of the main advantages of using parameters derived from 3D-WMT technology is the speed and ease of analyzing the data. As our group has previously published,4 the use of 3D-WMT represents a significant time savings compared to the use of technologies that can only track myocardial tissues in 2D.
LimitationsThe primary limitation to this technology is that the system used to analyze AS in our study is currently the only commercially available system. In addition, the slightly low frame rate that this system employs could be a source of criticism. However, we must emphasize that no other techniques exist that could be considered as a reference method for AS.
In light of our results, we can conclude that left ventricular subendocardial deformation can be studied using the area strain obtained using 3D-WMT technology, providing both quick and reproducible results. Our results show, for the first time, reference values for AS in healthy subjects.
CONFLICT OF INTERESTDr. Leopoldo Pérez de Isla has received occasional per diem, transportation, and lodging reimbursements from Toshiba Medical Systems Europe.
Received 29 November 2010
Accepted 12 March 2011
Corresponding author: Unidad de Imagen Cardiológica, Hospital Carlos III, Sinesio Delgado 10, 28029 Madrid, Spain. leopisla@hotmail.com