Left atrial dysfunction in aortic stenosis may precede atrial enlargement and predict the occurrence of atrial fibrillation (AF). To test this hypothesis, we assessed left atrial function and determined its impact on the incidence of AF after aortic valve replacement.
MethodsA total of 149 severe aortic stenosis patients (74±8.6 years, 51% men) with no prior AF were assessed using speckle-tracking echocardiography. Left atrial function was evaluated using peak atrial longitudinal strain (PALS), peak atrial contraction strain (PACS), and phasic left atrial volumes. The occurrence of AF was monitored in 114 patients from surgery until hospital discharge.
ResultsIn multiple linear regression, PALS and PACS were inversely correlated with left atrial dilation, left ventricular hypertrophy, and diastolic function. Atrial fibrillation occurred in 36 patients within a median time of 3 days [interquartile range, 1-4] after aortic valve replacement. In multiple Cox regression, PALS and PACS were independently associated with the incidence of AF (HR, 0.946; 95%CI, 0.910-0.983; P=.005 and HR, 0.932; 95%CI, 0.883-0.984; P=.011, respectively), even after further adjustment for left atrial dimensions. Both reduced PALS and PACS were associated with the incidence of AF in patients with nondilated left atria (P value for the interaction of PALS with left atrial dimensions=.013).
ConclusionsIn severe aortic stenosis, left atrial dysfunction predicted the incidence of postoperative AF independently of left atrial dilation, suggesting that speckle-tracking echocardiography before surgery may help in risk stratification, particularly in patients with nondilated left atria.
Keywords
New-onset atrial fibrillation (AF) is the most common complication after cardiac surgery, occurring in 15% to 45% of procedures.1 It is associated with longer hospital stay, increased morbidity, and 6-month mortality.2,3
The pathogenesis of postoperative AF is not completely understood but is related to a combination of perioperative factors, such as pericardial inflammation, increased sympathetic tone and volume overload, and a vulnerable anatomical and functional substrate in the left atrium (LA).4–6
In patients with severe aortic stenosis, the long-standing disturbances in left ventricular structure and function lead to increased LA pressure, cavity dilation, and impaired LA function.7,8 This structural and functional LA remodeling can increase the risk of atrial arrhythmias, both before and after surgery.9–11
Speckle-tracking echocardiography (STE) is a feasible, reproducible and easy-to-perform method to assess LA function, which overcomes several pitfalls of previously used techniques and has a stronger prognostic value.12–15 STE analysis can be used to measure LA longitudinal strain, which is the first useful parameter for functional analysis of the LA.16 STE allows the determination of phasic LA volumes, which can also be used to evaluate atrial function.8,12,17 LA strain is associated with the amount of fibrosis in the atrial wall and may even predict the risk of new-onset AF in patients with aortic stenosis.5,6,18 However, the role of LA function analysis for risk assessment of patients undergoing aortic valve replacement (AVR) has not yet been established.
In this study, we aimed to characterize LA function using STE in patients with severe aortic stenosis and to determine its value as a predictor of new-onset AF after AVR. In a secondary analysis, we assessed whether LA dysfunction predicts AF among patients with nondilated LA.
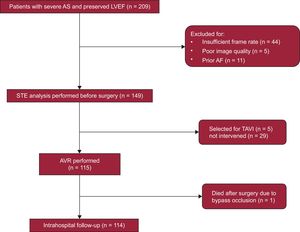
METHODSStudy PopulationThe EPICHEART (“The influence of EPICardial adipose tissue in HEART diseases”) study is an observational/translational study investigating the mechanisms underlying the association of epicardial adipose tissue with heart diseases, including coronary artery disease, cardiac remodeling, and AF. The study population included patients with severe aortic stenosis (aortic valve area<1cm2 or <0.6cm2/m2 by transthoracic echocardiography) referred to our institution for AVR from October 2014 to September 2016. Exclusion criteria were prior atrial flutter or AF, coexisting moderate-to-severe aortic valve regurgitation or mitral valve disease, bicuspid aortic valve, left ventricular dilatation (end-diastolic volume index >75mL/m2) or left ventricular ejection fraction <55%, chronic renal failure stage 3-5, moderate-to-severe chronic obstructive pulmonary disease, and active malignancy. A total of 209 echocardiograms were screened for adequate imaging quality to perform STE analysis. We excluded those with insufficient frame rate (n=44), poor imaging quality (n=5), and newly-diagnosed AF before surgery (n=11). Finally 149 patients were included in this analysis. The study flowchart is presented in Figure 1. All patients followed a prespecified examination including anthropometric, clinical, echocardiographic, computed tomographic, and invasive coronary angiographic evaluation. Comorbidities were collected, including New York Heart Association class, hypertension, dyslipidemia, diabetes, obesity (reflected by body mass index), smoking status, chronic obstructive pulmonary disease, stroke, and peripheral arterial disease, as well as ongoing medication. All participants provided written informed consent, and the study was approved by the institutional ethics committee and the national committee for data protection.
Standard Transthoracic Echocardiographic 2-dimensional Analysis
All echocardiographic examinations were acquired by a single experienced operator using an ultrasound system (iE33, Philips Medical Systems, Best, The Netherlands) equipped with an S5-1 transducer, and images were digitally stored for subsequent offline analysis. Cardiac chamber dimensions, volumes, and left ventricular mass were measured as recommended.19 Mitral inflow velocities were assessed using pulsed-wave Doppler in the apical 4-chamber view, with the sample placed at the tips of the mitral leaflets; velocities were recorded at end-expiration. Pulsed-wave tissue-Doppler velocities were acquired at end-expiration, in the apical 4-chamber view, with the sample positioned at the septal and lateral mitral annulus: systolic (S’), early-diastolic (E’) and late-diastolic (A’) velocities were measured. For all parameters, the average of 3 consecutive heartbeats was recorded. Systolic function was assessed by evaluating left ventricular ejection fraction, using the modified Simpson rule from biplane 4- and 2-chamber views, and systolic myocardial annular tissue velocity (S’ septal, S’ lateral and S’ mean).
Speckle-tracking Echocardiography Analysis of Left Atrial FunctionTwo-dimensional grey-scale images were acquired in the apical 4-chamber view, with frame rates between 50-100 frames/sec.20 The LA endocardial border was manually traced and the analysis was performed using Velocity Vector Imaging software (Syngo VVI 2.0, Siemens Medical Solutions USA Inc) by an observer blinded to the clinical data, as previously described.12,13 The software divides the LA into 6 segments, and tracking quality was visually checked in all segments; patients with inadequate tracking in more than 2 segments were excluded. Then, the operator manually adjusted segments with inadequate tracking. We extracted the following LA phasic volumes from time-volume curves based on displacement of LA endocardial pixels,: maximum LA volume, minimum LA volume, and pre-A wave LA volume, as previously described.17 LA function indexes were assessed from these volumes, using several formulas validated in previous studies.8,12 LA reservoir function was characterized by using LA emptying fraction ([maximum LA volume – minimal LA volume]/maximum LA volume x 100), and LA expansion index ([maximum LA volume – minimum LA volume]/minimum LA volume x 100). We also determined LA conduit function using LA passive emptying volume as (maximum LA volume – pre-A wave LA volume), LA passive emptying fraction ([maximum LA volume – pre-A wave LA volume]/maximum LA volume), and LA conduit volume (left ventricular stroke volume – [maximum LA volume – minimum LA volume]). Finally, we assessed LA booster pump function using LA active emptying fraction ([pre-A wave LA volume – minimum LA volume]/pre-A wave LA volume), and LA active emptying volume (pre-A wave LA volume – minimum LA volume).
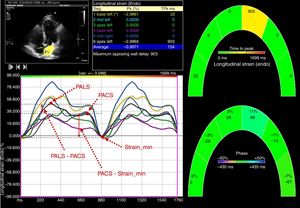
Left atrium myocardial strain was measured using the same software, by tracking and comparing the relative position of speckles throughout the cardiac cycle. Strain curves were displayed for each of the 6 segments automatically generated by the software. Zero strain was set at the QRS onset. Using this reference point, the LA strain pattern consists of a positive wave that peaks at the end of ventricular systole, followed by a decrease after the opening of the mitral valve and, after a plateau, by a second decrease that represents atrial contraction. From the average of the strain curves of all segments, we evaluated peak LA strain at the end of ventricular systole (PALS), which is a measure of LA reservoir function,12 peak atrial strain before atrial contraction (PACS), which can be considered a marker of LA booster pump function,12 and minimal strain, which is measured at the end of atrial contraction. The LA passive emptying strain was then calculated as (PALS – PACS), which is a measure of LA conduit function, and LA active emptying strain as (PACS – minimal strain).20 The measurement of LA strain in a patient with severe aortic stenosis is illustrated in Figure 2.

To evaluate the reproducibility of PALS measurements, 10 patients were randomly selected and a Bland-Altman analysis was performed to assess intra- and interobserver agreements. Mean differences±2 standard deviations were–0.03±2.3% and 0.17±1.75% for intra- and interobserver agreements, respectively.
New-onset Atrial FibrillationAll patients underwent continuous electrocardiographic telemetry monitoring from hospital admission until discharge. Regardless of rhythm, routine rhythm strips were collected every 2hours in the intensive cardiac care unit, and every 8hours in the telemetry units. If an abnormality occurred, rhythm strips were printed and attached to the patient's chart, and a 12-lead electrocardiogram was performed to confirm uncertain findings. Additionally, a 12-lead electrocardiogram was routinely performed preoperatively, immediately after the procedure, and on the first and second days after surgery. AF or atrial flutter episodes were collected by reviewing electrocardiographic rhythm strips, 12-lead electrocardiographic tracings, nursing and physician notes, and daily medication lists.
Statistical AnalysisContinuous variables are reported as mean±standard deviation for normally distributed data, or median [quartile (Q) 2] and 25th (Q1) and 75th (Q3) percentiles for nonnormally distributed data. Discrete variables are shown as frequencies and percentages. First, we performed a univariate linear regression to identify the clinical and echocardiographic variables correlated with PALS, PACS, LA maximum and LA minimum volumes. Subsequently, we adjusted these associations for the effect of other variables that can be simultaneously related to aortic stenosis and LA function, including age, sex, hypertension, diabetes mellitus, body mass index, aortic valve area index, and use of beta-blockers or renin-angiotensin-aldosterone system antagonists. Cox proportional hazards regression was performed to assess the association between LA strain and volumes with the incidence of AF after AVR; adjusted models were performed, controlling for preoperative medication with beta-blockers or statins, type of procedure (AVR alone vs AVR combined with coronary artery bypass grafting), total number of coronary bypasses, and prosthetic material (biological vs mechanical valve), as these variables are known to influence the risk of AF after surgery (model 1). We further adjusted the association between LA strain and new-onset AF for LA size measures (models 2-6). Receiver-operating characteristic (ROC) analysis was used to identify the best PALS, PACS, LA maximum volume, LA minimum volume, and LA pre-A cutoffs to predict AF after AVR. Kaplan-Meier curves for AF cumulative incidence were estimated and compared between patient groups using the log-rank test. As a secondary analysis, we performed a stratified Cox regression analysis for the association of PALS and PACS with the risk of AF according to different groups of LA dimensions: normal (LA diameter ≤ 40mm) and dilated (LA diameter> 40mm) with a test for interaction. The analysis was performed using STATA software (version 13.1, StataCorp LP, Texas, USA). P values are 2-sided, and values <.05 indicated statistical significance.
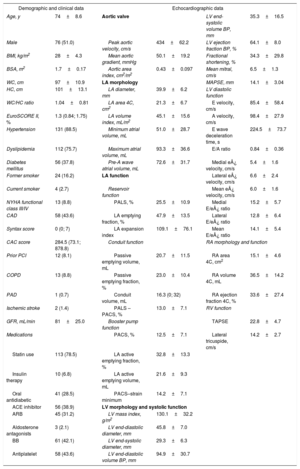
RESULTSPatients CharacteristicsWe included 149 elderly patients (74±8.6 years; 51% male) with severe aortic stenosis, preserved ejection fraction (mean left ventricular ejection fraction 64%±8.0%) and a median EuroSCORE II of 1.3 (Q1: 0.84; Q3: 1.75). Mean LA diameter was 39.9±6.2mm, and 63 (55.3%) patients had a dilated LA. Table 1 shows the general characteristics of our population.
Overall Patient Characteristics (n=149)
| Demographic and clinical data | Echocardiographic data | ||||
|---|---|---|---|---|---|
| Age, y | 74±8.6 | Aortic valve | LV end-systolic volume BP, mm | 35.3±16.5 | |
| Male | 76 (51.0) | Peak aortic velocity, cm/s | 434±62.2 | LV ejection fraction BP, % | 64.1±8.0 |
| BMI, kg/m2 | 28±4.3 | Mean aortic gradient, mmHg | 50.1±19.2 | Fractional shortening, % | 34.3±29.8 |
| BSA, m2 | 1.7±0.17 | Aortic area index, cm2/m2 | 0.43±0.097 | Mean mitral, cm/s | 6.5±1.3 |
| WC, cm | 97±10.9 | LA morphology | MAPSE, mm | 14.1±3.04 | |
| HC, cm | 101±13.1 | LA diameter, mm | 39.9±6.2 | LV diastolic function | |
| WC/HC ratio | 1.04±0.81 | LA area 4C, cm2 | 21.3±6.7 | E velocity, cm/s | 85.4±58.4 |
| EuroSCORE II, % | 1.3 (0.84; 1.75) | LA volume index, mL/m2 | 45.1±15.6 | A velocity, cm/s | 98.4±27.9 |
| Hypertension | 131 (88.5) | Minimum atrial volume, mL | 51.0±28.7 | E wave deceleration time, s | 224.5±73.7 |
| Dyslipidemia | 112 (75.7) | Maximum atrial volume, mL | 93.3±36.6 | E/A ratio | 0.84±0.36 |
| Diabetes mellitus | 56 (37.8) | Pre-A wave atrial volume, mL | 72.6±31.7 | Medial e¿ velocity, cm/s | 5.4±1.6 |
| Former smoker | 24 (16.2) | LA function | Lateral e¿ velocity, cm/s | 6.6±2.4 | |
| Current smoker | 4 (2.7) | Reservoir function | Mean e¿ velocity, cm/s | 6.0±1.6 | |
| NYHA functional class III/IV | 13 (8.8) | PALS, % | 25.5±10.9 | Medial E/e¿ ratio | 15.2±5.7 |
| CAD | 58 (43.6) | LA emptying fraction, % | 47.9±13.5 | Lateral E/e¿ ratio | 12.8±6.4 |
| Syntax score | 0 (0; 7) | LA expansion index | 109.1±76.1 | Mean E/e¿ ratio | 14.1±5.4 |
| CAC score | 284.5 (73.1; 878.8) | Conduit function | RA morphology and function | ||
| Prior PCI | 12 (8.1) | Passive emptying volume, mL | 20.7±11.5 | RA area 4C, cm2 | 15.1±4.6 |
| COPD | 13 (8.8) | Passive emptying fraction, % | 23.0±10.4 | RA volume 4C, mL | 36.5±14.2 |
| PAD | 1 (0.7) | Conduit volume, mL | 16.3 (0; 32) | RA ejection fraction 4C, % | 33.6±27.4 |
| Ischemic stroke | 2 (1.4) | PALS – PACS, % | 13.0±7.1 | RV function | |
| GFR, mL/min | 81±25.0 | Booster pump function | TAPSE | 22.8±4.7 | |
| Medications | PACS, % | 12.5±7.1 | Lateral tricuspide, cm/s | 14.2±2.7 | |
| Statin use | 113 (78.5) | LA active emptying fraction, % | 32.8±13.3 | ||
| Insulin therapy | 10 (6.8) | LA active emptying volume, mL | 21.6±9.3 | ||
| Oral antidiabetic | 41 (28.5) | PACS–strain minimum | 14.2±7.1 | ||
| ACE inhibitor | 56 (38.9) | LV morphology and systolic function | |||
| ARB | 45 (31.2) | LV mass index, g/m2 | 130.1±32.2 | ||
| Aldosterone antagonists | 3 (2.1) | LV end-diastolic diameter, mm | 45.8±7.0 | ||
| BB | 61 (42.1) | LV end-systolic diameter, mm | 29.3±6.3 | ||
| Antiplatelet | 58 (43.6) | LV end-diastolic volume BP, mm | 94.9±30.7 | ||
ACE, angiotensin converting enzyme; ARB, angiotensin receptor blocker; BB, beta-blocker; BMI, body mass index; BP, biplane; BSA, body surface area; CAC, coronary artery calcification; CAD, coronary artery disease; COPD, chronic obstructive pulmonary disease; HC, hip circumference; GFR, glomerular filtration rate; LA, left atrium; LV, left ventricular; MAPSE, mitral annular plane systolic excursion; NYHA, New York Heart Association; PACS, peak atrial contraction strain; PCI, percutaneous coronary intervention; PAD, peripheral arterial disease; PALS, peak atrial longitudinal strain; RA, right atrium; RV, right ventricular; TAPSE, tricuspid annular plane systolic excursion; WC, waist circumference.
Values are presented as mean±standard deviation or median (quartile 1; quartile 3) if the distribution is skewed.
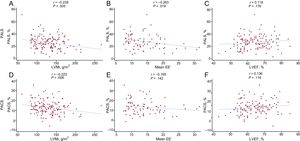
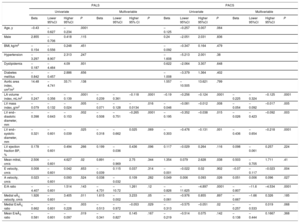
Mean PALS, PACS, maximum LA volume, minimum LA volume, and pre-A wave LA volume were 25.5±10.9%, 12.5±7.1%, 93.3±36.6mL, 51.0±28.7mL, and 72.6±31.7mL, respectively. On multiple regression, both PALS and PACS were inversely correlated with LA volume index, left ventricular mass index, and left ventricular end-diastolic dimension, as well as worse diastolic function evaluated by medial E’ velocity and medial E/E’ (PALS only) and E/A ratios (PACS only). Figure 3 illustrates the correlations of PALS and PACS with left ventricular mass index, mean E/E¿ ratio, and left ventricular ejection fraction. Increased LA volumes were associated with higher left ventricular mass index and E/A ratio (Table 1 of the supplementary material and Table 2 of the supplementary material). Neither LA strain nor volumes were associated with left ventricular systolic function. Univariate and multiple linear regression coefficients for correlations with PALS and PACS are shown in Table 2.
, mean EE’ (B and E) and left ventricular ejection fraction (LVEF, C and F). EE’, E/e’ ratio; LVEF, left ventricular ejection fraction; LVMi, left ventricular mass index; PACS, peak atrial contraction strain, PALS, peak atrial longitudinal strain.")
Correlations of PALS and PACS with left ventricular mass index (A and D), mean EE’ (B and E) and left ventricular ejection fraction (LVEF, C and F). EE’, E/e’ ratio; LVEF, left ventricular ejection fraction; LVMi, left ventricular mass index; PACS, peak atrial contraction strain, PALS, peak atrial longitudinal strain.
Univariate and Multiple Linear Regression Analysis for Variables Associated With Peak Atrial Longitudinal Strain and Peak Atrial Contraction Strain
| PALS | PACS | |||||||||||||||
|---|---|---|---|---|---|---|---|---|---|---|---|---|---|---|---|---|
| Univariate | Multivariable | Univariate | Multivariable | |||||||||||||
| Beta | Lower 95%CI | Higher 95%CI | P | Beta | Lower 95%CI | Higher 95% CI | P | Beta | Lower 95%CI | Higher 95%CI | P | Beta | Lower 95%CI | Higher 95%CI | P | |
| Age, y | –0.43 | –0.627 | –0.234 | .0001 | –0.125 | –0.257 | 0.007 | .064 | ||||||||
| Male | 2.855 | –0.706 | 0.418 | .115 | 0.24 | –2.051 | 2.031 | .836 | ||||||||
| BMI, kg/m2 | –0.154 | –0.556 | 0.248 | .451 | –0.092 | –0.347 | 0.164 | .479 | ||||||||
| Hypertension | –3.297 | –8.907 | 2.313 | .247 | –1.608 | –5.213 | 2.001 | .38 | ||||||||
| Dyslipidemia | –0.187 | –4.464 | 4.09 | .931 | 0.622 | –2.064 | 3.307 | .648 | ||||||||
| Diabetes mellitus | –0.842 | –0.457 | 2.886 | .656 | –1.008 | –3.379 | 1.364 | .402 | ||||||||
| Aortic area index, cm2/m2 | 14.48 | –4.741 | 33.71 | .138 | 1.557 | –10.505 | 13.621 | .799 | ||||||||
| LA volume index, mL/m2 | –0.247 | –0.356 | –0.139 | .0001 | –0.239 | –0.361 | –0.118 | .0001 | –0.19 | –0.256 | –0.124 | .0001 | –0.225 | –0.324 | –0.125 | .0001 |
| LV mass index, g/m2 | –0.079 | –0.132 | –0.024 | .005 | –0.071 | –0.128 | –0.0134 | .016 | –0.046 | –0.081 | –0.012 | .008 | –0.054 | –0.092 | –0.017 | .005 |
| LV end–diastolic diameter, mm | –0.398 | –0.643 | –0.153 | .002 | –0.508 | –0.751 | –0.265 | .0001 | –0.195 | –0.352 | –0.038 | .015 | –0.026 | –0.423 | –0.092 | .003 |
| LV end–systolic diameter, mm | –0.321 | –0.601 | –0.039 | .025 | –0.318 | –0.662 | 0.025 | .069 | –0.303 | –0.476 | –0.131 | .001 | –0.436 | –0.654 | –0.218 | .0001 |
| LV ejection fraction BP, % | 0.178 | –0.601 | 0.494 | .266 | 0.199 | –0.036 | 0.436 | .096 | 0.117 | –0.029 | 0.264 | .116 | 0.098 | –0.061 | 0.257 | .224 |
| Mean mitral, cm/s | 2.506 | –0.601 | 4.627 | .02 | 0.891 | –0.969 | 2.75 | .344 | 1.354 | 0.079 | 2.628 | .038 | 0.503 | –0.705 | 1.711 | .41 |
| E velocity, cm/s | 0.008 | –0.601 | 0.042 | .653 | –0.039 | 0.115 | 0.037 | .314 | –0.001 | –0.022 | 0.02 | .902 | –0.07 | –0.117 | –0.023 | .004 |
| A velocity, cm/s | 0.023 | –0.601 | 0.093 | .524 | 0.038 | –0.032 | 0.109 | .282 | 0.049 | 0.006 | 0.093 | .026 | 0.051 | 0.006 | 0.096 | .027 |
| E/A ratio | –4.407 | –0.601 | 1.514 | .143 | –4.731 | –10.72 | 1.261 | .12 | –0.826 | –11.625 | –4.897 | .0001 | –0.807 | –11.6 | –4.534 | .0001 |
| Medial e¿ velocity, cm/s | 1.926 | –0.601 | 3.405 | .011 | 1.615 | –0.002 | 3.233 | .05 | –0.061 | –0.976 | 0.855 | .897 | –0.667 | –1.66 | 0.326 | .185 |
| Medial E/e¿ ratio | –0.662 | –0.601 | –0.228 | .003 | –0.513 | –0.972 | –0.053 | .029 | –0.313 | –0.575 | –0.051 | .02 | –0.257 | –0.533 | 0.019 | .068 |
| Mean E/e¿ ratio | –0.581 | –0.601 | –0.097 | .019 | –0.341 | –0.827 | 0.145 | .167 | –0.219 | –0.514 | 0.075 | .142 | –0.138 | –0.444 | 0.1667 | .368 |
95%CI, 95% confidence interval; BMI, body mass index; BP, biplane; LA, left atrium; LV, left ventricular; PACS, peak atrial contraction strain; PALS, peak atrial longitudinal strain.
Beta estimate relates to 1 unit variation of PALS.
Multivariable model included age, sex, BMI, hypertension, diabetes mellitus, beta-blocker use, renin-angiotensin-aldosterone inhibitors, aortic valve area index.
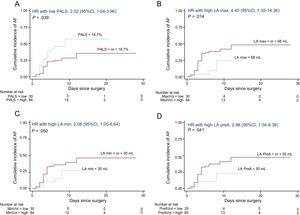
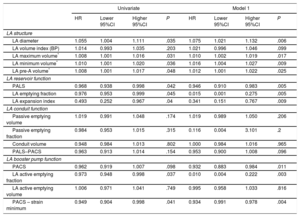
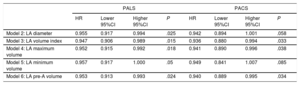
Aortic valve replacement was performed in 115 patients (25 underwent AVR combined with myocardial revascularization), and 1 patient was excluded because of death in the context of extensive myocardial infarction during surgery. The median length of hospital stay was 7 days (Q1: 5; Q3: 9) and AF occurred in 36 patients (cumulative incidence of 36.7%; incidence rate of 5.7 cases of AF per 100 operated patients per day of hospitalization, 95% confidence interval [95%CI], 4.1 to 7.8). AF occurred within a median time of 3 days (Q1: 2.5; Q3: 4) after AVR. On multivariable Cox regression analysis, increased LA diameter was associated with a higher incidence of AF after AVR, along with impaired LA reservoir (reflected by reduced PALS, LA emptying fraction, and LA expansion index) and booster pump functions (represented by reduced PACS, LA active emptying fraction, and LA active emptying strain) (Table 3, model 1). Univariate Cox regression analysis for other variables associated with the incidence of AF, none of which was statistically significant, is depicted in Table 3 of the supplementary material. Using ROC analysis, the best cutoffs associated with new-onset AF after AVR were PALS <18.7%, PACS <7.9%, maximum LA volume ≥ 68mL, minimum LA volume ≥ 30mL, and pre-A wave LA volume ≥ 50mL. Kaplan-Meier curves for the cumulative incidence of AF according to PALS, maximum LA volume, minimum LA volume, and pre-A wave LA volume groups are shown in Figure 4. On multiple linear regression analysis, several measures of LA reservoir and booster pump functions remained significantly associated with the incidence of AF (Table 3), and these associations (specifically with PALS and PACS) held statistical significance even after additional adjustment for LA diameter and volumes (models 2 to 5) (Table 4).
Cox Regression Analysis for the Association of Left Atrium Dimensions and Function With the Incidence of Atrial Fibrillation After Aortic Valve Replacement
| Univariate | Model 1 | |||||||
|---|---|---|---|---|---|---|---|---|
| HR | Lower 95%CI | Higher 95%CI | P | HR | Lower 95%CI | Higher 95%CI | P | |
| LA structure | ||||||||
| LA diameter | 1.055 | 1.004 | 1.111 | .035 | 1.075 | 1.021 | 1.132 | .006 |
| LA volume index (BP) | 1.014 | 0.993 | 1.035 | .203 | 1.021 | 0.996 | 1.046 | .099 |
| LA maximum volume* | 1.008 | 1.001 | 1.016 | .031 | 1.010 | 1.002 | 1.019 | .017 |
| LA minimum volume* | 1.010 | 1.001 | 1.020 | .036 | 1.016 | 1.004 | 1.027 | .009 |
| LA pre-A volume* | 1.008 | 1.001 | 1.017 | .048 | 1.012 | 1.001 | 1.022 | .025 |
| LA reservoir function | ||||||||
| PALS | 0.968 | 0.938 | 0.998 | .042 | 0.946 | 0.910 | 0.983 | .005 |
| LA emptying fraction | 0.976 | 0.953 | 0.999 | .045 | 0.015 | 0.001 | 0.275 | .005 |
| LA expansion index | 0.493 | 0.252 | 0.967 | .04 | 0.341 | 0.151 | 0.767 | .009 |
| LA conduit function | ||||||||
| Passive emptying volume | 1.019 | 0.991 | 1.048 | .174 | 1.019 | 0.989 | 1.050 | .206 |
| Passive emptying fraction | 0.984 | 0.953 | 1.015 | .315 | 0.116 | 0.004 | 3.101 | .2 |
| Conduit volume | 0.948 | 0.984 | 1.013 | .802 | 1.000 | 0.984 | 1.016 | .965 |
| PALS–PACS | 0.963 | 0.913 | 1.014 | .154 | 0.953 | 0.900 | 1.008 | .096 |
| LA booster pump function | ||||||||
| PACS | 0.962 | 0.919 | 1.007 | .098 | 0.932 | 0.883 | 0.984 | .011 |
| LA active emptying fraction | 0.973 | 0.948 | 0.998 | .037 | 0.010 | 0.004 | 0.222 | .003 |
| LA active emptying volume | 1.006 | 0.971 | 1.041 | .749 | 0.995 | 0.958 | 1.033 | .816 |
| PACS – strain minimum | 0.949 | 0.904 | 0.998 | .041 | 0.934 | 0.991 | 0.978 | .004 |
95%CI, 95% confidence interval; BP, biplane; HR, hazard ratio; LA, left atrium; PACS, peak atrial contraction strain; PALS, peak atrial longitudinal strain; STE, speckle-tracking echocardiography.
Model 1 includes preoperative medication with beta-blockers or statins, type of procedure (AVR alone vs AVR combined with coronary artery bypass grafting), total number of coronary bypasses, and prosthesis material (biological vs mechanical).
, maximum LA volume (B), minimum LA volume (C) and pre-A wave LA volume (D) groups. 95%CI, 95% confidence interval; AF, atrial fibrillation; HR, hazard ratio; LA, left atrium; PACS, peak atrial contraction strain, PALS, peak atrial longitudinal strain.")
Time-to-event curves for AF after aortic valve replacement according to PALS (A), maximum LA volume (B), minimum LA volume (C) and pre-A wave LA volume (D) groups. 95%CI, 95% confidence interval; AF, atrial fibrillation; HR, hazard ratio; LA, left atrium; PACS, peak atrial contraction strain, PALS, peak atrial longitudinal strain.
Association of Peak Atrial Longitudinal Strain and Peak Atrial Contraction Strain With the Incidence of Atrial Fibrillation After Aortic Valve Replacement Adjustment for Measures of Left Atrium Size
| PALS | PACS | |||||||
|---|---|---|---|---|---|---|---|---|
| HR | Lower 95%CI | Higher 95%CI | P | HR | Lower 95%CI | Higher 95%CI | P | |
| Model 2: LA diameter | 0.955 | 0.917 | 0.994 | .025 | 0.942 | 0.894 | 1.001 | .058 |
| Model 3: LA volume index | 0.947 | 0.906 | 0.989 | .015 | 0.936 | 0.880 | 0.994 | .033 |
| Model 4: LA maximum volume | 0.952 | 0.915 | 0.992 | .018 | 0.941 | 0.890 | 0.996 | .038 |
| Model 5: LA minimum volume | 0.957 | 0.917 | 1.000 | .05 | 0.949 | 0.841 | 1.007 | .085 |
| Model 6: LA pre-A volume | 0.953 | 0.913 | 0.993 | .024 | 0.940 | 0.889 | 0.995 | .034 |
95%CI, 95% confidence interval; HR, hazard ratio, LA, left atrium, PACS, peak atrial contraction strain, PALS, peak atrial longitudinal strain.
Model 2, 3, 4, 5 and 6 include the variables in model 1+LA diameter, or LA volume index, or maximum atrial volume, or minimum atrial volume or the pre-A wave atrial volume, respectively.
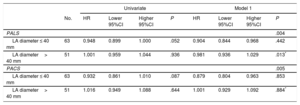
As a secondary aim, we determined the association of PALS and PACS with the incidence of AF stratified by subgroups of LA diameter. In patients with nondilated LA (“normal”), both reduced PALS and PACS were associated with a higher risk of AF after AVR, whereas no significant association was found between AF and either PALS or PACS in patients with dilated LA. Peak atrial longitudinal strain predictive value for AF was statistically different between nondilated and dilated LA patients (P value for interaction of PALS with LA dimension: .013) (Table 5).
Association of Peak Atrial Longitudinal Strain and Peak Atrial Contraction Strain With the Incidence of Atrial Fibrillation After Aortic Valve Replacement According to Left Atrium Dimensions
| Univariate | Model 1 | ||||||||
|---|---|---|---|---|---|---|---|---|---|
| No. | HR | Lower 95%CI | Higher 95%CI | P | HR | Lower 95%CI | Higher 95%CI | P | |
| PALS | .004 | ||||||||
| LA diameter ≤ 40 mm | 63 | 0.948 | 0.899 | 1.000 | .052 | 0.904 | 0.844 | 0.968 | .442 |
| LA diameter> 40 mm | 51 | 1.001 | 0.959 | 1.044 | .936 | 0.981 | 0.936 | 1.029 | .013* |
| PACS | .005 | ||||||||
| LA diameter ≤ 40 mm | 63 | 0.932 | 0.861 | 1.010 | .087 | 0.879 | 0.804 | 0.963 | .853 |
| LA diameter> 40 mm | 51 | 1.016 | 0.949 | 1.088 | .644 | 1.001 | 0.929 | 1.092 | .884* |
95%CI, 95% confidence interval; AVR, aortic valve replacement; HR, hazard ratio; LA, left atrium; PACS, peak atrial contraction strain; PALS, peak atrial longitudinal strain.
Model 1 includes preoperative medication with beta-blockers or statins, type of procedure (AVR alone vs AVR combined with coronary artery bypass grafting), total number of coronary bypasses, and prosthesis material (biological vs mechanical).
The main findings of this study were as follows: a) impaired LA reservoir and booster pump functions were associated with left ventricular hypertrophy, elevated left ventricular filling pressure, and LA dilation; b) AF after AVR can be independently predicted by LA strain and volumes, assessed using STE; c) LA strain can predict the onset of AF, even after adjustment for LA dimensions; and d) impaired LA strain predicted the risk of AF in patients with nondilated LA.
Left Atrial Dysfunction in Aortic Stenosis PatientsLeft atrium function is composed of 3 phases: reservoir, conduit, and booster pump. Reservoir function corresponds to an expansion phase during left ventricular systole; conduit function results from the passage of blood from the LA to the left ventricle during early diastole; and booster pump function occurs in late diastole, corresponding to LA contraction.13 LA function can be assessed by several methods, such as phasic changes in LA volumes, transmitral flow by pulsed-wave Doppler, and measurement of myocardial velocities using tissue-Doppler imaging. However, these commonly-used techniques have several pitfalls, which limit their clinical value.12,13 STE analysis has emerged as a feasible and reproducible tool to evaluate LA function, which overcomes most limitations of conventional indexes and may provide additional prognostic information.14,21 Indeed, LA function can be considered a marker of left ventricular filling pressures and diastolic dysfunction, and has been associated with clinical outcomes such as stroke, heart failure, and cardiovascular mortality in different clinical settings.22
In aortic stenosis, the increased afterload causes a series of changes in left ventricular structure and diastolic function, which lead to increased left ventricular filling pressures and, consequently, raised LA pressures, LA dilatation, and myocardial dysfunction.7,8,23 In this study, we show that impaired LA reservoir and booster pump functions, represented by reduced PALS and PACS, respectively, correlate with increased LA volume index and left ventricular dimensions and reduced diastolic function. These correlations were observed independently of age, aortic valve area index, comorbidities (such as diabetes mellitus or hypertension), and use of beta-blockers or statins.
Association of Left Atrial Dilation and Dysfunction With New-onset Atrial FibrillationIn this study, impaired LA strain predicted the incidence of AF after AVR, which is consistent with previous and smaller studies.5,6,24 Cameli et al.6 suggested that an acute increase in filling pressure during and early after surgery could further destabilize myocardial function in an already fragile LA, and therefore contribute to the onset of AF. In the same study, impaired preoperative LA function was the only predictor of new-onset AF after AVR, and its incidence was not related to any perioperative events, thus highlighting the role of a previously dysfunctional LA in the development of AF.
Specifically, we show a significant association of AF with reduced PALS and PACS, which represent LA reservoir and booster pump functions, but not with indexes of LA conduit function. It has previously been shown that all 3 components of atrial function are reduced in patients with severe aortic stenosis.21,25 Therefore, it could be expected that, similar to reservoir and booster pump functions, conduit function would correlate as well with the onset of AF. However, several other studies addressing the relationship between LA function and new-onset AF after AVR have reported significant results with reservoir and booster pump functions alone.5,6,24,26 Moreover, most clinical trials have focused only on reservoir and booster pump phases,27 indicating that the role of impaired LA conduit function in aortic stenosis has not yet been thoroughly studied. Both reservoir and booster pump functions depend on intrinsic LA properties, namely myocardial stiffness and contractility, whereas conduit function depends mainly on left ventricular relaxation.28 Therefore, impaired reservoir and booster pump functions possibly represent real changes in LA mechanics, which might favor the onset of AF after AVR; by contrast, the contribution of impaired conduit function in this context might be less significant.
Left Atrial Function as a Predictor of New-onset Atrial Fibrillation Independently of Atrial DilationLA dilation is a common finding in aortic stenosis,8 and, as we have shown, it is directly related to impaired LA function.25 LA dilation can also predict the risk of new-onset AF,29 and is currently part of standard echocardiographic analysis.19 However, LA dysfunction may not perfectly parallel LA enlargement and may occur even before the LA starts to dilate, which likely denotes a temporal uncoupling between atrial dilation and dysfunction.8,21,25 In fact, although LA strain and volumes did correlate well in our study, LA reservoir and booster pump functions were independent predictors of new-onset AF, even after adjustment for LA dimensions. Accordingly, Galli et al.30 found that impaired LA reservoir function, but not increased LA volumes, was an independent predictor of major adverse cardiovascular events in aortic stenosis patients. These discrepancies between anatomy and function support the idea that LA strain can represent an early marker of LA dysfunction and clinical deterioration, offering additional prognostic value compared with LA dimensions. Our findings highlight a possible new role for LA strain analysis in patients with severe aortic stenosis, particularly those with a nondilated LA, in which LA function might overcome a size-based assessement of AF risk after AVR. The guidelines of the European Society of Cardiology on both AF and valvular disease suggest the implementation of prophylactic strategies aimed at maintaining sinus rhythm, such as beta-blockers and amiodarone, in the perioperative monitoring of patients with aortic stenosis, and mitral regurgitation; however, no specific recommendations are given.1,31 Here, we suggest that LA functional analysis in the preoperative assessment of patients with aortic stenosis might identify patients at higher risk of developing AF, particularly those who would not have been detected in a standard echocardiograhic evaluation, and might therefore help physicians to tailor prophylactic strategies to patient-specific risk. Nevertheless, our findings ought to be validated in randomized controlled studies or multicenter observational studies.
Strengths and LimitationsTo the best of our knowledge, this is the largest study evaluating the association between LA function assessed by STE and the onset of AF after AVR. We selected a homogenous sample of patients with severe aortic stenosis, with strict inclusion and exclusion criteria, which provide a strong internal validity and reproducibility within our population.
Regarding the limitations of this study, although we excluded patients with prior AF, we cannot definitely exclude the presence of previously undocumented episodes of paroxysmal AF, given the paroxysmal and often asymptomatic nature of this condtion, especially in elderly patients. Additionally, despite arising more commonly in the LA, AF might also have been triggered by disturbances in right atrial size and function, possibly due to concomitant pulmonary disease.6 However, since we excluded patients with moderate-to-severe pulmonary hypertension, and AF was not associated with right atrial enlargement or right ventricular function, we believe the contribution of right atrial anomalies was not significant.
CONCLUSIONSIn severe aortic stenosis, impaired LA reservoir and booster pump functions predicted the occurence of new-onset AF after AVR, independently of LA dilation. These findings reinforce previous evidence supporting the notion that STE analysis can be a useful prognostic imaging biomarker of several cardiovascular outcomes, particularly in the preoperative assessment of patients with severe symptomatic aortic stenosis.
FUNDINGJ. Mancio is supported by the Fundação Portuguesa para a Ciência e Tecnologia (SFRH/BD/104369/2014) and by the Sociedade Portuguesa de Cardiologia (“Bolsa de investigação João Porto”).
CONFLICTS OF INTERESTNone declared.
- –
Previous studies have proposed the use of STE analysis of LA function to predict the risk of new-onset AF after cardiac surgery. However, the available data in patients after AVR is still scarce, and the role of LA functional assessment in this context has not yet been established.
- –
In patients with aortic stenosis, impaired LA function assessed by LA strain predicted the occurrence of AF after AVR, independently of LA dilation. These findings reinforce the role of LA strain analysis as a useful imaging biomarker. In the future, strain analysis may be used to select patients who may benefit from prophylatic therapies able to reduce the burden of postoperative AF.
.
The authors gratefully acknowledge the vital contribution of the professionals at the Cardiology and Cardiothoracic Surgery departments of Centro Hospitalar Vila Nova de Gaia e Espinho.
Supplementary material associated with this article can be found in the online version available at http://dx.doi.org/10.1016/j.rec.2017.10.005