The cardio-ankle vascular index (CAVI) assesses arterial stiffness. We aimed to describe the distribution of CAVI in a Mediterranean population, to determine the proportion of CAVI ≥ 9 by sex and coronary risk level, and to assess the association of CAVI with classic cardiovascular risk factors and lifestyle patterns.
MethodsThis cross-sectional study was based on the population of Girona province. The CAVI was measured using the VaSera VS-1500.
ResultsOf 2613 individuals included in this study, the prevalence of CAVI ≥ 9 was 46.8% in men and 36.0% in women and significantly increased with coronary risk: from 21.1% and 24.8%, respectively to 76.7%, in the low-risk group, and 61.9% in the high-risk group. The CAVI increased with age in both sexes, being higher in men across all age groups. In men, CAVI ≥ 9 was associated with hypertension (OR, 2.70; 95%CI, 1.90-3.87) and diabetes (OR, 2.38; 95%CI, 1.52-3.78), body mass index (BMI) ≤ 25 to < 30 (OR, 0.44; 95%CI, 0.27-0.72) and BMI ≥ 30 (OR, 0.28; 95%CI, 0.14-0.58), and physical activity (OR, 0.66; 95%CI, 0.47-0.92). In women, CAVI ≥ 9 was associated with hypertension (OR, 2.22; 95%CI, 1.59-3.09), hypercholesterolemia (OR, 1.40; 95%CI, 1.01-1.94), and BMI ≥ 30 (OR, 0.38; 95%CI, 0.20-0.71).
ConclusionsThe CAVI increases with age and is higher in men than in women. This index is associated with classic risk factors and coronary risk. It could be a good predictive biomarker, but further follow-up studies are required to assess its added value to cardiovascular risk stratification.
Keywords
Atherosclerosis, the main pathological mechanism involved in cardiovascular disease,1 starts early in life and progresses with aging. Arterial stiffness (ASt) is a noninvasive marker2 from early to late stages of atherosclerosis and is considered a surrogate of cardiovascular disease.3 Mainly determined by age and sex, ASt is also strongly related to classic risk factors and lifestyle patterns.4,5 Aortic pulse wave velocity is the gold standard for ASt assessment, despite being influenced by blood pressure at the time of measurement.6 A recent meta-analysis has supported the predictive value of ASt by showing the ability of aortic pulse wave velocity to improve the prediction of cardiovascular events.7
Several studies have shown that traditional risk scales have inherent limitations at the individual level and thus new individual-specific strategies are being developed to complement diagnosis.8 The cardio-ankle vascular index (CAVI) is a relatively new ASt index. This noninvasive, reliable, and reproducible index uses a relatively simple measuring procedure that can be applied in routine clinical practice.9 The CAVI is a unitless index, due to the nature of its equation, which assesses ASt of the aorta, femoral, and tibial artery independently of blood pressure at the time of measurement.6 The CAVI has mainly been studied in Asian populations4; data in Caucasian populations are scarce. The Mediterranean population, in particular, is of special interest due to the relatively low incidence of myocardial infarction, despite the high prevalence of risk factors.10 If a relatively high prevalence of CAVI ≥ 9 were found in low or intermediate coronary risk groups, the index could be a useful tool to improve stratification.
This study had 3 aims: a) to describe the distribution of CAVI in a general Mediterranean population; b) to determine the prevalence of CAVI ≥ 9 across coronary risk levels; and c) to assess the association of the CAVI value with classic cardiovascular risk factors and lifestyle.
MethodsDesignThis was a descriptive, population-based, cross-sectional study developed by the Registre Gironí del Cor (REGICOR) research group.
Study PopulationFrom 2003 to 2006, a population-based cohort was recruited in Girona (Catalonia) in the context of the REGICOR study, and 6556 individuals aged 35 to 79 years were included.11 Between September 2007 and November 2013, all the participants were invited to participate in a follow-up visit and 4280 attended (> 70% of the eligible participants). The population of this study corresponds to a random subsample of the participants attending the follow-up visit who underwent recording of VaSera measurements. Eligible participants were aged 40 to 90 years. Participants were excluded if they had an end-stage disease, were institutionalized at the time of the appointment, or had an ankle-brachial index ≤ 0.9, since the presence of peripheral arterial disease can yield falsely low CAVI scores.6 Because this study used data from an existing cohort, we did not calculate a formal sample size; instead, we carried out an a posteriori calculation to assess the power yielded by this sample.
Cardio-ankle Vascular Index MeasurementNurses were trained to perform the examinations following a standardized protocol. CAVI measurement was performed using the VaSera VS-1500 device (FukudaDenshi Co Ltd), following the manufacturer's instructions for the best accuracy of the measurement. Participants were asked to avoid smoking or consuming caffeine 1 hour before the examination and to wear light, comfortable clothing. Participants laid on a stretcher to rest for at least 10minutes before the measurement with arms and legs relaxed and a small cushion under the head. Cuffs were fitted for size and were then tightly wrapped around the patients’ arms and ankles. Finally, electrodes were attached to the right and left arms and ankles and a heart sound microphone was fixed with double-sided tape over the sternum in the second intercostal space. Participants were asked to remain still and silent for approximately 5minutes. Only CAVI measurements obtained during at least 3 consecutive heartbeats were considered valid. The highest CAVI value from the left or right sides was considered for analysis. The CAVI is calculated using the following equation:

PWV: pulse wave velocity from valve orifice to ankle; Ps: systolic blood pressure; Pd: diastolic blood pressure; ΔP: change in blood pressure; ρ: blood density. CAVI follows the principal of the β stiffness index but includes the baPWV in its equation. Therefore, the CAVI reflects the stiffness of the aorta, femoral, and tibial artery as a whole.6
CAVI values range from 3 to 18. According to standardized cut points set by the manufacturer, a value < 8 is considered normal, between 8 and 9 borderline, and a value ≥ 9 as high, suggesting the presence of advanced arteriosclerosis.12
Cardiovascular Risk Factor AssessmentThe same group of nurses performed all examinations and administered questionnaires following standardized methods and homologated devices, as detailed elsewhere.13 Sociodemographic variables and history of high blood pressure, hypercholesterolemia, and diabetes were recorded. Blood pressure was measured twice with a calibrated oscillometric sphygmomanometer (OMRON M6, HEM-7001-E) and the mean value was recorded; when both measurements differed by more than 5mmHg, a third was taken and the mean of the 2 last measurements was recorded. Brachial pulse pressure was calculated by subtracting the mean diastolic blood pressure from the mean systolic blood pressure. Blood samples were extracted after 10 to 14hours of fasting. Total cholesterol, high-density lipoprotein cholesterol, triglyceride levels, and glucose concentrations were determined by direct methods (Roche Diagnostics, Basel, Switzerland). Low-density lipoprotein cholesterol was calculated by the Friedewald equation when triglyceride levels were < 300mg/dL. Weight, height, body mass index (BMI), and waist circumference were also measured.14 Ten-year coronary heart disease event (coronary death, nonfatal myocardial infarction, or angina) risk was calculated using the REGICOR function, an adaptation of the Framingham risk equation to the Spanish population,15 which has been validated for persons aged 40 to 74 years who are free of cardiovascular disease.
Hypertension was recorded in 2 circumstances: a) the participant reported a previous diagnosis or treatment for hypertension, or b) systolic blood pressure and diastolic blood pressure were ≥ 140mmHg or ≥ 90mmHg, respectively. Diabetes was defined as follows: a) if participants reported a previous diagnosis or treatment for diabetes, or b) if the fasting glucose concentration was ≥ 126mg/dL. Hypercholesterolemia was recorded as follows: a) if participants received lipid-lowering drugs, or b) the total cholesterol concentration was ≥ 250mg/dL.
LifestylesPhysical activity was assessed using the validated REGICOR short questionnaire,16 which allows estimation of energy expenditure during light (< 4 MET), moderate (4-5.9 MET), and vigorous intensity physical activity (≥ 6 MET). Individuals were considered to be sedentary if they did not reach the minimal cardio-protective physical activity recommended by the American Heart Association17; those meeting the recommendations (moderate physical activity 30minutes/d, 5 d/wk or vigorous physical activity 20min/d, 3 d/wk) were considered active. Diet quality was assessed using a validated short dietary quality screener.18 Smoking was assessed by a standard questionnaire from the MONICA study to determine current smokers, exsmokers < 1 year, exsmokers 1 to 5 years, exsmokers > 5 years, and never smokers. For the purpose of this study, we considered persons who currently smoked or had quit in the past year as smokers and persons who had quit smoking more than a year previously as exsmokers.
Statistical AnalysisThe 5th, 10th, 25th, 50th, 75th, 90th, and 95th percentiles of the CAVI scores were estimated across age groups and by sex. Analysis of variance was used to identify differences in continuous variables, and the chi-square test for categorical variables, across the defined CAVI groups. These analyses were stratified by sex, and we applied a Bonferroni correction to correct for multiple comparisons (overall 5 comparisons, statistical significance threshold at P < .01). A test for trend in proportions was carried out to determine the prevalence of CAVI ≥ 9, and the 95%CI was calculated. Correlations between CAVI and 10-year coronary heart disease risk score (estimated with REGICOR) by sex were performed.
Logistic regression was used to identify those cardiovascular risk factors and lifestyles associated with CAVI ≥ 9. The variables included in the model were those that showed significance in the bivariate analysis or were clinically relevant. A P value lower than .05 was considered statistically significant. The discrimination ability of the models was assessed by means of the area under the curve while the goodness-of-fit was assessed by means of the Hosmer-Lemeshow test. Linearity assumptions were tested for age, waist circumference, and BMI.
The R-studio software was used for statistical analyses (R Foundation for Statistical Computing, Vienna, Austria; Version 2.13.1).19
Ethical IssuesAll participants were informed and freely signed an informed consent form to participate in the study, which had been previously approved by the local ethics committee.
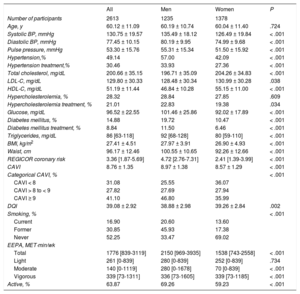
ResultsThe sample consisted of 2613 participants (Figure of the supplementary material), who were representative of the original cohort (Table 1 and Table 2 of the supplementary material), 47.26% were men and the mean ± standard deviation age was 60.12 ± 11.09 years. The main clinical characteristics and lifestyles by sex are shown in Table 1. Men had higher values of blood pressure, fasting glucose, BMI, waist circumference, and REGICOR coronary risk and lower levels of total cholesterol, low-density lipoprotein cholesterol, and high-density lipoprotein cholesterol than women. Men also had higher CAVI values, as well as a higher proportion of individuals with CAVI ≥ 9. Regarding lifestyles, men were more active and smoked more while women had a higher-quality diet.
Main Sociodemographic and Clinical Characteristics of the Participants by Sex
| All | Men | Women | P | |
|---|---|---|---|---|
| Number of participants | 2613 | 1235 | 1378 | |
| Age, y | 60.12 ± 11.09 | 60.19 ± 10.74 | 60.04 ± 11.40 | .724 |
| Systolic BP, mmHg | 130.75 ± 19.57 | 135.49 ± 18.12 | 126.49 ± 19.84 | < .001 |
| Diastolic BP, mmHg | 77.45 ± 10.15 | 80.19 ± 9.95 | 74.99 ± 9.68 | < .001 |
| Pulse pressure, mmHg | 53.30 ± 15.76 | 55.31 ± 15.34 | 51.50 ± 15.92 | < .001 |
| Hypertension,% | 49.14 | 57.00 | 42.09 | < .001 |
| Hypertension treatment,% | 30.46 | 33.93 | 27.36 | < .001 |
| Total cholesterol, mg/dL | 200.66 ± 35.15 | 196.71 ± 35.09 | 204.26 ± 34.83 | < .001 |
| LDL-C, mg/dL | 129.80 ± 30.33 | 128.48 ± 30.34 | 130.99 ± 30.28 | .038 |
| HDL-C, mg/dL | 51.19 ± 11.44 | 46.84 ± 10.28 | 55.15 ± 11.00 | < .001 |
| Hypercholesterolemia, % | 28.32 | 28.84 | 27.85 | .609 |
| Hypercholesterolemia treatment, % | 21.01 | 22.83 | 19.38 | .034 |
| Glucose, mg/dL | 96.52 ± 22.55 | 101.46 ± 25.86 | 92.02 ± 17.89 | < .001 |
| Diabetes mellitus, % | 14.88 | 19.72 | 10.47 | < .001 |
| Diabetes mellitus treatment, % | 8.84 | 11.50 | 6.46 | < .001 |
| Triglycerides, mg/dL | 86 [63-118] | 92 [68-128] | 80 [59-110] | < .001 |
| BMI, kg/m2 | 27.41 ± 4.51 | 27.97 ± 3.91 | 26.90 ± 4.93 | < .001 |
| Waist, cm | 96.17 ± 12.46 | 100.55 ± 10.65 | 92.26 ± 12.66 | < .001 |
| REGICOR coronary risk | 3.36 [1.87-5.69] | 4.72 [2.76-7.31] | 2.41 [1.39-3.99] | < .001 |
| CAVI | 8.76 ± 1.35 | 8.97 ± 1.38 | 8.57 ± 1.29 | < .001 |
| Categorical CAVI, % | < .001 | |||
| CAVI < 8 | 31.08 | 25.55 | 36.07 | |
| CAVI > 8 to < 9 | 27.82 | 27.69 | 27.94 | |
| CAVI ≥ 9 | 41.10 | 46.80 | 35.99 | |
| DQI | 39.08 ± 2.92 | 38.88 ± 2.98 | 39.26 ± 2.84 | .002 |
| Smoking, % | < .001 | |||
| Current | 16.90 | 20.60 | 13.60 | |
| Former | 30.85 | 45.93 | 17.38 | |
| Never | 52.25 | 33.47 | 69.02 | |
| EEPA, MET·min/wk | ||||
| Total | 1776 [839-3119] | 2150 [969-3935] | 1538 [743-2558] | < .001 |
| Light | 261 [0-839] | 280 [0-839] | 252 [0-839] | .734 |
| Moderate | 140 [0-1119] | 280 [0-1678] | 70 [0-839] | < .001 |
| Vigorous | 339 [73-1311] | 336 [73-1605] | 339 [73-1185] | < .001 |
| Active, % | 63.87 | 69.26 | 59.23 | < .001 |
BMI, body mass index; BP, blood pressure; CAVI, cardio-ankle vascular index; DQI, dietary quality index; EEPA, energy expenditure in physical activity; HDL-C, high-density lipoprotein cholesterol; LDL-C, low-density lipoprotein cholesterol. Unless otherwise indicated, data are expressed as mean ± standard deviation or median [25th percentile-75th percentile].
This sample size allowed us to estimate mean CAVI at a precision ± 0.18 with a 95% confidence interval (95%CI) in each 10-year age-group and by sex, assuming a common standard deviation of 1.3 units. Assuming the worst-case scenario, a proportion of individuals exposed to risk factors equal to 50%, it also allowed the detection of significant odds ratios (OR) greater than or equal to 1.25, accepting a beta risk of 0.2.
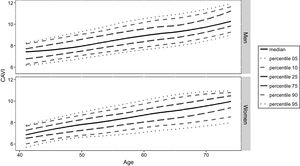
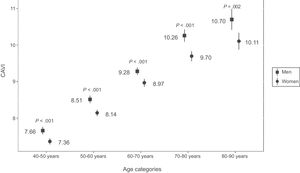
The percentile distribution of CAVI across ages and by sex is shown in Figure 1. The variability of CAVI (difference between the minimum [5th] and the maximal [95th] percentiles) tends to stay even across ages categories in both sexes. The CAVI increased with age in both sexes and was significantly higher in men across all age categories (post hoc Tukey HSD P-values < .05). The mean value of CAVI in men and women by decades is shown in Figure 2.
 percentiles (5th, 10th, 25th, 50th, 75th, 90th, 95th) by sex and age.")

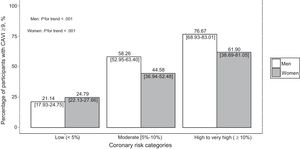
The prevalence of CAVI ≥ 9 was 41.1% (95%CI, 39.2-43.0). Regardless of sex, participants with CAVI ≥ 9 were 10 years older, had higher blood pressure, a higher prevalence of hypertension, and higher levels of fasting glucose and triglycerides. Women with CAVI ≥ 9 had higher levels of cholesterol as well as a higher BMI. In men, CAVI ≥ 9 was associated with lower levels of total cholesterol and low-density lipoprotein cholesterol and higher high-density lipoprotein cholesterol levels. Men and women with CAVI ≥ 9 had better diet quality and smoking habits but were less active than their healthy counterparts (Table 3 of the supplementary material). The prevalence of CAVI ≥ 9 increased with coronary risk (Figure 3), being 21.1% in men and 24.8% in women categorized as being at low coronary risk, 58.3% and 44.6%, respectively, in the moderate-risk category, and 76.7% and 61.9% in the high-risk category. The correlation between CAVI and the 10-year coronary heart disease risk was significant in both men (Pearson's r = 0.471, P < .001) and women (Pearson's r = 0.359, P < .001).
![Percentage of participants with CAVI ≥ 9 by risk category. Percentage [95% confidence interval] of CAVI ≥ 9, by sex, within each REGICOR risk category: low (risk < 5%), moderate (risk < 10%), high-very high (risk ≥ 10%). CAVI, cardio-ankle vascular index.](https://static.elsevier.es/multimedia/18855857/0000007100000006/v1_201808061049/S1885585717304425/v1_201808061049/en/main.assets/gr3.jpeg?xkr=eyJpdiI6IlkyUXlCWXJONTZlZHgrWTljaDZucmc9PSIsInZhbHVlIjoiM1F5NXhUdHQ1MjVmbW5xUkVYSmVGR1I0UFJaeGpRVGZkSDd1WFJTK3JEUktIZmdRcm8zcmhlbGpaeHJ4OFplYjVpZzNaMWErR3lxT3ovamNaZnRscGlUNEVNVFZpMkdaUXB1SkJBT3BLV3RiREY4aXRXV3BwbFZzUHVucnRGdEtuckd1THJsbDJ3Umc5c1dvKzNuMjB3eE5OZ3ZTaTlVNCtyb3lLSTN5Ynl1T0kzbkVQWDVQTUkxcEdGRmt6dERnT0VuUmxaSVF4Y3hTZkk4dEpuem1WdkhvWlJQaFp0U0ZJQ1lBdE5oQm1CQkVyVEJCV3Vyc3lXdEJ4aENoUXBwNVF6clN2eFF4NFY4cmNyR0lvOFVBR25JckJDMkl2MHhwRURTWXJCbGNTcW89IiwibWFjIjoiNTQzOWNkYTNiZjc0NGJiMmMwZDk5ODg5ODMwMWVjNTM2YzlkZDcxYTYxNzg2YjZiNTA4YTAxYjZhNDM4MTMyNiIsInRhZyI6IiJ9 "Percentage of participants with CAVI ≥ 9 by risk category. Percentage [95% confidence interval] of CAVI ≥ 9, by sex, within each REGICOR risk category: low (risk < 5%), moderate (risk < 10%), high-very high (risk ≥ 10%). CAVI, cardio-ankle vascular index.")
Multivariate logistic regression results (Table 2) indicated that age, hypertension, and diabetes were associated with a higher prevalence of CAVI ≥ 9 in men, whereas a higher BMI and an active lifestyle were associated with a lower prevalence of CAVI ≥ 9. In women, CAVI ≥ 9 prevalence was directly associated with age, hypertension, and hypercholesterolemia and inversely associated with BMI values. The multivariate models showed a high capacity to discriminate the presence of CAVI ≥ 9, as well as a good goodness-of-fit, both in men and women. The area under the curve was 88.2 (95%CI, 86.3-90.1) in men and 88.8 (95%CI, 87.1-90.6) in women. The goodness-of-fit was also assessed by means of the Hosmer-Lemeshow statistic and was nonsignificant in both men P = .302 and women P = .176. Age and waist circumference met the linearity assumption, but BMI did not comply with this assumption and was thus categorized.
Variables Associated With Cardio-ankle Vascular Index ≥ 9 Index by Sex. Results of Multivariate Logistic Regression
| Men | ||
|---|---|---|
| OR (95%CI) | P | |
| Age | 1.17 (1.15-1.20) | < .001 |
| Hypertension | 2.70 (1.90-3.87) | < .001 |
| Diabetes | 2.38 (1.52-3.78) | < .001 |
| Waist circumference | 0.98 (0.96-1.00) | .121 |
| BMI ≤ 25 to < 30 kg/m2 | 0.44 (0.27-0.72) | < .001 |
| BMI ≥ 30 kg/m2 | 0.28 (0.14-0.58) | < .001 |
| Hypercholesterolemia | 1.10 (0.77-1.55) | .603 |
| Physical activity | 0.66 (0.47-0.92) | .015 |
| Women | ||
|---|---|---|
| OR (95%CI) | P | |
| Age | 1.17 (1.15-1.20) | < .001 |
| Hypertension | 2.22 (1.59-3.09) | < .001 |
| Diabetes | 1.48 (0.84-2.60) | .172 |
| Waist circumference | 0.99 (0.97-1.01) | .277 |
| BMI ≤ 25 to < 30 kg/m2 | 0.81 (0.53-1.23) | .329 |
| BMI ≥ 30 kg/m2 | 0.38 (0.20-0.71) | .003 |
| Hypercholesterolemia | 1.40 (1.01-1.94) | .044 |
| Physical activity | 0.93 (0.68-1.27) | .652 |
95%CI, 95% confidence interval; BMI, body mass index; OR, odds ratio.
Our results indicate that men in this Mediterranean population tend to have higher CAVI values than women, and CAVI increases with age. A significant proportion of the population had CAVI ≥ 9; this group was older and had a higher prevalence of cardiovascular risk factors and higher Framingham-REGICOR coronary risk score, compared with the CAVI < 9 group. Physical inactivity and the presence of classic risk factors increased the probability of a CAVI ≥ 9 score in both men and women. In turn, BMI was inversely related to CAVI ≥ 9. The prevalence of CAVI ≥ 9 across coronary risk levels increased with risk.
The mean CAVI values obtained in our study showed the same patterns for age and sex groups as in general Asian populations.20 Nonetheless, the mean CAVI values were higher in all age categories than those reported in Asian populations,21,22 probably due to the high prevalence of cardiovascular risk factors in our population. We provide the percentile distribution of CAVI index by age and sex. The availability of these ranges could be a reference to assess the atherosclerosis burden in clinical practice.
In our analysis of the association between CAVI and classic risk factors, all risk factors behaved as expected except BMI, which appeared to be inversely related: the odds of having CAVI ≥ 9 significantly decreased in both overweight BMI categories, ≤ 25 to < 30 and ≥ 30. These unexpected results have also been reported in other studies.23,24 A possible explanation could be that visceral fat has a higher impact on ASt than subcutaneous fat, making waist circumference a more accurate measure of noxious fat than BMI, which considers subcutaneous fat as well as visceral fat. Waist circumference has been shown to be a good indicator of visceral adiposity,25 despite not showing a significant association in this study.
Hypertension was positively associated with the risk of a pathological CAVI value in both men and women. Diabetes was also associated with higher odds of CAVI ≥ 9, as in other studies.26 In women, a tendency can be observed, despite a lack of significance, probably due to a lack of power since there were only 64 diabetic women in the CAVI < 9 group and 77 in the CAVI ≥ 9 group. Hypercholesterolemia was associated with CAVI ≥ 9 in women but not in men. In men, the CAVI ≥ 9 group had a higher prevalence of hypercholesterolemia as well as patients receiving cholesterol-lowering treatment whereas the mean total cholesterol was lower. These characteristics might have resulted in an attenuation of the cholesterol effect on ASt. Other studies that defined hypercholesterolemia by other guidelines have found an association between CAVI and hypercholesterolemia in both men and women.27 These associations reinforce the role of classic risk factors in cardiovascular functions.
Of the lifestyle factors considered in our study, only cardio-protective physical activity in men was significantly associated with CAVI ≥ 9 in the multivariate analysis. Smoking has long been established as an unhealthy lifestyle factor because it is a major cardiovascular risk factor and one of the main preventable causes of death in developed countries.28 The lack of association between smoking and ASt has been observed in previous studies.29 This may be due to the cross-sectional design of the studies and because pack-years of exposure may not have been taken into consideration, hampering the ability to fully characterize the effects of smoking on ASt. Since smoking is a modifiable lifestyle factor, follow-up studies would be useful to assess whether there is indeed a causal relationship. Perhaps those individuals with modifiable risk factors or those of more advanced age have been encouraged to make lifestyle changes and have done so more recently than can be expected to show discernible benefits. It is notable that the proatherogenic effect of smoking on serum lipid profile30 as well as its involvement in endothelial dysfunction31 have been validated repeatedly. Regarding diet quality, no significant differences were observed between CAVI groups in the overall population or in comparative analysis of men and women. A cardio-protective amount of physical activity has been shown to have a positive effect on cardiovascular health, specifically associated with lower central ASt.32 This beneficial effect was present in our results, with cardio-protective physical activity having an OR < 1 for both men and women, but only reaching significance in men. These results highlight the importance of the current strategies to control risk factors as well as the promotion of healthy lifestyles to prevent the onset of cardiovascular events or disease.
Several indicators suggest that CAVI may be able to provide information that can complement classic risk factors and help to improve coronary risk stratification. First, this index has shown associations with classic cardiovascular risk factors, with the 10-year coronary heart disease risk, and with the lifestyles that promote cardiovascular health.22 Second, the prevalence of CAVI ≥ 9 increases with risk, suggesting that those individuals with CAVI ≥ 9 but not at high risk may be reclassified into higher risk groups. In turn, those categorized as high risk who show CAVI < 9 may not belong in high-risk groups. Lastly, CAVI has been shown to have predictive value for the onset of cardiovascular disease.23 If CAVI-based reclassification of low- or moderate-risk individuals as high-risk can be validated in future follow-up studies, this would enable timely preventive treatment of individuals who would not otherwise receive it, and would ultimately reduce the incidence of cardiovascular disease.
Limitations and StrengthsOur study has several limitations that should be considered. As the design was cross-sectional, causality cannot be established. Therefore, we cannot definitively state that the results regarding risk factors were due to any direct causal link with CAVI scores. Specifically, regarding diet quality, we used a short questionnaire and found no significant associations. A more detailed questionnaire would likely have been able to detect differences between groups.
This study also has several strengths that provide robustness to the conclusions obtained: its large sample size with many clinical and behavioral factors as independent variables, the use of validated questionnaires in all cases,16,18 and the specific training provided for nurses in charge of data collection. The study also contributes novel findings because, to our knowledge, it was the first to assess the distribution and validity of CAVI in a Mediterranean population.
ConclusionsIn summary, this study provides population reference values for CAVI assessment in men and women and across age groups. The CAVI is higher in men than in women and increases with age. Classical cardiovascular risk factors, with the exception of BMI, and lack of physical activity are directly associated with CAVI ≥ 9. The prevalence of CAVI ≥ 9 increased with coronary risk and reached 60% in groups not classified as being at high risk. All these data suggest that CAVI should be considered for further follow-up studies in order to assess its validity as an indicator of asymptomatic atherosclerosis, as well as its contribution to risk stratification.
FundingThe REGICOR cohorts were funded by the Spanish Ministry of Economy through the Carlos III Health Institute (Red de Investigación Cardiovascular Programa HERACLES RD12/0042 and Red RedIAPP RD12/0007), and European Regional Development Funds (ERDF-FEDER), CIBER Enfermedades Cardiovasculares, Health Research Fund (FIS90/0672, FIS93/0568, FIS96/0026-01, FIS99/0655, FIS99/0013-01, FIS 99/9342, FIS02/0589, FIS2003/HERMES PI20471, FIS14/00449, INTRASALUD PI11/01801); the Government of Catalunya through Agència de Gestió Ajuts Universitaris de Recerca [2014 SGR 240] and [2014 SGR 902]. M. Grau is funded by a ERDF contract from Carlos III Health Institute (FIS CP12/03287).
Conflicts of InterestNone declared.
-Arterial stiffness is a surrogate marker of atherosclerotic progression. The current gold standard for assessing ASt is carotid-femoral pulse wave velocity, which makes the assessment highly dependent on the blood pressure at the time of measurement. The CAVI is a noninvasive index independent of blood pressure that has proven to be a good assessment method for ASt.
What does this Study add?-In this study we assessed the behavior of the CAVI in a Mediterranean population, observing higher CAVI scores in men and an increase with age in both sexes. Classical cardiovascular risk factors, as well as cardio-protective physical activity, were independently associated with a CAVI ≥ 9. Lastly, the prevalence of CAVI ≥ 9 increased with cardiovascular risk and reached 60% in some groups not considered high-risk.
.
The authors acknowledge S. Tello, M. Cabañero, and L. Franco for the data management. We also thank all the participants and staff from the REGICOR cohorts who participated in this study. Lastly, we greatly appreciate the comments on the English text by Elaine Lilly, PhD.