Atrial fibrillation (AF) has a high prevalence, representing 4.4% of the population older than 40 years in Spain.1 The management of this arrhythmia has undergone significant changes, with the emergence of new direct anticoagulants, the development of AF ablation, and new thromboembolic and bleeding risk scales.2 These advances have also made its management more complex. Given its high prevalence, many patients are followed-up in noncardiology settings (internal medicine [IM], primary care [PC]), and there are no data in Spain regarding possible differences in management according to the type of specialist. Over the past year, various registries have been published on nonvalvular AF in Spain, but the majority include patients seen only in cardiology departments3 or PC.4 The FANTASIIA study (Spanish acronym for Atrial fibrillation: Influence of anticoagulation level and type on stroke and bleeding event incidence),5 was designed to include patients attended by both specialties.
The baseline characteristics of the patients monitored by cardiologists and noncardiologists (IM/PC) were analyzed. Between June 2013 and October 2014, 100 investigators (81% cardiologists, 11% PC specialists and 8% IM specialists) enrolled 2178 consecutive patients with nonvalvular AF seen in outpatient consultations throughout Spain. All the investigators worked at centers within the national health care system. The choice of sites and investigators was made in a nonrandomized manner, by invitation of the scientific committee, following the criteria of territorial distribution by autonomous community and hospital level (one third from each level: primary, secondary, and tertiary).
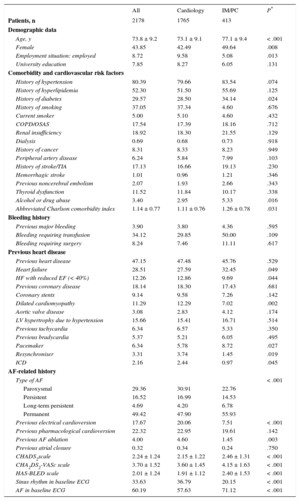
The mean age was 73.8 ± 9.2 years and women accounted for 42.5% of the sample. There were no differences in these variables between the patients attended by IM and PC or between those attended at hospital appointments and those seen in cardiology outpatient consultations. The mean age of the IM/PC patients was 4 years older than that of patients attended by cardiologists (Table 1). There was a slightly higher rate of hypertension and diabetes mellitus among the IM/PC patients. There was a high prevalence of previous heart disease, approximately 48%, which was similar between the 2 groups. There were no differences in bleeding history or in most types of heart disease (including coronary heart disease) (Table 1), with the exception of heart failure, which was more common (32% vs 27%, P = .049) in patients followed-up by IM/PC. AF was more frequently paroxysmal in the patients followed up by cardiology (P < .001) (Table 1). A history of electrical cardioversion and AF ablation, while infrequent in both groups, was more common in the group followed up by cardiologists. There was a high thromboembolic risk, which was greater in the IM/PC patients (mean CHA2DS2-VASc scores of 4.15, vs 3.60; P < .001). Bleeding risk, calculated using the HAS-BLED scale, was moderate and was higher in the IM/PC patients (Table 1).
Demographic Characteristics, Cardiovascular Risk Factors, Comorbidities, and Bleeding and Cardiological Histories in the Total Series and Comparison Between Patients Attended by Cardiologists and Noncardiologists
| All | Cardiology | IM/PC | P* | |
|---|---|---|---|---|
| Patients, n | 2178 | 1765 | 413 | |
| Demographic data | ||||
| Age, y | 73.8 ± 9.2 | 73.1 ± 9.1 | 77.1 ± 9.4 | < .001 |
| Female | 43.85 | 42.49 | 49.64 | .008 |
| Employment situation: employed | 8.72 | 9.58 | 5.08 | .013 |
| University education | 7.85 | 8.27 | 6.05 | .131 |
| Comorbidity and cardiovascular risk factors | ||||
| History of hypertension | 80.39 | 79.66 | 83.54 | .074 |
| History of hyperlipidemia | 52.30 | 51.50 | 55.69 | .125 |
| History of diabetes | 29.57 | 28.50 | 34.14 | .024 |
| History of smoking | 37.05 | 37.34 | 4.60 | .676 |
| Current smoker | 5.00 | 5.10 | 4.60 | .432 |
| COPD/OSAS | 17.54 | 17.39 | 18.16 | .712 |
| Renal insufficiency | 18.92 | 18.30 | 21.55 | .129 |
| Dialysis | 0.69 | 0.68 | 0.73 | .918 |
| History of cancer | 8.31 | 8.33 | 8.23 | .949 |
| Peripheral artery disease | 6.24 | 5.84 | 7.99 | .103 |
| History of stroke/TIA | 17.13 | 16.66 | 19.13 | .230 |
| Hemorrhagic stroke | 1.01 | 0.96 | 1.21 | .346 |
| Previous noncerebral embolism | 2.07 | 1.93 | 2.66 | .343 |
| Thyroid dysfunction | 11.52 | 11.84 | 10.17 | .338 |
| Alcohol or drug abuse | 3.40 | 2.95 | 5.33 | .016 |
| Abbreviated Charlson comorbidity index | 1.14 ± 0.77 | 1.11 ± 0.76 | 1.26 ± 0.78 | .031 |
| Bleeding history | ||||
| Previous major bleeding | 3.90 | 3.80 | 4.36 | .595 |
| Bleeding requiring transfusion | 34.12 | 29.85 | 50.00 | .109 |
| Bleeding requiring surgery | 8.24 | 7.46 | 11.11 | .617 |
| Previous heart disease | ||||
| Previous heart disease | 47.15 | 47.48 | 45.76 | .529 |
| Heart failure | 28.51 | 27.59 | 32.45 | .049 |
| HF with reduced EF (< 40%) | 12.26 | 12.86 | 9.69 | .044 |
| Previous coronary disease | 18.14 | 18.30 | 17.43 | .681 |
| Coronary stents | 9.14 | 9.58 | 7.26 | .142 |
| Dilated cardiomyopathy | 11.29 | 12.29 | 7.02 | .002 |
| Aortic valve disease | 3.08 | 2.83 | 4.12 | .174 |
| LV hypertrophy due to hypertension | 15.66 | 15.41 | 16.71 | .514 |
| Previous tachycardia | 6.34 | 6.57 | 5.33 | .350 |
| Previous bradycardia | 5.37 | 5.21 | 6.05 | .495 |
| Pacemaker | 6.34 | 5.78 | 8.72 | .027 |
| Resynchroniser | 3.31 | 3.74 | 1.45 | .019 |
| ICD | 2.16 | 2.44 | 0.97 | .045 |
| AF-related history | ||||
| Type of AF | < .001 | |||
| Paroxysmal | 29.36 | 30.91 | 22.76 | |
| Persistent | 16.52 | 16.99 | 14.53 | |
| Long-term persistent | 4.69 | 4.20 | 6.78 | |
| Permanent | 49.42 | 47.90 | 55.93 | |
| Previous electrical cardioversion | 17.67 | 20.06 | 7.51 | < .001 |
| Previous pharmacological cardioversion | 22.32 | 22.95 | 19.61 | .142 |
| Previous AF ablation | 4.00 | 4.60 | 1.45 | .003 |
| Previous atrial closure | 0.32 | 0.34 | 0.24 | .750 |
| CHADS2scale | 2.24 ± 1.24 | 2.15 ± 1.22 | 2.46 ± 1.31 | < .001 |
| CHA2DS2-VASc scale | 3.70 ± 1.52 | 3.60 ± 1.45 | 4.15 ± 1.63 | < .001 |
| HAS-BLED scale | 2.01 ± 1.24 | 1.91 ± 1.12 | 2.40 ± 1.53 | < .001 |
| Sinus rhythm in baseline ECG | 33.63 | 36.79 | 20.15 | < .001 |
| AF in baseline ECG | 60.19 | 57.63 | 71.12 | < .001 |
AF, atrial fibrillation; COPD, chronic obstructive pulmonary disease; ECG, electrocardiogram; EF, ejection fraction; HF, heart failure; ICD, implantable cardioverter defibrillator; IM, internal medicine; LV, left ventricle; OSAS, obstructive sleep apnea syndrome; PC, primary care; TIA, transient ischemic attack.
Unless otherwise indicated, values are expressed as percentage or mean ± standard deviation.
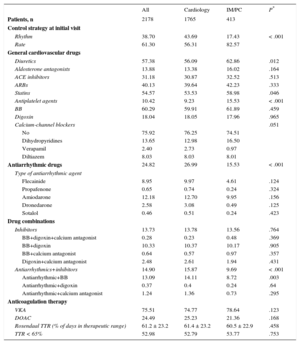
General cardiovascular drug therapy was similar in both groups, with a slightly higher proportion of diuretics, antiplatelet agents and statins in IM/PC patients (Table 2). Cardiologists used the rhythm control strategy more frequently (43.7% vs 17.3%; P < .001), although the rate control strategy prevailed in both groups (Table 2). A higher proportion of patients followed-up by cardiologists received prophylactic antiarrhythmic drugs (26.9% vs 15.3%, P < .001). All patients received anticoagulants, in line with the study design. In patients receiving vitamin K antagonists, time in therapeutic range calculated using the Rosendaal method was similar, approximately 61% of days (Table 2). The percentage of patients poorly controlled with vitamin K antagonists (time in therapeutic range < 65%) was high, > 50%, but was similar between the 2 groups (53.7% and 52.7%).
Pharmacological, Antiarrhythmic and Anticoagulant Treatment in the Total Series and Comparison Between Patients Attended by Cardiologists and Noncardiologists
| All | Cardiology | IM/PC | P* | |
|---|---|---|---|---|
| Patients, n | 2178 | 1765 | 413 | |
| Control strategy at initial visit | ||||
| Rhythm | 38.70 | 43.69 | 17.43 | < .001 |
| Rate | 61.30 | 56.31 | 82.57 | |
| General cardiovascular drugs | ||||
| Diuretics | 57.38 | 56.09 | 62.86 | .012 |
| Aldosterone antagonists | 13.88 | 13.38 | 16.02 | .164 |
| ACE inhibitors | 31.18 | 30.87 | 32.52 | .513 |
| ARBs | 40.13 | 39.64 | 42.23 | .333 |
| Statins | 54.57 | 53.53 | 58.98 | .046 |
| Antiplatelet agents | 10.42 | 9.23 | 15.53 | < .001 |
| BB | 60.29 | 59.91 | 61.89 | .459 |
| Digoxin | 18.04 | 18.05 | 17.96 | .965 |
| Calcium-channel blockers | .051 | |||
| No | 75.92 | 76.25 | 74.51 | |
| Dihydropyridines | 13.65 | 12.98 | 16.50 | |
| Verapamil | 2.40 | 2.73 | 0.97 | |
| Diltiazem | 8.03 | 8.03 | 8.01 | |
| Antiarrhythmic drugs | 24.82 | 26.99 | 15.53 | < .001 |
| Type of antiarrhythmic agent | ||||
| Flecainide | 8.95 | 9.97 | 4.61 | .124 |
| Propafenone | 0.65 | 0.74 | 0.24 | .324 |
| Amiodarone | 12.18 | 12.70 | 9.95 | .156 |
| Dronedarone | 2.58 | 3.08 | 0.49 | .125 |
| Sotalol | 0.46 | 0.51 | 0.24 | .423 |
| Drug combinations | ||||
| Inhibitors | 13.73 | 13.78 | 13.56 | .764 |
| BB+digoxin+calcium antagonist | 0.28 | 0.23 | 0.48 | .369 |
| BB+digoxin | 10.33 | 10.37 | 10.17 | .905 |
| BB+calcium antagonist | 0.64 | 0.57 | 0.97 | .357 |
| Digoxin+calcium antagonist | 2.48 | 2.61 | 1.94 | .431 |
| Antiarrhythmics+inhibitors | 14.90 | 15.87 | 9.69 | < .001 |
| Antiarrhythmic+BB | 13.09 | 14.11 | 8.72 | .003 |
| Antiarrhythmic+digoxin | 0.37 | 0.4 | 0.24 | .64 |
| Antiarrhythmic+calcium antagonist | 1.24 | 1.36 | 0.73 | .295 |
| Anticoagulation therapy | ||||
| VKA | 75.51 | 74.77 | 78.64 | .123 |
| DOAC | 24.49 | 25.23 | 21.36 | .168 |
| Rosendaal TTR (% of days in therapeutic range) | 61.2 ± 23.2 | 61.4 ± 23.2 | 60.5 ± 22.9 | .458 |
| TTR < 65% | 52.98 | 52.79 | 53.77 | .753 |
ACE inhibitors, angiotensin-converting enzyme inhibitors; ARB, angiotensin receptor blockers; BB, beta-blockers; DOAC, direct oral anticoagulants; IM, internal medicine; PC, primary care; TTR, time in therapeutic range; VKA, vitamin K antagonists.
Unless otherwise indicated, values are expressed as percentage or mean ± standard deviation.
Our study provides data on the differences in characteristics and treatment of patients with nonvalvular AF followed up by cardiologists and noncardiologists in a wide sample of patients in a “real-world” setting. Its main conclusions are as follows: a) in the sample analyzed, some differences were observed between patients attended by cardiologists and by noncardiologists: those seen by IM/PC were older (mean age 4 years older) and had a higher prevalence of comorbidities (especially diabetes mellitus, preserved heart failure, a higher Charlson comorbidity index, and higher CHA2DS2-VASc and HAS-BLED scores); b) there was a high prevalence of structural heart disease (approximately 50%); c) in general, antiarrhythmic treatment was essentially “conservative”, with a clear predominance of rate control over rhythm control strategies; d) rhythm control strategies and their associated procedures were much more widely used in patients followed up by cardiologists, which may be partly related to the age difference and the type of AF; and e) although all the patients had to receive anticoagulation therapy due to the study design, and consequently it is impossible to draw conclusions on differences in the appropriateness of the indications for anticoagulation, the quality of the anticoagulation in patients receiving vitamin K antagonists was poor and was similar between the 2 groups (more than 50% of the patients had a time in therapeutic range < 65%, with these data being similar to those reported by other recent studies in Spain).3,4 This situation must be improved, regardless of which setting provides treatment and follow-up.
FUNDINGThe FANTASIIA registry has an unconditional grant from Pfizer/Bristol-Myers-Squibb.
.