Keywords
INTRODUCTION
The aim of treatment after acute myocardial infarction (AMI) is to restore myocardial flow quickly, thereby improving the chance of functional recovery and short- and long-term prognosis.1,2 In some patients, adequate perfusion of the myocardial tissue is not obtained despite arterial patency.3,4 This phenomenon, known as "no reflow," is related to the lack of functional recovery in the damaged zone.5,6 Until present, angiographic methods have not especially useful for predicting recovery of the affected segments.7,8 The use of intracoronary Doppler guide wires has enabled investigators to study coronary flow and identify some flow patterns associated with microvascular damage and lack of functional recovery.9-13
Recently, it has become possible to study coronary flow by transthoracic Doppler spectroscopy thanks to the availability of high-frequency Doppler probes.14 Some studies have shown that this technique can detect microvascular damage. However, studies are lacking demonstrating the independent predictive value of this technique in combination with clinical variables that may influence myocardial damage and the type of procedure are laking. Therefore, the objectives of this study were to investigate different patterns of coronary flow in the left anterior descending (LAD) artery and how this and other clinical variables relate to short-term functional recovery and ventricular remodeling after primary percutaneous transluminal coronary angioplasty (PTCA).
METHODS
Patients
Over an inclusion period of 2 years, 190 patients were admitted to our hospital with signs and symptoms of anterior AMI. Primary angioplasty was defined as a procedure done without prior or concomitant fibrinolytic treatment in patients with a history of chest pain lasting less than 12 hours associated with ST-segment elevation (>0.1 mV at 2 or more adjacent leads) in the electrocardiogram (ECG) or new left bundle branch block.15 We screened 110 patients with their first myocardial infarction who underwent primary PCTA for inclusion. Of these, 30 presented heart failure of Killip grade greater than 3 and 4 patients died in the hospital and so were excluded from the study. Eight patients refused to participate in the study. The initial group therefore comprised 68 patients, although LAD flow was not obtained in 4 (5.9%) and 7 failed to attend the follow-up visit after 1 month. The final study population therefore comprised 57 patients, 11 women and 46 men, with a mean age of 59.67 years (range, 30-85).
Protocol
The study protocol was approved by the ethical committee of our hospital and all patients gave their informed consent in writing. Within 24 hours of onset of symptoms, all patients underwent angioplasty of the culprit lesion with coronary stent placement if necessary. In all cases, vessel patency was acceptable with residual stenosis of less than 30% and a TIMI anterograde flow III.
Between 48-72 hours after the procedure, LAD flow was determined. Assessment of sizes and segmental left ventricular wall motion scores was done at 72 hours and 1 month after the procedure.
Study of Coronary Flow
Images of the LAD artery were recorded with the Sonos 5500 device (Philips, Andover, Massachusetts, USA) using a high frequency S12 (5-12 MHz) transducer.
The LAD artery position was measured relative to a point proximal to the medioclavicular line in the fourth and fifth intercostal spaces, with the patient in left lateral decubitus. Once the anterior interventricular sulcus had been located in the short axis view, the ultrasound beam was scanned sideways to display the distal portion of the LAD artery with high-frequency color Doppler mapping (5 MHz), with velocities ranging from ±15 to ±19 cm/s and the field depth set to 7 cm. Blood flow was measured with pulsed Doppler signals. For this measurement, the ultrasound beam was aligned as parallel as possible to distal LAD flow. The frequency used in the pulsed Doppler scan was 5 MHz, with a sampling region of 1.9 mm. A contrast agent was used (Levovist 200 mg/mL in 0.5 mL boluses) to enhance the color and pulsed Doppler signal.
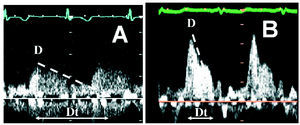
Doppler recordings of coronary flow were assessed by an experienced echocardiographer blinded to the baseline data of the patient. Peak systolic and diastolic velocities and deceleration time of the diastolic wave were measured, the latter being defined as the time between peak velocity and the time when the tangent of the deceleration curve crossed the velocity "0" cm/s axis (Figure 1). Patients were classified into 2 groups according to the type of coronary flow. Group 1 included patients with a normal flow pattern (Type A), that is, a diastolic wave with short deceleration time (>500 ms). Group 2 included patients with abnormal flow pattern (Type B), characterized by a fast diastolic wave and a deceleration time less than 500 milliseconds. The cutoff of 500 milliseconds was chosen in accordance with the previous studies done with intracoronary Doppler guide wires.12,13

Figure 1. A: Normal coronary flow pattern in the left anterior descending artery, comprising a diastolic wave with a slow deceleration gradient and prolonged deceleration time. B: abnormal coronary flow pattern of the left anterior descending artery, with a high-velocity diastolic wave and rapid deceleration. Dt indicates deceleration time.
Wall Motion Assessment
In order to study left ventricular size and wall motion, an S3 probe (Philips, Andover, Massachusetts, USA) was used. Parasternal long- and short axis views of the left ventricle, as well as the 2- and 4-chamber apical views, were determined. The measurements were recorded and subsequently assessed by an experienced observer blinded to the coronary flow.
The left ventricular volume and ejection fraction were calculated using the biplanar Simpson method. The segmental wall motion score was then determined for 16 segments in the left ventircle according to the American Society for Echocardiography.16 One point was assigned for normal wall motion, 2 for hypokinesia, 3 for akinesia, and 4 for dyskinesia. The overall regional wall motion score and the regional wall motion score in the territory dependent on the LAD artery were calculated. In the latter case, 9 segments were chosen that are commonly accepted as dependent on the LAD artery, namely, the 4 apical segments, the anterior basal and medial septal segments, the posterior medial septal segment, and the anterior basal and medial segments.
The differences between the findings during the acute phase and the findings after 1 month were considered significant when they exceeded the intraobserver variability in our laboratory--5% for the left ventricular ejection fraction (LVEF) and 5 mL/m2 for the volumes. An increase in systolic volume of more than 5 mL/m2 was indicative of ventricular dilation and, therefore, of pathological remodeling.
An improvement of 1 point in at least 3 of the 9 segments was considered indicative of viability in the anterior zone, that is, a decrease in the regional wall motion score of the LAD territory of at least 0.33.
Statistical Analysis
Continuous variables were expressed as mean (SD) and compared with the Student t test for paired and unpaired data. Categoric variables were represented as percentages and compared with the χ² test or the Fisher exact test if necessary. The multivariate analysis was done with a logistic regression model that included, in addition to the characteristic under study, the following variables: age, sex, coronary risk factors, time until vessel patency, and treatment at the time of discharge. Spearman correlation coefficients were calculated in all cases. P values less than .05 were considered statistically significant. The statistical analysis was performed with the SPSS statistical package, version 9.0.
RESULTS
Baseline Characteristics of the Patients
Thirty-one patients (54%) were included in Group 1 (corresponding to normal flow pattern) and 26 (46%) were included in Group 2 (abnormal flow pattern) (Figure 1). Table 1 presents the clinical characteristics of the patients in both groups. Group 2 included a greater proportion of diabetic patients and these patients were also older. There were no differences in time elapsed until vessel patency was achieved, TIMI flow, and peak creatinine kinase (CK) level. The baseline study showed that patients in Group 2 had a greater end-systolic volume, lower LVEF, and worse regional segmental wall motion scores.

Echocardiographic Assessment After 1 Month
In the follow-up of the acute episode after 1 month, patients in Group 1 still had higher ventricular volumes, higher segmental wall motion scores, and more favorable LVEF than patients in Group 2 (Table 2).

The volumes showed no significant differences with respect to baseline data for patients in Group 1. In contrast, those in Group 2 showed a significant increase in end-diastolic volumes (55.8 [12.9] mL/m² vs 62.9 [16.8] mL/m²; P<.05) and end-systolic volumes (32.2 [9.5] mL/m² vs 37.1 [14.9] mL/m²; P<.05) (Figure 2). The regional wall motion scores improved in patients in Group 1 and showed no significant changes in Group 2 (Figure 3).

Figure 2. Change in left ventricular volumes. Data are presented as mean (SD). To avoid overlay, only a positive or negative deviation is represented. The squares represent the end-diastolic volume and the triangles the end-systolic volume. The dark markers represent the patients from Group 1 and the light ones patients from Group 2. The patients from Group 2 showed a significant increase in ventricular volumes 1 month after infarction. EDV indicates end-diastolic volume; ESV, end-systolic volume.

Figure 3. Change in left ventricular regional wall motion score. Data and dispersion are presented as for Figure 2. The squares represent the overall segmental wall motion score (SWMS) and the triangles the regional wall motion score of the anterior territory (RWMS-LAD). The dark markers represent the patients from Group 1 and the light ones patients from Group 2. The regional wall motion of the patients in Group 2 did not improve at 1 month after infarction, whereas this variable improved in patients in Group 1.
Finally, LVEF improved significantly in patients in Group 1, increasing from 46.8% (8.6%) to 52.6% (8.8%) (P<.01), whereas there were no changes in Group 2 (42.4% [8.1%] vs 42.4% [9,6%]; P=NS).
Coronary Flow Pattern and Prediction of Functional Recovery and Pathological Remodeling
Seventeen patients showed pathological ventricular remodeling, that is, the end-diastolic volume increased. Of these, 12 (70%) had a Type B flow pattern. In contrast, after 1 month of follow-up, LVEF did not improve in 28 patients, of whom 17 (61%) were in Group 2.
In addition to coronary flow pattern, clinical data such as age and sex, and risk factors such as smoking, hypercholesterolemia, and diabetes were included in the multivariate analysis, as well as treatment variables such as medication administered at the time of discharge and time to PTCA. The variables that were independent predictors of lack of improvement in LVEF were Type B coronary flow (P<.05) and previous hypertension (P<.05). Variables predictive of increase in left ventricular end-systolic volume were Type B flow pattern (P<.01) and smoking (P<.05). Finally, predictors of the lack of functional recovery in the LAD artery territory were Type B flow pattern (P<.05) and hypercholesterolemia (P<.05) (Table 3).

Time to revascularization of the culprit artery was a factor that showed a tendency to be associated with lack of viability of the anterior territory, although this was not statistically significant (P=.098).
DISCUSSION
Our study showed that assessment of coronary flow by transthoracic Doppler spectroscopy is a simple and noninvasive method that can identify patients with greatest microvascular damage and, as a result, a worse clinical course after primary PTCA. In our patients, the presence of Type B flow pattern, characterized by rapid deceleration of the diastolic wave, was associated with a lack of functional recovery of the infarct zone and short-term ventricular dilation.
Macrovascular Damage and Coronary Flow Pattern in the Acute Phase of Acute Myocardial Infarction
Conservation of coronary microvasculature after myocardial infarction is essential for functional recovery.17-19 The pathophysiological manifestations of microvascular damage are a reduction in the capillary and arteriolar bed in the infarct zone.6,19 Along with this structural loss associated with large transmural infarcts, other pathophysiological mechanisms triggered by reperfusion, such as presence of oxygen free radicals,20 microvascular spasm,21 edema,22 or microembolization,23 ultimately cause increased resistance to epicardial coronary artery flow on which this microvasculature depends.24-26 The end result is a considerable decrease in the extent of effective capillary bed that refills rapidly in the early diastolic phase. This would explain the flow pattern in the epicardial artery, that is, a high-velocity diastolic wave followed by a rapid deceleration and a late slow flow, as we saw in the Type B flow pattern of Figure 1.
Transthoracic Assessment of Microvascular Damage After Acute Myocardial Infarction
Detection of microvascular damage plays an important part in the stratification of prognosis after reperfused AMI.17 Until now, the most reliable method was analysis of coronary flow using intracoronary Doppler guide wires.12,13 The flow pattern obtained with this method was similar to the one found with transthoracic Doppler spectroscopy and was associated with microvascular damage in patients with large transmural infarctions and in those with the no-reflux phenomenon after reperfusion.27-29 Another method that has bee n shown to be equally effective is the study of the coronary flow reserve in response to coronary vasodilation.11
Few studies have used transthoracic Doppler spectroscopy to assess microvascular damage. In our study, we show that this method is feasible. We obtained adequate flow determinations in 64 of the 68 patients initially assessed, corresponding to a success rate of 94%. We could thus identify patients who were going to present short-term ventricular dilation (odds ratio [OR] =6.14; P<.01). In the study of Voci et al,30 none of the Doppler variables proved useful and only the presence of collateral vessels was predictive of functional recovery of the infarct zone. However, in the study of Hozumi et al,31 who used a similar methodology to ours, a significant correlation was reported between the deceleration time of the diastolic wave and improvement in the regional wall motion score of the infarct zone. The cutoff point in their study was 600 milliseconds. Our cutoff point was set to 500 milliseconds, in accordance with the guidelines for intracoronary Doppler examinations.4,9,12,27 Finally, Iwakura et al,32 in a recent study, showed that the coronary flow pattern assessed by transthoracic Doppler spectroscopy was the strongest predictor of the no-reflux phenomenon, stronger even than angiographic, electrocardiographic, or enzymatic variables.
In our study, patients with an abnormal flow pattern were elderly and had a higher incidence of diabetes. In addition, according to the baseline study, these patients started with a slightly lower LVEF. This all agrees with what has been published by other investigators in studies limited to the acute phase of AMI.12,13,32 Our study has the added value of follow-up at 1 month and a multivariate analysis. In this analysis, we found that the coronary flow pattern retained its independent predictive value for the lack of functional recovery and pathological ventricular remodeling despite the inclusion of clinical variables and therapeutic procedure.
Limitations
To determine coronary flow by transthoracic Doppler spectroscopy, a special probe is required and the operator needs a certain amount of training. In our group, the success rate is greater than 80%. Some investigators have criticized this flow pattern and have indicated that its presence might be an artefact due to the closeness of the Doppler probe to the vessel walls.33 However, studies done with intracoronary Doppler guide wires have clearly described this same pattern in patients with revascularized AMI.4,9,27 This explanation therefore does not seem feasible. The cutoff point for the deceleration time of the diastolic velocity is not well defined in the literature. Long deceleration times are related to functional recovery whereas short times are not. In our study, the cutoff point of 500 milliseconds was established after assessment of the findings from published intracoronary studies. The number of patients included was small and follow-up was short. Nevertheless, the level of significance attained was fairly acceptable, both for assessment of overall ventricular function and for ventricular dilation. When assessing viability in the infarct zone, a larger sample size would have increased the power of the study. Finally, the study was limited to patients with anterior AMI because coronary flow in other arteries can generally be determined in fewer patients (50% in our case). A longer follow-up would be needed to confirm the findings presented here.
CONCLUSIONS
After revascularized anterior AMI, assessment of LAD coronary flow by transthoracic Doppler spectroscopy can identify patients with microvascular damage who, in the short term, progress to ventricular dilation without recovering regional function in the infarct zone.
Correspondence: Dr. G. de la Morena.
Servicio de Cardiología. Hospital Universitario Virgen de la Arrixaca.
Ctra. Madrid-Cartagena, s/n. El Palmar. 30110 Murcia. España.
E-mail: gdlmorena@yahoo.es
Manuscript received August 1, 2005.
Accepted for publication January 12, 2006.