Keywords
INTRODUCTION
Therapy for acute myocardial infarction is focused on opening the thrombotic occlusion in the epicardial coronary artery.1-3 However, it has been demonstrated that even when angiography suggests favorable restoration of perfusion, the microcirculation remains affected in a considerable percentage (approximately one-third) of patients.4-6 This "no-reflow" phenomenon is multifactorial and has been related to a poor prognosis.7-16
In patients with apparently normal angiography the microcirculation can be reliably studied by using myocardial echocardiography with intracoronary injection of contrast medium (ic-MCE).4,17 However, this technique is invasive. Analysis by myocardial echocardiography with intravenous contrast injection (iv-MCE) has been presented as a potentially useful technique for the study of coronary perfusion. Advances in echocardiographic equipment, contrast material, and measurement techniques have increased the reliability of this method.18-26
In the present study we assess the usefulness of quantitative iv-MCE analysis for evaluating coronary perfusion in the infarction area in patients with single-vessel disease and a patent artery, using ic-MCE as the reference method for such comparison.
PATIENTS AND METHOD
Study Group
We studied 42 patients with a first episode of ST-segment elevation acute myocardial infarction (typical chest pain lasting more than 30 min with ST segment elevation of >1 mm at 80 ms from the J point in more than one lead that did not normalize with nitroglycerin, and elevated markers of cardiac injury) treated with thrombolysis within the first six hours after the onset of the clinical symptoms. The Ethics Committee of our institution approved the study, and all patients gave consent to participate.
The exclusion criteria were a known history of heart disease (ischemic or other), significant involvement of an artery other than the one causing the infarction (>50% stenotic lesion on coronary angiography), non-patent infarction-related artery following the pre-discharge cardiac catheterization, or presence of a poor echocardiographic window.
Cardiac Catheterization
Pre-discharge cardiac catheterization (5±2 days postinfarction) using a femoral approach was performed at least 48 h after the infarction. In cases in which the infarct-related artery was occluded or showed >50% stenosis, revascularization with stent implantation performed (n=35, 83%). The vessel causing the infarction was the left anterior descending artery in 25 cases and the right coronary artery in 17. Following angioplasty (or the diagnostic study in cases of non-significant stenosis), all the patients had a patent culprit artery (<50% residual stenosis and TIMI 3 flow). Quantification of residual stenosis, TIMI flow and ejection fraction was done by an independent laboratory (ICICOR, Instituto de Ciencias del Corazón, Valladolid, Spain).
Myocardial Echocardiography With Intracoronary Contrast Injection
After assessing the degree of angiographic perfusion, ic-MCE was undertaken according to the previously established protocol used in our coronary catheterization unit.17 Briefly, a 1-mL intracoronary bolus of Levovist (Schering AG, Germany) followed by 5 mL of saline solution was administered through the catheter in the culprit artery, using apical 2- and 4-chamber views. When the results for any segment were inconclusive, a second bolus was administered. Initially, a division into 17 segments was contemplated27; however, for the purposes of the study and with the aim of analyzing the same segments with ic-MCE and iv-MCE, only the 13 segments from the apical 2- and 4-chamber views were assessed.
Real-time studies with second harmonic imaging were done with a Ving Med 750 echocardiograph (General Electric, USA). Settings for gain, depth, and compression were held constant. The images were recorded on a Super VHS video recorder and digitally captured for the analysis.
The perfusion observed in the echocardiographic images was measured with the ICARO software (IntraCoronary and Magnetic Resonance Observation, Grupo de Bioingeniería, Electrónica y Telemedicina, Universidad Politécnica de Valencia, Valencia, Spain) developed with a software package specifically designed for image treatment and quantification: MATLAB 6.5 (The Mathworks Inc., Natick, Massachusetts, USA).28,29 The region of interest (matrix of 4x4 pixels) was placed in the center of each segment corresponding to the infarction area. We used this relatively small matrix to avoid erroneous detection of other areas as regions of interest, e.g. the chamber, external area of the myocardium or areas pertaining to neighboring segments, since this would have produced equivocal effects in the final quantification.
A normalized scale was used in both the ic-MCE and iv-MCE quantification studies in order to obtain perfusion values that were comparable between the different segments and patients, and to avoid the inherent non-linear relationship between the video intensity and the acoustic signal. In each segment the baseline video intensity was subtracted, and the value obtained was normalized by the range of intensity (peak intensity-baseline intensity) found in a segment with preserved contractility (in all cases resulting in a normalized, unitless value of 0 to 1). Perfusion was considered to be normal in segments with a normalized intensity >0.75. In the analysis by patients, cases with 2 or more hypoperfused segments (≤0.75) were considered to have abnormal perfusion. Lastly, we calculated the mean perfusion value of the infarcted region (sum of the intensities of all segments divided by the number of segments quantified).
Ic-MCE quantification was done by an experienced observer who was unaware of the result assigned in the other examinations. Interobserver variability for the existence of normal perfusion was analyzed in 15 patients and the results concurred in 14 studies (variability of 7%). Intraobserver variability in the analysis of perfusion in these 15 patients was 0%.
Contractility was measured in the segments in the area of infarction (0=normal, 1=hypokinesia, 2=severe hypokinesia, 3=akinesia, 4=dyskinesia), and the mean contractility in the affected region was calculated.
Myocardial Echocardiography With Intravenous Contrast Injection
Intravenous myocardial contrast echocardiography was performed 8±2 days after the infarction, at least 48 h after cardiac catheterization and the ic-MCE study. We analyzed the same 13 segments in the apical 2- and 4-chamber views that had been assessed with ic-MCE. An Agilent Sonos 5500 echocardiograph (Philips, The Netherlands) was used for the iv-MCE study and the images were recorded on magneto-optic disc for subsequent quantification.
A 1.5-mL bolus of SonoVue contrast material (Bracco International B.V., The Netherlands) was administered intravenously, followed by perfusion of 1 mL/min, adjusted manually to minimize the attenuation. The focus was set at the area of the mitral valve, except in cases of a suspected apical defect, in which it was moved toward the apex. Gain settings were optimized and were held constant during the study. A high mechanical index (1.6) was applied using power angio imaging. Once an optimum, stable level of contrast infusion had been attained, electrocardiographic triggering was programmed to capture one out of every 6 cycles at end-systole (300 ms from the R-wave). The high mechanical index delivered destroyed the microbubbles. To consider an image valid for the study, the absence of contrast from the myocardial wall was confirmed in the image automatically acquired by the equipment following the pulse used for the perfusion analysis.
The same quantification method employed for ic-MCE was used. Starting from the best point in the area under the receiver operator characteristic curve to predict a normalized intensity >0.75 in the ic-MCE, we considered that segments showing a normalized intensity >0.9 presented normal perfusion. Patients were considered to have abnormal perfusion when 2 or more segments were hypoperfused (≤0.9). Lastly, the mean perfusion in the infarcted area was calculated as the sum of the intensity of all segments divided by the number of segments quantified.
Quantification of iv-MCE was performed by an experienced observer who had no knowledge of the results assigned for the other examinations. Interobserver variability for the existence of normal perfusion was analyzed in 15 patients and results concurred in 13 studies (variability, 13%). Intraobserver variability in these same 15 cases was 7% (results concurred in 14 cases in 2 observations for the same patients made on different days by the same observer).
Statistical Analysis
Continuous values were expressed as the mean ± standard deviation. Categorical values were expressed as percentages of the study population and compared with the χ² test. Ic-MCE was considered to be the reference technique for normal perfusion. The area below the receiver operator characteristic curve was calculated to determine the reliability of iv-MCE and the best cut-off point to predict normal perfusion as measured by ic-MCE. We determined the sensitivity (percentage of patients/segments with an abnormal ic-MCE study that presented an abnormal iv-MCE), specificity (percentage of patients/segments with a normal ic-MCE that presented a normal iv-MCE), positive predictive value (percentage of patients/segments with an abnormal iv-MCE that presented an abnormal ic-MCE), negative predictive value (percentage of patients/segments with a normal iv-MCE that presented a normal ic-MCE),and the Kappa index. Pearson correlation coefficients between the perfusion status analyzed by ic-MCE or iv-MCE (comparison between segments and between the mean of the infarcted region) were calculated. All statistical analyses were done with SPSS 9.0 (Chicago, Illinois, USA). Significance was set at a P-value of <.05 in all cases.
RESULTS
The characteristics of the 42 patients included in the study group are shown in Table 1.

Analysis by Segments
The mean contractility value for the infarcted region was 1.7±0.7 and there was at least 1 dysfunctional segment in all patients (mean 3.6±1.1 dysfunctional segments per patient).
Ic-MCE adequately assessed 195 of the 210 segments (5 per patient) corresponding to the infarcted territories analyzed (93%). The ic-MCE study lengthened catheterization time by 6±2 min and the quantification in each case lasted 5±1 min.
Analysis by iv-MCE was done in 546 segments (13 per patient), of which 88 (16%) were not adequately assessed. There was a higher percentage of non-assessable segments (mainly due to attenuation problems) in the lateral area (21% of the segments vs 6% in the other areas; P<.0001). Iv-MCE adequately assessed 186 of the 210 segments (5 per patient) corresponding to the infarcted territories analyzed (88%). The quantification lasted 5±1 min in each case.
The results according to analysis by segment were focused on the 176 segments pertaining to infarcted territories analyzed adequately by both ic-MCE and iv-MCE. Perfusion analyzed by ic-MCE was normal in 141 segments (80%) and abnormal in 35 segments (20%). Perfusion analyzed by iv-MCE was normal in 141 segments (80%) and abnormal in 35 segments (20%).
Segments with normal iv-MCE findings presented normal perfusion by ic-MCE in a higher percentage of cases than those with altered iv-MCE (130/141, 92% vs 11/35, 31%; P<.0001). In the analysis by segments, the diagnostic precision of iv-MCE to predict the perfusion status as determined by ic-MCE was 87.5%. The sensitivity, specificity, predictive values and area under the curve of iv-MCE to predict the perfusion status with ic-MCE are shown in Table 2. The Kappa index between ic-MCE and iv-MCE was 0.55. The Pearson correlation coefficient between iv-MCE and ic-MCE as continuous variables was r=0.71; P<.0001.

Analysis by Patients
Normal perfusion by ic-MCE (0-1 segment with abnormal perfusion) was observed in 31 (74%) patients, whereas 11 (26%) showed altered ic-MCE (2 or more segments with abnormal perfusion).
By iv-MCE, normal perfusion (0-1 segment with altered perfusion) was observed in 27 (64%) patients, whereas 15 (36%) showed abnormal iv-MCE results (2 or more segments with altered perfusion).
The patients with normal perfusion analysis by iv-MCE presented a higher percentage of cases with normal ic-MCE than those with altered iv-MCE (26/27, 96%, vs 5/15, 33%; P<.0001). The diagnostic precision of iv-MCE to predict the perfusion status with ic-MCE in the analysis by patients was 85.7%. The sensitivity, specificity, predictive values and area under the curve of iv-MCE to predict perfusion status with ic-MCE in the analysis by patients is shown in Table 2. The Kappa index between ic-MCE and iv-MCE in the analysis by patients was 0.67. There was a close correlation between mean perfusion in the segments of the infarcted area as measured by iv-MCE and the mean perfusion in the same segments as measured by ic-MCE (r=0.86; P<.0001). This correlation was seen both in patients with anterior (n=25; r=0.82; P<.0001) and inferior (n=17; r=0.79; P<.001) infarction.
DISCUSSION
The main finding of this investigation is that a quantitative study using iv-MCE is useful for assessing the status of coronary perfusion in patients with myocardial infarction and a patent culprit artery when compared with a reference technique, in this case ic-MCE. Quantitative analysis of single images captured during intravenous contrast perfusion is a simple, fast and valid method for analyzing microcirculation in these patients.
Myocardial Echocardiography
With Intracoronary Contrast Injection
In keeping with the results of the pioneer study by Ito et al,4 as well as later studies by the same author and other investigators,4,7,8,13,14 around one-fourth of patients (26%) with TIMI 3 flow presented microcirculation damage. In the experience of other authors13 and our group,17 ic-MCE has proven to be a safe and valid technique for the study of microvascular perfusion as well as a key predictor of systolic functional recovery and ventricular remodeling. Hence, we chose this technique as the reference method to assess the usefulness of iv-MCE in the analysis of coronary perfusion following myocardial infarction.
Myocardial Echocardiography With Intravenous Contrast Injection
Microvascular injury following infarction in patients with an open artery can be detected by angiographic indicators such as myocardial blush and TIMI frame count,14 or, more accurately, by ic-MCE study.17 Nevertheless, these methods are invasive, and there is a need to investigate the information provided by non-invasive techniques.
The first iv-MCE assessments mainly involved qualitative evaluation10,20,21,24 with not well standardized study protocols. A reliable assessment of iv-MCE requires a quantitative analysis.18,25,26 The current study protocols can be generally summarized into 2 models:
1. Analysis of myocardial flow.19,25,26 Qualitative estimation of myocardial flow can be done by using either a high mechanical index with gradual increases in the intervals between the pulses (multi-triggering) or a low mechanical index in real time (product of plateau video intensity and slope of contrast velocity). This is a valid method, but acquisition and quantification of the data is technically demanding and costly.
2. Analysis of single images captured during intravenous contrast perfusion.10,11,20,21,23 Using a high mechanical index with trigger setting in end-diastole, an image is captured in one out of every 4 or 6 cycles (sufficient time to restore the contrast plateau after the microbubbles are destroyed by the previous pulse) and perfusion in each segment is analyzed in a single image. This method has been used to perform semiquantitative analyses and a correlation with myocardial flow has not been demonstrated.
Because of its relative simplicity, we used the second method described, and investigated the correlation of quantitative perfusion analysis between iv-MCE and ic-MCE. In most cases, the quality of the images was excellent (Figure), the measurement was fast (mean, 5 min) and the correlation with the reference method (ic-MCE) was very good. In the analysis by segments as well as by patients, the negative predictive value was very high (normal perfusion on iv-MCE almost guaranteed normal perfusion on ic-MCE) but the positive predictive value was moderate; there were cases in which iv-MCE indicated a perfusion defect, whereas ic-MCE showed preserved perfusion, in all likelihood because of attenuation problems, insufficient contrast arrival, or deficiencies inherent to the technique. The correlation in the analysis by patients was closer than the analysis by segments, perhaps because the overall analysis of perfusion of a territory is more reliable than that of a separate segment. Lastly, we should point out a problem in image quality that impeded accurate quantification in 16% of the segments, which is consistent with the findings of other series, particularly for the lateral areas.23 Nevertheless, the problem related with lateral segments did not affect our results; since none of the potential participants with lateral infarction met the inclusion criteria of the study, all the patients included had anterior or inferior infarctions.

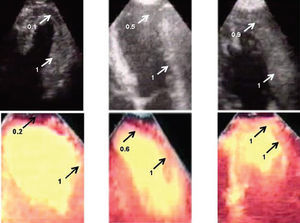
Figure 1. Three examples of patients with anterior infarction. Quantification of perfusion in the anteroapical segment was normalized by the anterobasal segment (reference segment, intensity =1). The upper panels show contrast echocardiography with intracoronary injection and the lower panels show contrast echocardiography with intravenous injection in the same patients. In the panels on the left, a severe apical perfusion defect is observed, in the center panels there is a moderate apical defect, and in the panels on the right there is normal apical perfusion.
The use of quantitative methods for iv-MCE analysis is still limited. There are no available concordance data between iv-MCE and ic-MCE, and most studies have focused on analyzing the capacity of iv-MCE to predict systolic recovery following infarction.25,26 Along this line of investigation, we recently observed that both ic-MCE and iv-MCE are useful techniques with comparable reliability for predicting the state of systolic function and the extent of necrosis (as assessed by cardiac magnetic resonance imaging) in the months following the event.30
Technical Considerations
Considering the different kinetics of the contrast used, the ic-MCE and iv-MCE studies used different echocardiographs (due to logistic reasons), contrast agents and study protocols. The large quantity of microbubbles reaching the myocardium after injection of the intracoronary contrast bolus resulted in excellent real-time and second harmonic images1,4,17 with ic-MCE (Figure); hence the use of special perfusion software was unnecessary. Our choice of intracoronary contrast was based on the findings and safety data obtained by other groups31 and was the one which, in our experience, provided the highest quality images without side effects.17
In contrast, the iv-MCE studies encounter the problem of a paucity of bubbles reaching the myocardium and their rapid destruction by the ultrasound pulses. For this reason continuous contrast perfusion and specific software is required. We used a late-generation echocardiograph for these studies. The choice of the contrast agent was based on our extensive experience and excellent results obtained, as well as the fact that in our learning curve it was the one that provided the best image quality without side effects.30,32
Limitations
The use of different contrast agents and study protocols for ic-MCE and iv-MCE may have had some influence on the final results. Progressive improvement of myocardial perfusion has been reported in some cases of infarction with a patent artery.17,33 Since the iv-MCE study was delayed respect to the ic-MCE study, one might speculate that simultaneous performance of the two techniques might have resulted in a higher concordance between them.
Clinical Implications
Intravenous myocardial contrast echocardiography is still in the stage of development and investigation. However, its routine use in echocardiography units is becoming more frequent, mainly for diagnosing ischemia (in combination with physical and pharmacological stress testing) and assessing the microcirculation following infarction.
In an optimum scenario for evaluating damage to the coronary microcirculation, as was the series presented (patients with a first-ever infarction, single-vessel disease and patent culprit artery), we observed that iv-MCE is useful for studying coronary perfusion. The quantification of single images captured during intravenous contrast perfusion is a simple, fast and valid technique when compared with ic-MCE. Normal perfusion detected on iv-MCE suggests preserved perfusion with a high probability; nonetheless we found that false detection of hypoperfusion occurred in one-third of the patients, probably in relation to attenuation problems, insufficient entrance of contrast or problems inherent to the technique.
While awaiting improvements in the equipment, contrast agents and study protocols, the method proposed may be of help to echocardiography units for the study of postinfarction perfusion.
This study was funded by Fondo de Investigación Sanitaria (FIS) Grant No. PI030013 from the Instituto de Salud Carlos and by the RECAVA-FIS grant.
Correspondence: Dr. V. Bodí.
Servicio de Cardiología. Hospital Clínic i Universitari.
Avenida Blasco Ibáñez, 17. 46010 Valencia. España.
E-mail: vicentbodi@hotmail.com