Keywords
INTRODUCTION
The evidence on the efficacy of a treatment or intervention derives from randomized clinical trials, which have the best design to assess treatment efficacy.1 One of the limitations of this approach is the generalization of the results to the rest of the population (external validity).1 For this reason, the evaluation of the effect of treatment in the general population--its effectiveness--by means of observational studies is also of interest.2 Observational studies have classically been reported to overestimate the treatment effect,3 although some authors have found no differences between the results of observational studies and randomized clinical trials.4 The major limitation of observational studies is the fact that treatment is not randomly assigned. Thus, there is a selection bias that may indicate that the observed treatment effect could be related to the baseline characteristics of the treated and untreated patients rather than to the treatment itself. Multivariate statistical analysis is normally employed to control the differences, but these methods are not perfect.
In 1983, Rosenbaum and Rubin5 proposed a new method for controlling this bias: calculating the individual probability, influenced by certain covariates, of receiving a treatment, the propensity score (PS). In recent years, the use of this method in observational studies is increasing considerably.6
The main objective of this report is to present a practical application of this statistical method, discussing its advantages and limitations. We analyze the association between myocardial reperfusion therapy and 28-day lethality in patients with acute myocardial infarction (AMI) ranging between 25 and 74 years of age who reached a hospital alive within the first 12 hours of onset of symptoms and were enrolled in the IBERICA (Research, Specific Search and Registry of Acute Coronary Events) study.
METHOD
Study Design
The study design, methods and quality controls have been described in detail elsewhere.7-9 Briefly, the IBERICA study, which was initiated in 1996, is a population-based registry that records cases of AMI in individuals between the ages of 25 and 74 years residing in 7 regions of Spain: Castile-La Mancha (Toledo and Albacete), Girona, Majorca, Murcia, Navarre, the Basque Country, and Valencia (metropolitan area).8,9
We present the data from patients who reached the hospitals of the participating localities alive. The study period began on 1 January 1997 and ended on 31 December 1998.
Case Identification and Classification
For the detection of patients hospitalized with AMI, a search was carried out in all the hospitals of the participating localities; the sources of information were the coronary care units (CCU), the cardiology service, hospital admission and emergency room records and death certificates. On the basis of the clinical and electrocardiographic features, enzyme profile and autopsy (when performed), each case investigated was classified as definite AMI, possible AMI, non-AMI, or having insufficient data, according to the criteria of the MONICA study.10 The analysis included those patients who reached the hospital alive and were classified as definite AMI (alive or dead) and possible AMI patients who died. AMI was considered to be definite in living patients when a Q wave was present on an electrocardiogram or in the presence of electrocardiographic changes suggestive of ischemia, with typical symptoms and myocardial enzyme (creatine kinase) levels more than two-fold higher than the maximum reference value. In those who died, AMI was considered to be definite when autopsy revealed signs of coronary thrombosis or recent myocardial necrosis. The possible AMI group consisted of individuals who did not meet the criteria for definite AMI and died with the typical symptoms or when autopsy revealed signs of coronary arteriosclerosis or ischemic heart disease.
Variables Studied
In each registered case, information was collected on the administration of reperfusion therapy, distinguishing between thrombolysis and percutaneous coronary intervention (PCI). In patients who underwent thrombolysis, the delay between hospital arrival and treatment (door-to-needle time) was recorded.
In addition, information was gathered on their cardiovascular risk factors, history of ischemic heart disease and heart failure, and clinical variables related to the AMI (AMI site and Killip class on admission), as well as hospital type (basic, without CCU or hemodynamic laboratory; intermediate, with CCU but no hemodynamic laboratory; or advanced, with both facilities) and CCU admission.
The vital status at 28 days was ascertained by means of clinical follow-up and death records.
Statistical Analysis
Student's t test or the Mann-Whitney U test was used to compare the continuous variables in the 2 groups, while χ² test was employed in the comparison of the categorical variables.
The analysis of the association between reperfusion therapy and the 28-day case lethality was performed using logistic regression models, including the confounding variables and certain clinically relevant variables.
Statistical Analysis Based on the Propensity Score for Receiving Reperfusion Therapy
The PS for receiving thrombolysis, PCI or either of the 2 reperfusion therapies was calculated on the basis of the demographic and clinical characteristics of each patient.11 Discriminant analysis or logistic regression can be used to perform this calculation. The advantage of logistic regression is that the variables do not have to show a normal distribution. In our example, all the demographic and clinical characteristics and all the bivariate interactions between these variables were initially included in 3 different logistic regression models to predict the utilization of these reperfusion therapies. Then the variables and interactions that did not reach a predetermined level of statistical significance (P<.15) were eliminated. In this way, we calculated the PS, conditional on a series of covariates, for receiving these therapies:
P(Z=1|X1,..., Xn)=P(Z)
Where Z is the therapy analyzed and X1 and Xn are the covariables that predict its use. The discriminatory power of each of these models was analyzed by calculating the area under the receiver operating characteristic (ROC) curve. The models were considered to have a good discriminatory power when this area was greater than or equal to 0.80.
Once the PS was calculated, one of three different analytical strategies could be employed.6 One of the approaches most frequently utilized is to analyze the association between the therapy and the event of interest (in our study, the 28-day case lethality) using logistic regression models that include the variable of interest, the calculated PS and a reduced number of covariates.
Another possible strategy is to match treated and untreated patients. Several methods for achieving these matches have been proposed.12 One of those most commonly utilized involves the matching of each treated patient with an untreated patient who has a similar PS for receiving therapy, defined by a range delimited by the PS of the treated patient, plus or minus a given proportion of the standard deviation of the PS.12 The calculated PS, P(Z), does not usually show a normal distribution, which makes matching by this method difficult. To normalize the PS, thus making it easier to achieve matches, the calculation of the logit of the PS for receiving therapy (logit of P(Z)=log10 [(1-P(Z))/P(Z)]) and the utilization of the range defined by one fourth of its standard deviation has been proposed.12 To achieve matches under these conditions, we employed the SAS macro "Match."13 Once matching had been carried out, we evaluated its effectiveness by determining whether there were differences in the covariables of interest corresponding to treated and untreated patients in the sample of matched patients. These differences can be assessed by comparison of means and proportions or by calculating the standardized differences between treated and untreated patients.
A third analytical strategy involves the stratification of the patients included in the analysis. It was determined that by defining five groups or strata according to the quintiles of the calculated PS, 90% of the bias owing to the differences in the stratification variables for the treated and untreated groups was eliminated.14 Subsequently, the association between the reperfusion modality being evaluated and the 28-day lethality was calculated in each group using conventional regression models. The data corresponding to this analytical strategy are not presented here.
Finally, to evaluate the effect of missing data on the PS for receiving therapy, we compared the characteristics of the patients for whom the data was insufficient and those for whom complete valid data had been collected. Two strategies were used to analyze the effect of these cases. In one, the missing data required for the calculation of the PS were completed with the medians of each of these variables. In the other, the multiple imputation method of the SAS was employed to estimate the PS for receiving the treatment of interest based on age, sex, and time elapsed before reaching the hospital (variables for which the data was complete in every case) (PROC MI), and to calculate the association between the reperfusion therapies and fatality (PROC MIANANLYZE).15
The statistical analyses were performed using the SPSS and SAS software packages.
RESULTS
A total of 8155 AMI in patients between the ages of 25 and 74 years who reached a hospital alive were registered during the study period. Information concerning the time elapsed between the onset of symptoms and arrival at a hospital was not available in 662 cases (8.1%). In all, 6333 patients reached the hospital within 12 hours of the onset of symptoms; it was not known whether reperfusion had been performed in 26 of these cases (0.4%).
The differences between the patients who underwent myocardial reperfusion and those who did not are summarized in Table 1. In the untreated group, the patients were older and there were higher proportions of women, of patients with histories of hypertension, diabetes, prior AMI, angina, and heart failure, of patients with non-Q wave myocardial infarction, higher Killip class on admission and a longer delay in reaching the hospital, while there were lower proportions of smokers and patients admitted to the CCU. The 28-day case lethality of patients who did not undergo reperfusion therapy was higher than that of the treated patients. Table 2 shows the variables included in the logistic regression model to calculate the PS for receiving reperfusion therapies being evaluated and the area under the ROC curve, used to estimate the discriminatory power of the calculated PS, which was greater than or equal to 0.80 in every case.


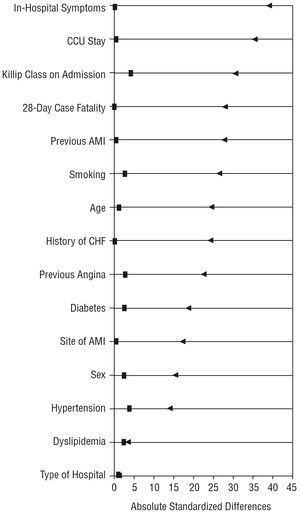
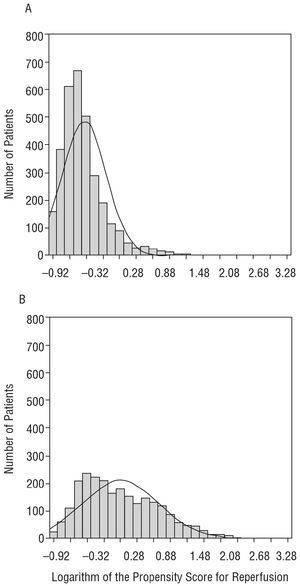
The treated and untreated patients were matched on the basis of the PS for receiving therapy, which resulted in the matching of 2926 patients. No within-pair differences were observed in the major variables of interest (Table 3). The absolute standardized differences in the demographic and clinical variables of interest observed in the analysis of all the treated and untreated patients nearly disappeared when the matched patients were analyzed (Figure 1). We were unable to match 3381 patients because the treated and untreated individuals differed widely in terms of both the distribution of cases according to the logit of the PS for treatment and the range of values of this PS (Figure 2). Table 3 also shows the differences between unmatched treated and untreated patients.

In the multivariate logistic regression analysis, after adjustment for confounding variables, thrombolysis and PCI, whether considered separately or together, were significantly associated with a lower 28-day lethality rate (Table 4A). When the PS for receiving these reperfusion therapies was included in the models, only PCI was found to have a statistically significant association with a lower case lethality rate (Table 4B). When the matched pairs of treated and untreated patients with the same PS for receiving therapy were analyzed, no statistically significant association was observed between the reperfusion therapies and the case lethality rate (Table 4C).

The PS for undergoing thrombolysis, PCI or either of the 2 reperfusion therapies could not be calculated in 685 cases in which the data for one or more of the variables included in the model was missing. These cases were associated with a higher risk than those in which the PS for receiving therapy could be calculated (older age, greater comorbidity, more severe infarction) and with a higher lethality rate (Table 5). This group also had a lower proportion of patients who had received reperfusion therapy, although the differences were not statistically significant (Table 5).

Table 6 shows the results of the analysis in which the missing data that impeded the calculation of the PS for receiving therapy were completed with the corresponding medians, as well as the results of the multiple imputation analysis of values with missing data. The results of these two analytical strategies indicate that thrombolysis and PCI, whether considered separately or together, were associated with a lower 28-day case lethality rate (Table 6).

DISCUSSION
In this study, we present a practical application of a statistical method that involves the calculation of the probability of receiving therapy, the PS, in order to analyze the effectiveness of this approach in observational studies. We utilized the data from the IBERICA study, a population-based AMI registry, to analyze the effectiveness of reperfusion therapy in reducing the 28-day lethality associated with AMI.
The analysis of the association between a treatment and an event of interest in observational studies is complex since, in contrast to randomized clinical trials, the treated and untreated groups may differ widely with respect to many covariates. If these covariables are associated with the event of interest, it may prove difficult to determine whether the effect of the treatment can be attributed to the differences in these covariables.
The calculation of the PS for receiv ing a treatment is a method that enables the statistician to reduce the bias caused by the differences between treated and untreated patients.5,6 The fact that this calculated PS is conditional only on the variables included in the multivariate predictive models utilized must be taken into account. Thus, in the design of an observational study to analyze the effect of a treatment, it is important to gather information on all the variables that can be related to the use of the treatment being studied. If the discriminatory power of the models predictive of treatment is adequate, it can be assumed that the regression models that include the calculated PS for receiving treatment will be able to provide unbiased estimations of the treatment effect.
In the real-world example we describe, using the classical multivariate analysis, thrombolysis, PCI and reperfusion with either of the 2 methods were associated with lower 28-day lethality rates. When the PS for receiving these therapies was included, thrombolysis presented no association with lethality, while PCI continued to be associated with a lower rate. The disappearance of this association between thrombolysis and lethality may be related to a more precise control of the confounding variables achieved with the introduction of the calculated PS or, as we will discuss below, to a selection bias in the analysis produced by the exclusion of a group of patients for whom data required for the calculation of the PS was missing.
In theory, the same results should be obtained whether the PS for receiving therapy or all the covariates employed to calculate this PS are included in the models utilized to analyze the treatment effect.16 The advantage of using this two-stage procedure is that the first stage, in which the PS for receiving therapy is calculated, can involve a very complex model with a large number of variables and interactions, since the only objective of this model is to achieve a greater discriminatory power for the administration of therapy. In the second stage, only this PS and a group of more relevant variables are included. If we were to include all the variables and interactions in the model to analyze the association between treatment and the event of interest, the interpretation of the final model and the analysis of its validity would be much more complex.
The matching of treated and untreated patients with the same PS for receiving treatment is a widely used analytical strategy. With this approach, the treated and untreated groups are found to have highly similar characteristics with respect to all the covariables, an ideal situation for analyzing the association between treatment and the event of interest, similar to that obtained in randomized clinical trials. In any case, we should take into account the fact that patients were matched on the basis of the variables introduced into the model to calculate the PS for receiving treatment and that, depending on the treatment, there may be within-pair differences with regard to other variables that were not considered in this calculation. In our study, matching was highly effective and we obtained a subgroup of patients that differed only in the use of reperfusion therapy (Table 3 and Figure 1). Matching is limited by the fact that if the degree of overlap of the distribution of the PS for receiving treatment in treated and untreated patients is small, as occurs in our study (Figure 2), many patients cannot be matched. Moreover, these unmatched patients differ widely depending on whether or not they received therapy and differ with respect to the matched patients (Table 3). This means that the individuals included in the matched-pair analysis are a selection of patients from the overall group with given characteristics, thus limiting the generalization of the results obtained to the population, which was the ultimate objective of our analysis. In the data from our real-world example, we observe that neither thrombolysis nor reperfusion using PCI was associated with lethality in the matched-pair analysis (Table 4C). Such widely differing results are probably due to the patient selection carried out for this matched-pair analysis, and do not represent a valid estimator of the association between reperfusion and lethality.

Figure 1. Absolute standardized differences between patients treated or not treated with reperfusion when the overall group was considered (b) and when matched according to the propensity score for receiving reperfusion therapy (j). An absolute difference of between 1 and 10 was considered to be statistically insignificant (vertical dashed line). AMI indicates acute myocardial infarction; CCU, coronary heart unit; CHF, congestive heart failure.

Figure 2. Distribution of the logit of the probability of receiving reperfusion therapy for all the treated (A) and untreated (B) patients.
One of the limitations of the analysis based on the PS for receiving treatment is the exclusion of a group of patients in whom this PS could not be calculated because the data for one or more of the variables included in the model predictive of treatment were missing.17 In our example, reperfusion was associated with lower case fatality in the classical logistic regression models adjusted for confounding variables, but this association disappeared after adjustment for the PS for undergoing reperfusion (Table 4). As we mentioned above, the disappearance of this association may have occurred because, with the introduction of the PS for undergoing reperfusion, we excluded a subgroup of patients with missing data relative to this variable, thus introducing a potential selection bias into the analysis. Indeed, there was a group of patients with a greater risk, higher case fatality and a trend toward a lower utilization of reperfusion therapy that was not included in the analysis because the PS for receiving treatment could not be calculated due to missing data relative to one or more of the variables of the predictive model (Table 5). The exclusion of these patients may have introduced a bias in the results that would reduce the efficiency of the estimator of the effectiveness of reperfusion. Both the analysis that assigned the corresponding median to the variables for which the data was missing and the multiple imputation analysis (Table 6) support the existence of this bias. They also demonstrate the effectiveness of thrombolysis, PCI or reperfusion using either of the 2 methods in reducing lethality associated with AMI in our population (Table 6). These data are consistent with those observed in clinical trials.18
Characteristics, Clinical Implications and Limitations of the Study
The IBERICA study enables the description of the care provided to AMI patients on a population-wide scale, as well as its effectiveness under real-world conditions in clinical practice.
There are certain limitations due to the unavailability of a) the electrocardiographic features of the infarction at the time of hospital admission (ST-segment elevation, etc.) to aid in assessing the indication for thrombolysis, and b) the information on the delay with which the patient reached the hospital in 8% of the cases involving hospital admission. However, when the analyses were repeated after selecting cases of Q wave AMI (as an estimate of patients with ST-segment elevation) and introducing the median delay where this information was missing, the results were very similar (data not shown). Thus, we do not consider that the exclusion of this group of patients had any impact on the findings
The results of the association between reperfusion and lethality differ according to the analytical strategy employed: odds ratio (OR)=0.59 in multivariate analysis, OR=0.76 in regression analysis adjusted for the PS for undergoing reperfusion, and OR=0.66 in regression analysis adjusted for the PS for reperfusion after multiple imputation in those cases in which the data relative to the PS were missing. After adjustment for the PS for reperfusion, the estimator obtained would probably be less biased than the true association between reperfusion and lethality, and the odds ratio would probably be between 0.66 and 0.76.
CONCLUSIONS
The calculation of the PS for receiving treatment and its subsequent utilization for the statistical analysis of the association between the therapy being evaluated and the event of interest is an interesting method that complements classical multivariate analysis. The major advantage of this method is that it makes it possible to control the differences between the treated and untreated groups. It has certain limitations when the matching is incomplete and when there are insufficient data for the calculation of the PS, a circumstance that can limit the generalization and validity of the results obtained.
The data from the IBERICA study suggest that myocardial reperfusion is effective in reducing the 28-day lethality on a population-wide scale.
Investigators of the IBERICA Study
IBERICA-Basque Country: Elena Aldasoro (principal investigator); Eva Alonso; Fernando Arós; José M. Arteagoitia (principal investigator); Covadonga Audicana; Mikel Basterretxea; Eduardo Castillo (Ý); Santiago Esnaola; Miguel A. García Calabuig; Iraida Hurtado de Saracho; Miren Josebe Laresgoiti; Nerea Larrañaga; María José Lasa; Iñaki Lecuona; Nerea Muniozguren; María Cres Tobalina; Jesús M. San Vicente; Emilio Sanz.
IBERICA-Murcia: Lluís Cirera; José García; Carmen Navarro; M. José Tormo (principal investig; Consuelo Martínez; Josefa Contreras; Fuensanta Aliaga; José M. Alonso; Manuel Belda; Rafael Bañón; José Antonio Castaño; Antonio Castilla; Juan Manuel Chiner; José M. Clemente; Amparo Egea; Francisco Felices; Manuel Fuentes; José Galcerá; Arcadio García; Francisco García; Pedro García; Gurmesindo González; Faustino Herrero; Pedro Jara; José Antonio Melgarejo; José Muñoz; Silvestre Nicolás; Juan Ortega; Miguel de Paco; Emilio Pérez; Pascual Rodríguez; Francisco Javier Rodríguez; Julio Ródenas; Francisco Ruiz-Martínez; José Antonio Ruiz; Fernando de San Eustaquio; Josefa Segura; José Antonio Serrano; Gines Torres; Luis Carlos Torres; Juan Vidal; Manuel Villegas.
IBERICA-Valencia: Amparo Albiñana; Carlos Antón; Joaquín Arguedas; Santiago Borrás; Susana Bosch; Adolfo Cabadés (principal investigator); José P. Calabuig; Enrique Castellanos; Javier Cebrián; Francisco J. Domingo; Ildefonso Echánove; Enrique Ferrer; Mercedes Francés; Eva Gómez; Julián González; José Gregori; Javier Haba; Antonio López; Vicente López; Inmaculada Melchor; Rafael Montero; Julio Montes; Ramón Navarro; Manuel Palanca; Miguel Palencia; Miguel Pérez; Paula Ramírez; Juan Antonio Rodríguez; Manuel Roig; Javier Ruiz; Antonio Salvador; José Sotillo; Francisco Valls; Hermelinda Vanaclocha (principal investigator); José Antonio Velasco; Oscar Zurriaga.
IBERICA-Castile-La Mancha: Coordinating center: Antonio Segura (principal investigator); Gema Vega (principal investigator). Collaborating investigators: Enrique Almar; Isabel Alonso; Miguel Artigao; Esther Bermejo; María de la Calle; Carmen García Colmenero; José García; José María García; Francisco García; Pedro Antonio Jiménez; Consolación Lozano; Javier Lucas; Antonio Mateos; Amalia Navarro; Ángel Puras; Gema Rius.
IBERICA-Majorca: José Ingacio Ayestarán; Jaime Bergadá; Armando Bethencourt; Silvia Carretero; Magdalena Esteva; Miguel Fiol (principal investigator); Catalina Forteza;
José Francisco Forteza; Pedro Ibáñez; Josu López; Antonio Nicolau; Jon Pérez; María Riera; Antonio Rodríguez; Ana Rotger; Catalina Rubert; Joan Soler; Enrique Sospedra; Francisca Vara; Bernardo Vidal.
IBERICA-Navarre: Eduardo Alegría; Raquel Ancín; Enrique los Arcos; José Ramón Carmona; Vega García (principal investigator); Conchi Moreno (principal investigator); Teresa Rubio; Rafael Tejeira; Eugenio Torrano; Javier Turumbay.
IBERICA-Girona: Antoni Agustí; Xavier Albert; Mariona Barcons; Francina Bassó; Josep Bisbe; Mariona Cardona; Núria Constans; Pere Cortés; M. Isabel Covas; Roberto Elosua; Miguel Gil; Josep Carles Guerra; Rafael Masià; Jaume Marrugat (principal investigator); Silvia Martín; Carles Martínez; Àngels Masabeu; M. Rita Massa; Francisco Monzón; Araceli Pena; Gloria Pérez; Carles Ponsatí; Isabel Ramió; Pere Roset; Izabella Rohlfs; Júlia Roura; Montserrat Sagué; Joan Sala (principal investigator); Mariano Sentí; Joan Vila.
IBERICA-La Coruña: Antonio Amaro; Eugenia Ameneiros; Sara Cerdeira; Teresa Eguileta (Ý); Jorge Hervada; Alejandro Mesías; Javier Muñiz (principal investigator); Pedro Rigueiro; Enrique Sáez; Jorge Salgado; Nicolás Vázquez; Luciano Vidán Martínez.
IBERICA-Coordinating and Data Center: Jaume Marrugat; Roberto Elosua.
Financed in part by a research grant from AstraZeneca, grants nos. FIS96/0026-01 to 05, FIS97/1270 and FIS98/1535 from the Fondo de Investigación Sanitaria (FIS), no. C03/01 from the Red del FIS de Investigación Cardiovascular de Centros (RECAVA), no. C03/09 from the Red de Centros de Epidemiología y Salud Pública (RCESP), awarded by the Instituto de Salud Carlos III and by the Administraciones Sanitarias de las Comunidades Autónomas de Baleares, Castilla-La Mancha, Cataluña (CIRIT/2001-SGR-00408), Murcia, Navarra, País Vasco, and Valencia.
*The investigators involved in the IBERICA study are listed at the end of the article.
Correspondence: Dr. R. Elosua.
Unitat de Lípids i Epidemiologia Cardiovascular. IMIM.
Dr. Aiguader, 80. 08003 Barcelona. España.
E-mail: relosua@imim.es