
To summarize the findings of the Spanish Implantable Cardioverter-defibrillator Registry for 2012 compiled by the Electrophysiology and Arrhythmias Section of the Spanish Society of Cardiology.
MethodsProspective data recorded voluntarily on single-page questionnaires were sent to the Spanish Society of Cardiology by each implantation team.
ResultsOverall, 4216 device implantations were reported, representing 80.8% of the estimated total number of implantations. The reported implantation rate was 91.2 per million population and the estimated total implantation rate was 113 per million. The proportion of first implantations was 69.4%. We collected data from 161 hospitals (6 fewer than in 2011). The majority of implantable cardioverter-defibrillator recipients were men (83.4%). Mean age was 61.8 (13.4) years. Most patients had severe or moderate-to-severe ventricular dysfunction and were in New York Heart Association functional class II. Ischemic heart disease was the most frequent underlying cardiac condition, followed by dilated cardiomyopathy. The number of indications for primary prevention decreased over the previous year and now account for 58.1% of first implantations. Overall, 81% of the implantable cardioverter-defibrillator were implanted by cardiac electrophysiologists.
ConclusionsThe 2012 Spanish Implantable Cardioverter-defibrillator Registry includes data on 80.8% of all implantable cardioverter-defibrillators implantations performed in Spain. This is the second consecutive year in which the number of implantations has slightly decreased compared to the previous year. This year, the percentage of implantations for primary prevention indications also decreased.
Keywords
Implantable cardioverter-defibrillators (ICD) have proven effective in the primary and secondary prevention of sudden cardiac death. The results of several published studies have enabled the main indications for ICD implantation to be established and included in the clinical guidelines for the management of patients with ventricular arrhythmias or at risk of sudden cardiac death.1–3 However, the increased use of these devices has raised questions regarding their effectiveness outside the setting of clinical trials, the correct selection of patients for implantation in the real world, access to this therapy, and its safety and cost-effectiveness.4 As little information exists in the literature on these aspects and on the application of the clinical guidelines in unselected patient populations, health registries can be very useful in clarifying these issues.
This study presents the 2012 data on ICD implantation compiled by the Spanish Implantable Cardioverter-Defibrillator Registry. As in the case of the official reports describing the activity of previous years,5–11 this report has been prepared by members of the Electrophysiology and Arrhythmias Section of the Spanish Society of Cardiology (SEC, Sociedad Española de Cardiología).
The main aim of the registry is to obtain information on the current use of ICDs in Spain, focusing on indications, the clinical characteristics of the patients, implantation data, types of devices and their programming, and procedural complications.
METHODSData for the registry were collected on a form available on the SEC web site.12 Each ICD implantation team, in collaboration with technical personnel from the ICD manufacturer, directly and voluntarily filled out the form during or after the procedure.
The information was entered in the Spanish Implantable Cardioverter-Defibrillator Registry database by a technician engaged for this purpose, assisted by a computer specialist from the SEC and a member of the Electrophysiology and Arrhythmias Section, who were also responsible for data cleaning. The authors of this special article analyzed the data and are responsible for this publication.
The census data used to calculate the rates per million population for the country as a whole and for each autonomous community and province were obtained from estimates provided by the Spanish National Institute of Statistics as of 1 January 2012.13
To estimate the representativeness of the registry, the percentage of reported implantations and replacement procedures in relation to the total number of implantations and replacement procedures performed in Spain in 2012 was calculated. The total number was based on the data for 2012 reported to the European Medical Technology Industry Association (EUCOMED) by the firms marketing ICDs in Spain.14
When more than 1 form of clinical presentation or type of arrhythmia in the same patient was recorded on the data collection form, only the most serious condition was used in the analysis.
The percentages for each variable analyzed were calculated on the basis of the total number of reported implantations that included information on the specific variable.
Statistical AnalysisNumerical results are expressed as mean (standard deviation) or median [interquartile range], depending on the distribution of the variable. Continuous quantitative variables were compared with analysis of variance or the Kruskal-Wallis test. The relationships between the number of implantations and the number of implantation centers per million population and between the total number of implantations and the number of implantations for primary prevention in each center were evaluated using linear regression models.
RESULTSThe response rates for the various fields on the data collection form ranged from 99.6% for the name of the participating hospital to 53% for QRS width.
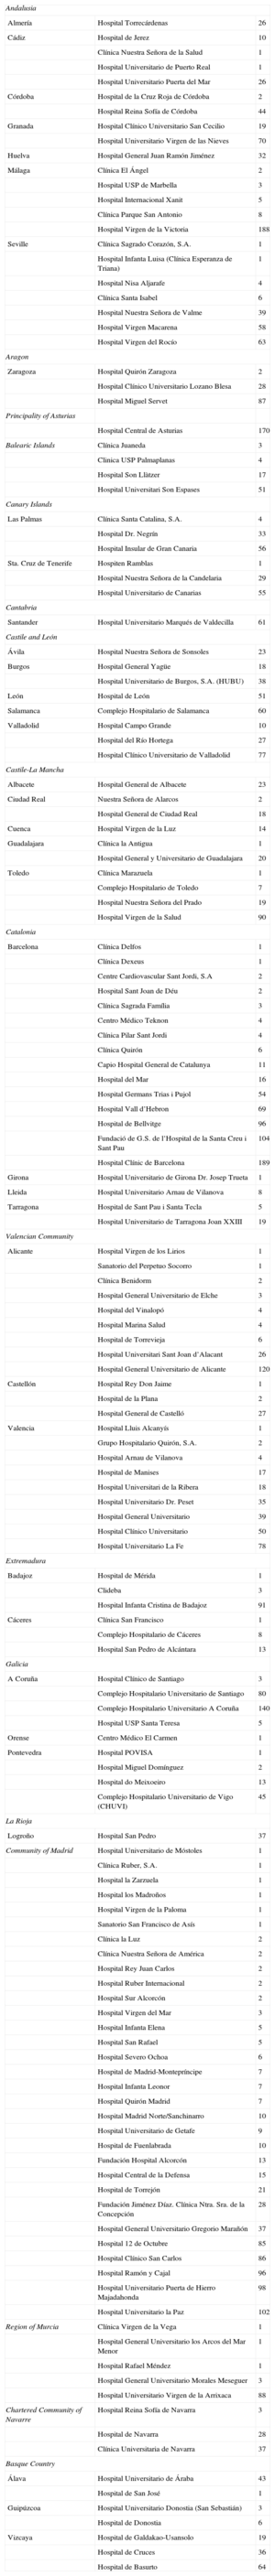
Participating CentersA total of 161 centers that perform ICD implantation in Spain participated in the registry (6 fewer than in 2011) (Table 1). This decrease is due to the grouping of several centers into consortiums, which provided pooled data. Of the respondents, 103 were public health care centers (91 more than in 2011). Figure 1 shows the total number of participating centers, the implantation rate per million population, and the total number of implantations by autonomous community according to data collected by the registry. In 2012, only 8 centers implanted more than 100 devices; 83 centers implanted fewer than 10 ICDs and 66 centers fewer than 5 devices.
Number of Implantations by Autonomous Community, Province and Center
| Andalusia | ||
| Almería | Hospital Torrecárdenas | 26 |
| Cádiz | Hospital de Jerez | 10 |
| Clínica Nuestra Señora de la Salud | 1 | |
| Hospital Universitario de Puerto Real | 1 | |
| Hospital Universitario Puerta del Mar | 26 | |
| Córdoba | Hospital de la Cruz Roja de Córdoba | 2 |
| Hospital Reina Sofía de Córdoba | 44 | |
| Granada | Hospital Clínico Universitario San Cecilio | 19 |
| Hospital Universitario Virgen de las Nieves | 70 | |
| Huelva | Hospital General Juan Ramón Jiménez | 32 |
| Málaga | Clínica El Ángel | 2 |
| Hospital USP de Marbella | 3 | |
| Hospital Internacional Xanit | 5 | |
| Clínica Parque San Antonio | 8 | |
| Hospital Virgen de la Victoria | 188 | |
| Seville | Clínica Sagrado Corazón, S.A. | 1 |
| Hospital Infanta Luisa (Clínica Esperanza de Triana) | 1 | |
| Hospital Nisa Aljarafe | 4 | |
| Clínica Santa Isabel | 6 | |
| Hospital Nuestra Señora de Valme | 39 | |
| Hospital Virgen Macarena | 58 | |
| Hospital Virgen del Rocío | 63 | |
| Aragon | ||
| Zaragoza | Hospital Quirón Zaragoza | 2 |
| Hospital Clínico Universitario Lozano Blesa | 28 | |
| Hospital Miguel Servet | 87 | |
| Principality of Asturias | ||
| Hospital Central de Asturias | 170 | |
| Balearic Islands | Clínica Juaneda | 3 |
| Clinica USP Palmaplanas | 4 | |
| Hospital Son Llàtzer | 17 | |
| Hospital Universitari Son Espases | 51 | |
| Canary Islands | ||
| Las Palmas | Clínica Santa Catalina, S.A. | 4 |
| Hospital Dr. Negrín | 33 | |
| Hospital Insular de Gran Canaria | 56 | |
| Sta. Cruz de Tenerife | Hospiten Ramblas | 1 |
| Hospital Nuestra Señora de la Candelaria | 29 | |
| Hospital Universitario de Canarias | 55 | |
| Cantabria | ||
| Santander | Hospital Universitario Marqués de Valdecilla | 61 |
| Castile and León | ||
| Ávila | Hospital Nuestra Señora de Sonsoles | 23 |
| Burgos | Hospital General Yagüe | 18 |
| Hospital Universitario de Burgos, S.A. (HUBU) | 38 | |
| León | Hospital de León | 51 |
| Salamanca | Complejo Hospitalario de Salamanca | 60 |
| Valladolid | Hospital Campo Grande | 10 |
| Hospital del Río Hortega | 27 | |
| Hospital Clínico Universitario de Valladolid | 77 | |
| Castile-La Mancha | ||
| Albacete | Hospital General de Albacete | 23 |
| Ciudad Real | Nuestra Señora de Alarcos | 2 |
| Hospital General de Ciudad Real | 18 | |
| Cuenca | Hospital Virgen de la Luz | 14 |
| Guadalajara | Clínica la Antigua | 1 |
| Hospital General y Universitario de Guadalajara | 20 | |
| Toledo | Clínica Marazuela | 1 |
| Complejo Hospitalario de Toledo | 7 | |
| Hospital Nuestra Señora del Prado | 19 | |
| Hospital Virgen de la Salud | 90 | |
| Catalonia | ||
| Barcelona | Clínica Delfos | 1 |
| Clínica Dexeus | 1 | |
| Centre Cardiovascular Sant Jordi, S.A | 2 | |
| Hospital Sant Joan de Déu | 2 | |
| Clínica Sagrada Família | 3 | |
| Centro Médico Teknon | 4 | |
| Clínica Pilar Sant Jordi | 4 | |
| Clínica Quirón | 6 | |
| Capio Hospital General de Catalunya | 11 | |
| Hospital del Mar | 16 | |
| Hospital Germans Trias i Pujol | 54 | |
| Hospital Vall d’Hebron | 69 | |
| Hospital de Bellvitge | 96 | |
| Fundació de G.S. de l’Hospital de la Santa Creu i Sant Pau | 104 | |
| Hospital Clínic de Barcelona | 189 | |
| Girona | Hospital Universitario de Girona Dr. Josep Trueta | 1 |
| Lleida | Hospital Universitario Arnau de Vilanova | 8 |
| Tarragona | Hospital de Sant Pau i Santa Tecla | 5 |
| Hospital Universitario de Tarragona Joan XXIII | 19 | |
| Valencian Community | ||
| Alicante | Hospital Virgen de los Lirios | 1 |
| Sanatorio del Perpetuo Socorro | 1 | |
| Clínica Benidorm | 2 | |
| Hospital General Universitario de Elche | 3 | |
| Hospital del Vinalopó | 4 | |
| Hospital Marina Salud | 4 | |
| Hospital de Torrevieja | 6 | |
| Hospital Universitari Sant Joan d’Alacant | 26 | |
| Hospital General Universitario de Alicante | 120 | |
| Castellón | Hospital Rey Don Jaime | 1 |
| Hospital de la Plana | 2 | |
| Hospital General de Castelló | 27 | |
| Valencia | Hospital Lluis Alcanyís | 1 |
| Grupo Hospitalario Quirón, S.A. | 2 | |
| Hospital Arnau de Vilanova | 4 | |
| Hospital de Manises | 17 | |
| Hospital Universitari de la Ribera | 18 | |
| Hospital Universitario Dr. Peset | 35 | |
| Hospital General Universitario | 39 | |
| Hospital Clínico Universitario | 50 | |
| Hospital Universitario La Fe | 78 | |
| Extremadura | ||
| Badajoz | Hospital de Mérida | 1 |
| Clideba | 3 | |
| Hospital Infanta Cristina de Badajoz | 91 | |
| Cáceres | Clínica San Francisco | 1 |
| Complejo Hospitalario de Cáceres | 8 | |
| Hospital San Pedro de Alcántara | 13 | |
| Galicia | ||
| A Coruña | Hospital Clínico de Santiago | 3 |
| Complejo Hospitalario Universitario de Santiago | 80 | |
| Complejo Hospitalario Universitario A Coruña | 140 | |
| Hospital USP Santa Teresa | 5 | |
| Orense | Centro Médico El Carmen | 1 |
| Pontevedra | Hospital POVISA | 1 |
| Hospital Miguel Domínguez | 2 | |
| Hospital do Meixoeiro | 13 | |
| Complejo Hospitalario Universitario de Vigo (CHUVI) | 45 | |
| La Rioja | ||
| Logroño | Hospital San Pedro | 37 |
| Community of Madrid | Hospital Universitario de Móstoles | 1 |
| Clínica Ruber, S.A. | 1 | |
| Hospital la Zarzuela | 1 | |
| Hospital los Madroños | 1 | |
| Hospital Virgen de la Paloma | 1 | |
| Sanatorio San Francisco de Asís | 1 | |
| Clínica la Luz | 2 | |
| Clínica Nuestra Señora de América | 2 | |
| Hospital Rey Juan Carlos | 2 | |
| Hospital Ruber Internacional | 2 | |
| Hospital Sur Alcorcón | 2 | |
| Hospital Virgen del Mar | 3 | |
| Hospital Infanta Elena | 5 | |
| Hospital San Rafael | 5 | |
| Hospital Severo Ochoa | 6 | |
| Hospital de Madrid-Montepríncipe | 7 | |
| Hospital Infanta Leonor | 7 | |
| Hospital Quirón Madrid | 7 | |
| Hospital Madrid Norte/Sanchinarro | 10 | |
| Hospital Universitario de Getafe | 9 | |
| Hospital de Fuenlabrada | 10 | |
| Fundación Hospital Alcorcón | 13 | |
| Hospital Central de la Defensa | 15 | |
| Hospital de Torrejón | 21 | |
| Fundación Jiménez Díaz. Clínica Ntra. Sra. de la Concepción | 28 | |
| Hospital General Universitario Gregorio Marañón | 37 | |
| Hospital 12 de Octubre | 85 | |
| Hospital Clínico San Carlos | 86 | |
| Hospital Ramón y Cajal | 96 | |
| Hospital Universitario Puerta de Hierro Majadahonda | 98 | |
| Hospital Universitario la Paz | 102 | |
| Region of Murcia | Clínica Virgen de la Vega | 1 |
| Hospital General Universitario los Arcos del Mar Menor | 1 | |
| Hospital Rafael Méndez | 1 | |
| Hospital General Universitario Morales Meseguer | 3 | |
| Hospital Universitario Virgen de la Arrixaca | 88 | |
| Chartered Community of Navarre | Hospital Reina Sofía de Navarra | 3 |
| Hospital de Navarra | 28 | |
| Clínica Universitaria de Navarra | 37 | |
| Basque Country | ||
| Álava | Hospital Universitario de Áraba | 43 |
| Hospital de San José | 1 | |
| Guipúzcoa | Hospital Universitario Donostia (San Sebastián) | 3 |
| Hospital de Donostia | 6 | |
| Vizcaya | Hospital de Galdakao-Usansolo | 19 |
| Hospital de Cruces | 36 | |
| Hospital de Basurto | 64 | |

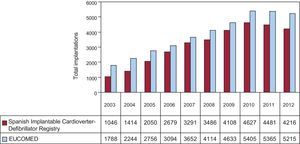
In total, 4216 first and replacement implantations were performed in 2012, a substantially lower figure than in 2011 (4481). According to the EUCOMED data,14 this represents 80.8% of the total of 5215 ICD implantations performed in 2011 in Spain. Figure 2 shows the total number of implantations reported to the registry and the number estimated by EUCOMED over the last 10 years.
. EUCOMED, European Medical Technology Industry Association.")
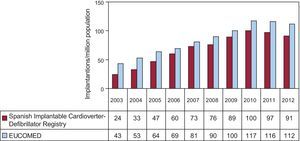
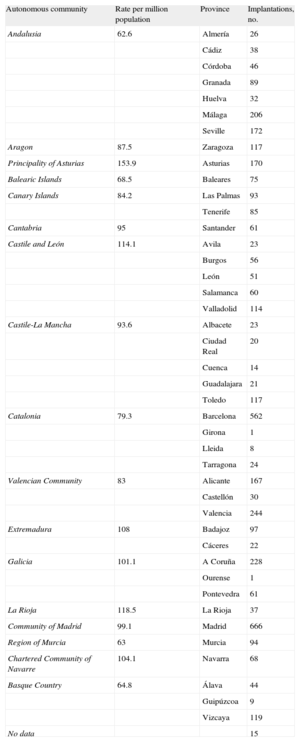
The implantation rate recorded in the registry was 91.2 per million population, whereas the rate according to the EUCOMED data was 113 per million population. Figure 3 shows the changes occurring in the implantation rate per million population over the last 10 years according to the registry and EUCOMED data. Table 1 shows the number of implantations reported to the registry by participating center. Table 2 shows the number of implantations performed in each province and the rate per million population for the corresponding autonomous community.
. EUCOMED, European Medical Technology Industry Association.")
Implantations by Autonomous Community and Province
| Autonomous community | Rate per million population | Province | Implantations, no. |
| Andalusia | 62.6 | Almería | 26 |
| Cádiz | 38 | ||
| Córdoba | 46 | ||
| Granada | 89 | ||
| Huelva | 32 | ||
| Málaga | 206 | ||
| Seville | 172 | ||
| Aragon | 87.5 | Zaragoza | 117 |
| Principality of Asturias | 153.9 | Asturias | 170 |
| Balearic Islands | 68.5 | Baleares | 75 |
| Canary Islands | 84.2 | Las Palmas | 93 |
| Tenerife | 85 | ||
| Cantabria | 95 | Santander | 61 |
| Castile and León | 114.1 | Avila | 23 |
| Burgos | 56 | ||
| León | 51 | ||
| Salamanca | 60 | ||
| Valladolid | 114 | ||
| Castile-La Mancha | 93.6 | Albacete | 23 |
| Ciudad Real | 20 | ||
| Cuenca | 14 | ||
| Guadalajara | 21 | ||
| Toledo | 117 | ||
| Catalonia | 79.3 | Barcelona | 562 |
| Girona | 1 | ||
| Lleida | 8 | ||
| Tarragona | 24 | ||
| Valencian Community | 83 | Alicante | 167 |
| Castellón | 30 | ||
| Valencia | 244 | ||
| Extremadura | 108 | Badajoz | 97 |
| Cáceres | 22 | ||
| Galicia | 101.1 | A Coruña | 228 |
| Ourense | 1 | ||
| Pontevedra | 61 | ||
| La Rioja | 118.5 | La Rioja | 37 |
| Community of Madrid | 99.1 | Madrid | 666 |
| Region of Murcia | 63 | Murcia | 94 |
| Chartered Community of Navarre | 104.1 | Navarra | 68 |
| Basque Country | 64.8 | Álava | 44 |
| Guipúzcoa | 9 | ||
| Vizcaya | 119 | ||
| No data | 15 |
The name of the participating center was reported in 99.6% of the cases. The majority of the procedures—3820 (90.8%)—were performed in public health centers.
First Implantations vs Replacement ProceduresThis information was reported in 4092 of the data forms sent to the SEC (97.1%). There were 2842 first implantations, representing 69.4% of the total (70.2% in 2011 and 73.8% in 2010). The rate of first implantations in 2012 was 64 per million population, equaling that in 2011.
Age and SexThe mean age (standard deviation) [range] of patients receiving an ICD or replacement device was 61.8 (13.4) [7-90] years. The majority of patients were men, accounting for 83.4% of all patients and 80.2% of patients receiving a first implantation.
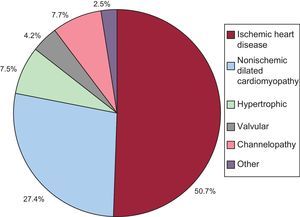
Underlying Heart Disease, Left Ventricular Ejection Fraction, Functional Class, and Baseline RhythmThe most common underlying cardiac condition in primary implantation patients was ischemic heart disease (50.7%), followed by dilated cardiomyopathy (27.4%), hypertrophic cardiomyopathy (7.5%), primary conduction abnormalities (Brugada syndrome, idiopathic ventricular fibrillation, and long QT syndrome) (7.7%), and lower percentages of valvular heart disease and arrhythmogenic dysplasia (Fig. 4).
.")
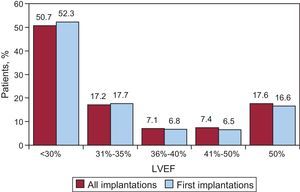
Regarding left ventricular function in patients receiving a first implantation, the left ventricular ejection fraction was <30% in 52.3%, 30%-40% in 23.6%, 41%-50% in 6.5%, and >50% in 16.6%. The distribution was similar in patients receiving a replacement ICD (Fig. 5). This information was reported in 79.8% of the data collection forms.
. LVEF, left ventricular ejection fraction.")
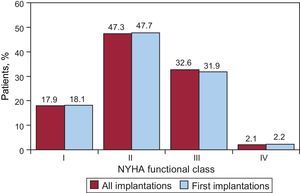
Regarding the New York Heart Association (NYHA) functional class, the majority of the patients were in NYHA II (47.3%), followed by NYHA III (32.6%), NYHA I (17.9%), and NYHA IV (2.1%). In relation to this variable, the distribution between total implantations and first implantations was also very similar (Fig. 6); this information was reported in 65.8% of the data collection forms.
. NYHA, New York Heart Association.")
The baseline cardiac rhythm, recorded in 84.9% of patients, was sinus rhythm (78.2%), followed by atrial fibrillation (16.8%) and paced rhythm (4.47%); the remaining patients had other rhythms (atrial flutter and other arrhythmias).
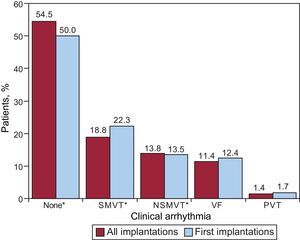
Clinical Arrhythmia Prompting Device Placement, Presentation, and Electrical Stimulation-induced ArrhythmiasInformation on this item was reported in 80.2% of the data collection forms. The largest group of first-implantation patients was comprised of those with no documented clinical arrhythmia (54.5%), followed by those with sustained monomorphic ventricular tachycardia, nonsustained ventricular tachycardia, and ventricular fibrillation (18.8%, 13.8%, and 11.4%, respectively). Of the total implantation procedures performed, 50.2% of devices were placed in patients without documented clinical arrhythmia (Fig. 7). Differences in the type of arrhythmias between patients receiving first implantations and the total group of patients were statistically significant for patients without arrhythmia (P=.0008) and those with sustained monomorphic ventricular tachycardia (P=.001), but not for patients with nonsustained ventricular tachycardia or ventricular fibrillation.
. NSMVT, nonsustained monomorphic ventricular tachycardia; PVT, polymorphic ventricular tachycardia; SMVT, sustained monomorphic ventricular tachycardia; VF, ventricular fibrillatio. *P<.001.")
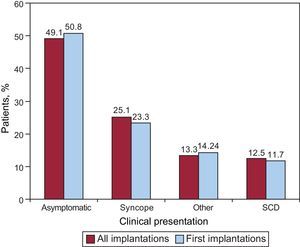
The most common clinical presentation in the overall group and the first implantation group (72.5% and 69.7% completed responses) was an absence of symptoms, followed by “other symptoms” and syncope (Fig. 8). There were no statistically significant differences between the first implantation group and the overall group in the form of presentation.
. SCD, sudden cardiac death.")
Information on electrophysiological studies was available on 2326 patients receiving a first implantation (78.6%). Electrophysiological studies were conducted in only 297 patients (14.6%). The most frequently induced arrhythmia was sustained monomorphic ventricular tachycardia (44.6%), followed by ventricular fibrillation (19.2%), and less frequently, nonsustained ventricular tachycardia (8.7%) and others (2.9%). Arrhythmia was not induced in 24.6% of the patients who underwent electrophysiological studies, which were mainly conducted in patients with ischemic heart disease and dilated cardiomyopathy.
Clinical HistorySince 2011, several new fields related to the patient's clinical history have been incorporated in the data collection form.
For patients with first implantations, 66.9% to 78.8% of these fields were completed, with the following results: hypertension, 55.7%; hypercholesterolemia, 45.6%; smoking, 38.1%; diabetes mellitus, 31.3%; a history of atrial fibrillation, 26.3%; kidney failure, 15.8%; history of sudden cardiac death, 8.5%; and stroke, 7.3%. The QRS interval was documented in 53% of the records (mean value 126.2 [59] ms). The QRS interval was >140ms in 69.5% of the patients. Of these, 85.3% of the patients in the first implantation group (78.6% of the total group) received a combined resynchronization/ICD (ICD-CRT [cardiac resynchronization therapy]) device.
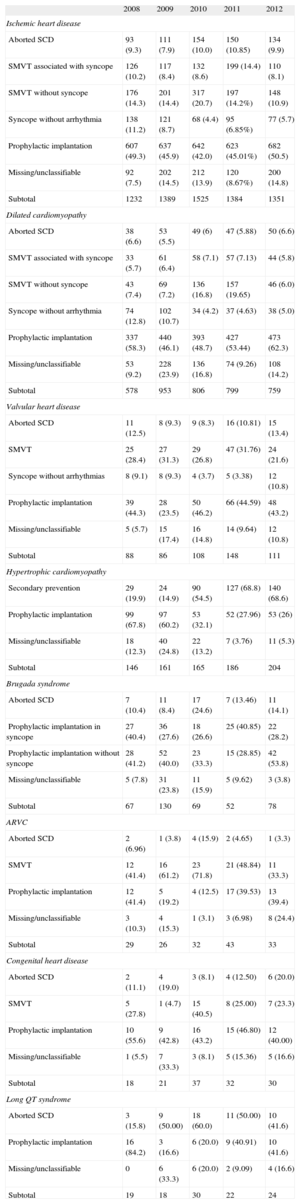
IndicationsTable 3 shows changes in first implantations by type of heart disease and presentation from 2009 to 2012. This information was reported in 91% of the data collection forms. Ischemic heart disease was the condition most often associated with ICD implantation, and the indication was mainly for primary prevention (59.5%), a percentage that has not increased in recent years (59.6% in 2011 and 58.5% in 2010). The trend in primary prevention for dilated cardiomyopathy was also similar (74.1% vs 74.7% in 2011 and 72.8% in 2010). Regarding the less common types of heart disease, the predominant indication was primary prevention in valvular heart disease, hypertrophic cardiomyopathy, and Brugada syndrome and other channelopathies. In congenital heart disease, the main indication was secondary prevention.
Number of First Implantations According to the Type of Heart Disease, Type of Clinical Arrhythmia, and Form of Presentation (2008-2012)
| 2008 | 2009 | 2010 | 2011 | 2012 | |
| Ischemic heart disease | |||||
| Aborted SCD | 93 (9.3) | 111 (7.9) | 154 (10.0) | 150 (10.85) | 134 (9.9) |
| SMVT associated with syncope | 126 (10.2) | 117 (8.4) | 132 (8.6) | 199 (14.4) | 110 (8.1) |
| SMVT without syncope | 176 (14.3) | 201 (14.4) | 317 (20.7) | 197 (14.2%) | 148 (10.9) |
| Syncope without arrhythmia | 138 (11.2) | 121 (8.7) | 68 (4.4) | 95 (6.85%) | 77 (5.7) |
| Prophylactic implantation | 607 (49.3) | 637 (45.9) | 642 (42.0) | 623 (45.01%) | 682 (50.5) |
| Missing/unclassifiable | 92 (7.5) | 202 (14.5) | 212 (13.9) | 120 (8.67%) | 200 (14.8) |
| Subtotal | 1232 | 1389 | 1525 | 1384 | 1351 |
| Dilated cardiomyopathy | |||||
| Aborted SCD | 38 (6.6) | 53 (5.5) | 49 (6) | 47 (5.88) | 50 (6.6) |
| SMVT associated with syncope | 33 (5.7) | 61 (6.4) | 58 (7.1) | 57 (7.13) | 44 (5.8) |
| SMVT without syncope | 43 (7.4) | 69 (7.2) | 136 (16.8) | 157 (19.65) | 46 (6.0) |
| Syncope without arrhythmia | 74 (12.8) | 102 (10.7) | 34 (4.2) | 37 (4.63) | 38 (5.0) |
| Prophylactic implantation | 337 (58.3) | 440 (46.1) | 393 (48.7) | 427 (53.44) | 473 (62.3) |
| Missing/unclassifiable | 53 (9.2) | 228 (23.9) | 136 (16.8) | 74 (9.26) | 108 (14.2) |
| Subtotal | 578 | 953 | 806 | 799 | 759 |
| Valvular heart disease | |||||
| Aborted SCD | 11 (12.5) | 8 (9.3) | 9 (8.3) | 16 (10.81) | 15 (13.4) |
| SMVT | 25 (28.4) | 27 (31.3) | 29 (26.8) | 47 (31.76) | 24 (21.6) |
| Syncope without arrhythmias | 8 (9.1) | 8 (9.3) | 4 (3.7) | 5 (3.38) | 12 (10.8) |
| Prophylactic implantation | 39 (44.3) | 28 (23.5) | 50 (46.2) | 66 (44.59) | 48 (43.2) |
| Missing/unclassifiable | 5 (5.7) | 15 (17.4) | 16 (14.8) | 14 (9.64) | 12 (10.8) |
| Subtotal | 88 | 86 | 108 | 148 | 111 |
| Hypertrophic cardiomyopathy | |||||
| Secondary prevention | 29 (19.9) | 24 (14.9) | 90 (54.5) | 127 (68.8) | 140 (68.6) |
| Prophylactic implantation | 99 (67.8) | 97 (60.2) | 53 (32.1) | 52 (27.96) | 53 (26) |
| Missing/unclassifiable | 18 (12.3) | 40 (24.8) | 22 (13.2) | 7 (3.76) | 11 (5.3) |
| Subtotal | 146 | 161 | 165 | 186 | 204 |
| Brugada syndrome | |||||
| Aborted SCD | 7 (10.4) | 11 (8.4) | 17 (24.6) | 7 (13.46) | 11 (14.1) |
| Prophylactic implantation in syncope | 27 (40.4) | 36 (27.6) | 18 (26.6) | 25 (40.85) | 22 (28.2) |
| Prophylactic implantation without syncope | 28 (41.2) | 52 (40.0) | 23 (33.3) | 15 (28.85) | 42 (53.8) |
| Missing/unclassifiable | 5 (7.8) | 31 (23.8) | 11 (15.9) | 5 (9.62) | 3 (3.8) |
| Subtotal | 67 | 130 | 69 | 52 | 78 |
| ARVC | |||||
| Aborted SCD | 2 (6.96) | 1 (3.8) | 4 (15.9) | 2 (4.65) | 1 (3.3) |
| SMVT | 12 (41.4) | 16 (61.2) | 23 (71.8) | 21 (48.84) | 11 (33.3) |
| Prophylactic implantation | 12 (41.4) | 5 (19.2) | 4 (12.5) | 17 (39.53) | 13 (39.4) |
| Missing/unclassifiable | 3 (10.3) | 4 (15.3) | 1 (3.1) | 3 (6.98) | 8 (24.4) |
| Subtotal | 29 | 26 | 32 | 43 | 33 |
| Congenital heart disease | |||||
| Aborted SCD | 2 (11.1) | 4 (19.0) | 3 (8.1) | 4 (12.50) | 6 (20.0) |
| SMVT | 5 (27.8) | 1 (4.7) | 15 (40.5) | 8 (25.00) | 7 (23.3) |
| Prophylactic implantation | 10 (55.6) | 9 (42.8) | 16 (43.2) | 15 (46.80) | 12 (40.00) |
| Missing/unclassifiable | 1 (5.5) | 7 (33.3) | 3 (8.1) | 5 (15.36) | 5 (16.6) |
| Subtotal | 18 | 21 | 37 | 32 | 30 |
| Long QT syndrome | |||||
| Aborted SCD | 3 (15.8) | 9 (50.00) | 18 (60.0) | 11 (50.00) | 10 (41.6) |
| Prophylactic implantation | 16 (84.2) | 3 (16.6) | 6 (20.0) | 9 (40.91) | 10 (41.6) |
| Missing/unclassifiable | 0 | 6 (33.3) | 6 (20.0) | 2 (9.09) | 4 (16.6) |
| Subtotal | 19 | 18 | 30 | 22 | 24 |
ARVC, arrhythmogenic right ventricular cardiomyopathy; SCD, sudden cardiac death; SMVT, sustained monomorphic ventricular tachycardia.
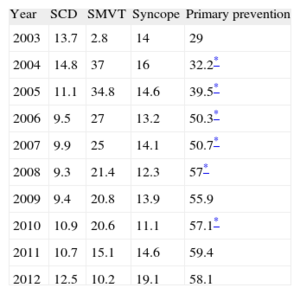
Information on indications for implantation was reported in 90.1% of the data collection forms. The majority of implantations were indicated for primary prevention (58.1%), although this was the first year that the number of implantations decreased for this indication. This variation has been increasing and was statistically significant (P<.01) until 2008 and again between 2009 and 2010 (Table 4).
Changes in the Main Indications for Implantable Cardioverter-defibrillator Placement (First Implantations, 2003-2012)
| Year | SCD | SMVT | Syncope | Primary prevention |
| 2003 | 13.7 | 2.8 | 14 | 29 |
| 2004 | 14.8 | 37 | 16 | 32.2* |
| 2005 | 11.1 | 34.8 | 14.6 | 39.5* |
| 2006 | 9.5 | 27 | 13.2 | 50.3* |
| 2007 | 9.9 | 25 | 14.1 | 50.7* |
| 2008 | 9.3 | 21.4 | 12.3 | 57* |
| 2009 | 9.4 | 20.8 | 13.9 | 55.9 |
| 2010 | 10.9 | 20.6 | 11.1 | 57.1* |
| 2011 | 10.7 | 15.1 | 14.6 | 59.4 |
| 2012 | 12.5 | 10.2 | 19.1 | 58.1 |
SCD, sudden cardiac death; SMVT, sustained monomorphic ventricular tachycardia.
Information on these items was reported in 90.5% of the data collection forms. The main setting in which implantations were performed was the electrophysiology laboratory in 81.4% of cases (76.4% in 2011, 70.3% in 2010, and 67% in 2009), followed by the operating room (17.31%).
The procedure was performed by electrophysiologists in 81% of cases (78.4% in 2011 and 76.1% in 2010), surgeons in 14% (15.5% in 2011), both specialists in 1.9%, and other specialists and intensivists in 1.6% and 1.4%, respectively.
Generator Implantation SiteInformation on the generator implantation site in first implantations was reported in 3735 (83%) of the data collection forms. The generator was placed subcutaneously in a pectoral position in 95% of cases and in a subpectoral position in the remaining 5%. Regarding the total number of devices implanted, the values were 93.4% and 6.6%, respectively.
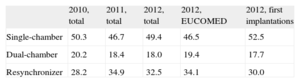
Type of DeviceThis information was reported in 94% of the data collection forms and is summarized in Table 5. Single-chamber ICDs were implanted in 49.4% (46.7% in 2011), dual-chamber ICDs in 18% (18.4% in 2011), and ICD-CRTs in 32.5% (34.9% in 2011).
Type of Implantable Cardioverter-defibrillators Placed
| 2010, total | 2011, total | 2012, total | 2012, EUCOMED | 2012, first implantations | |
| Single-chamber | 50.3 | 46.7 | 49.4 | 46.5 | 52.5 |
| Dual-chamber | 20.2 | 18.4 | 18.0 | 19.4 | 17.7 |
| Resynchronizer | 28.2 | 34.9 | 32.5 | 34.1 | 30.0 |
EUCOMED, European Medical Technology Association.
Figures are expressed as percentages.
In patients with ischemic heart disease, 72.3% of the devices were single-chamber or dual-chamber and 27.7% were ICD-CRTs. In patients with dilated cardiomyopathy, 56.5% (59.7% in 2011) of the devices were ICD-CRTs.
Reasons for Device Replacement, Need for Replacement, and Use of Additional LeadsInformation on the 1133 replacement procedures was reported in 977 (86.2%) of the data collection forms. The most common reason was battery depletion (85.3%), followed by complications (7.8%), and change of indication (6.8%). Of the 54 cases of early replacement procedures reported, 14.8% were performed within 6 months of the implantation procedure.
In 77% of the replacement reports, information was provided on the status of the leads: 8.9% (78 records) were malfunctioning and lead extraction was performed in 23% (18) of the cases in which this information was recorded.
Implantable Cardioverter-defibrillator ProgrammingInformation on this item was reported in 56.2% of the data collection forms. The antibradycardia pacing most commonly used was VVI mode (57.4%), followed by DDD mode (30.1%), VVIR mode (5.5%), DDDR (4.7%), and other pacing modes, mainly preventive algorithms for ventricular pacing (2.3%).
Information on the induction of ventricular fibrillation was reported in 3591 of the data collection forms. In total, 250 patients (6.7%) underwent this procedure; the mean threshold was 20.5 (7.1) and a mean of 1.1 shocks were delivered.
ComplicationsInformation on this item was reported in 87.1% of the data collection forms. In total, 28 complications were reported: 8 dissections of the coronary sinus, 3 deaths, 2 cases of pneumothorax, 1 case of tamponade, and 13 cases of various or unspecified complications. The death rate was 0.08%, similar to that reported for the previous year (0.1%).
DISCUSSIONThe results of the 2012 ICD registry continue to show an acceptable level of representativeness. The information provided is reliable regarding the number of implantations, the type of device, indications, and the clinical characteristics of patients.
Comparison With Registries of Previous YearsIn 2005, the first Spanish Implantable Cardioverter-Defibrillator Registry was published, in which the results for the period 2002-2004 were presented.4 There was an increase in the number of ICDs implanted each year until 20115–11 and 2012 was the second consecutive year in which a decrease was observed in the number of devices implanted in Spain. These data are consistent with the results reported by EUCOMED. In Europe, there was a slight increase in the number of ICD implantations and ICD-CRTs.14
There was a decrease in the indication for ICD implantation for primary prevention compared to 201111 (58.1% vs 59.4%), which broke the trend established since 2003. There was also a slight decrease in ICD-CRT implantations (32.5% vs 34.9%); however, the number of single-chamber ICD implantations increased (49.4% vs 46.7% in 2011). There was practically no change in the use of dual-chamber ICDs (18% vs 18.4%). In 2011, there was a decrease in the use of single- and dual-chamber ICDs compared to ICD-CRTs, whereas in 2012 this trend reversed; there is no obvious reason for this change, but it is probably explained by the decrease in indications for primary prevention in that year.
The most common indication for ICD implantation continued to be ischemic heart disease (50.7%), followed by dilated cardiomyopathy (27.4%). As in previous years,11 more than half of the implantations in patients with dilated cardiomyopathy were ICD-CRTs (56.5%), whereas the percentage was lower in patients with ischemic heart disease (27.7%).
The trend of gradual increase in the number of ICD implantations changed in 2011 and 2012, becoming stable or decreasing.14 No study has reported a change in indications for ICD implantation in recent years. The Multicenter Automatic Defibrillator Implantation Trial II,15 published in 2002, and the Comparison of Medical Therapy, Pacing and Defibrillation in Heart Failure16 and Sudden Cardiac Death in Heart Failure Trial,17 published in 2005 and 2006, respectively, established the current indications for primary prevention and CRT, leading to a gradual increase in the number of implantations over the next 10 years. Although the indications for ICD and CRT implantation are well supported in the clinical practice guidelines,18–21 the implantation rate per million population does not match the rate that would be expected according to the clinical evidence, either for Spain or for other European countries.22
As in previous registries, differences remain between the number of implantations in the present registry and the EUCOMED data, at proportions similar to those of other years.
The number of participating centers has decreased since 2011, mainly due to the grouping of several hospitals into consortiums that provided pooled data. Only 8 hospitals (11 in 2011) implanted more than 100 devices and 83 centers implanted fewer than 10 devices. An association has been shown between procedure volume and the number of complications,23 which decrease with increasing procedure volume per center.
Compared to previous registries, there were no changes in the epidemiologic characteristics of the patients. Patients with severe left ventricular dysfunction and those in NYHA functional class II and III continue to predominate. There was a slight gradual increase in the number of ICD implantations performed in the electrophysiology laboratory (81.4% vs 76.4% in 2011) and in those performed by electrophysiologists (81% vs 78.4% in 2011).
Differences Between Autonomous CommunitiesThe differences in the ICD implantation rate between the various autonomous communities remained steady. The implantation rate in Spain was 91.2 per million population and 113 per million population according to EUCOMED, both of which were less than in 2011 (97 and 116.2, respectively). Several autonomous communities were above this average: Principality of Asturias (153), Castile and León (114), La Rioja (118), Extremadura (108), the Chartered Community of Navarre (104), Galicia (101), the Community of Madrid (99), Cantabria (95), and Castile-La Mancha (93). Autonomous communities below this average included Andalusia (62), the Region of Murcia (63), the Basque Country (64), the Balearic Islands (68), Catalonia (79), the Valencian Community (83), the Canary Islands (84), and Aragon (87). The autonomous community with the highest rate of ICD implantations reported more than twice that of the autonomous community with the lowest rate. There was an increase in ICD implantations in Extremadura, the Chartered Community of Navarre, the Canary Islands, and Galicia. There was a striking decrease in ICD implantations in Cantabria (143 vs 95) and the Community of Madrid (121 vs 99.1), whereas the decrease was less marked in the other autonomous communities.
There was no association between the gross domestic product of each autonomous community and the number of implantations. Interestingly, most of the autonomous communities with highest per capita income were those in which the number of ICD implantations performed was below the average. Neither was there an association between the number of ICD implantations and the incidence of ischemic heart disease and heart failure among the various autonomous communities. These differences may be explained by the health organization in each autonomous community, the number of arrhythmia units, or distribution of the referrals.
Comparison With Other CountriesThe implantation rate including ICDs and ICD-CRTs in the countries participating in EUCOMED was 273 per million population (269 in 2011). Germany, with 496 implantations, remained the country with the highest rate. Greece, with 111 implantations per million population, had the lowest rate. The following countries were above the average: the Netherlands (364), Italy (363), Norway (285), Denmark (280), and the Czech Republic (277). Countries below the average included Austria (259), Poland (252), Belgium (216), Switzerland (198), Sweden (191), France (191), Ireland (175), Finland (158), the United Kingdom (156), Portugal (125), Spain (113), and Greece (111).
The ICD implantation rate was 167 per million population in 2012 (162 in 2011). Germany (324) had the highest rate of ICD implantations, whereas Spain (74) had the lowest rate.
The ICD-CRT implantation rate was 106 per million population (107 in 2011). Germany (192 implantations) had the highest rate, whereas Greece (34) had the lowest rate. In Spain, the ICD-CRT implantation rate was 39 implantations per million population.
There was little change in the data for Europe between 2012 and 2011. There was a slowdown in the growth of the number of ICD implantations in 2012 compared to growth in previous years. The difference between Spain and the European average was maintained.
Differences between regions of European countries were similar to those reported in Spain,24,25 a situation for which there is no clear explanation. Although the cause has been attributed to the number of arrhythmia units available, this is an unlikely explanation, at least in Spain, where the autonomous communities with the highest number of arrhythmia units available have the lowest ICD implantation rates. Neither does per capita income appear to be related, since countries such as Ireland, the Czech Republic, and Poland have ICD implantation rates well above those in Spain. The ICD implantation rates and regional variations in Spain may be related to the incidence of cardiovascular diseases, access to and organization of the health care system, and the degree to which the clinical practice guidelines are accepted and implemented.
LimitationsAccording to EUCOMED data, 80.8% of implantations performed in Spain were reported to the registry. This value is lower than the 83.6% reported in 2011 and the 90% reported in 2007, the year in which the percentage began its decrease to the current value. However, this value is still representative of the current situation in Spain and the number of centers participating in the registry has steadily increased.
In some hospitals, the true number of implantations performed differed from the number reported to the registry because the registry only included information provided in the data collection forms. Some of the forms may not have been received, since there are several ways to send and receive information, or the data may have been entered incorrectly. Next year there will likely be an online data reporting option, which could both improve the outcome and reduce the difference between the data collected in this registry and the data provided by EUCOMED.
There were great variations in the response rates for the various fields on the data collection form, ranging from 99.6% for the name of the participating hospital to 53% for QRS width. Finally, the percentage of complications reported in the registry does not accurately reflect the true situation because the data form was completed during or immediately after the procedure and therefore the majority of the subacute complications would not be recorded.
Future Prospects of the Spanish Implantable Cardioverter-defibrillator RegistryThe current registry is the 9th official report of this activity in Spain. The fact that the registry has been maintained over so many years should be a cause of genuine satisfaction for all participating members of the Electrophysiology and Arrhythmias Section of the SEC. The steady modernization of the registry will make it possible to obtain more and better information with less effort by the personnel involved in its maintenance. Future improvements in online data collection may make it possible to achieve more ambitious clinical goals and could include parameters such as mortality, shocks delivered, complications, etc., thus improving both, the clinical data and the overall value of the registry.
CONCLUSIONSThe 2012 Spanish Implantable Cardioverter-Defibrillator Registry provides information on 80.8% of the procedures performed in Spain and continues to be representative of the use and current indications of this therapy. This is the second consecutive year that the number of implantations has decreased, with a rate of 91.2 per million population. The indications for primary prevention and ICD-CRT therapy have also decreased. As in previous years, the number of implantations in Spain was still far lower than the European Union average, and substantial differences remain between the various autonomous communities.
CONFLICTS OF INTERESTJ. Alzueta has participated in research projects with Medtronic, St. Jude Medical, Boston Scientific, Biotronik, and Sorin Group, and in round tables sponsored by Medtronic, St. Jude Medical, and Biotronik.
J.M. Fernández received a grant from the SEC for the maintenance of the Spanish Implantable Cardioverter-Defibrillator Registry database.
We would like to express our appreciation to all the health care professionals involved in ICD implantation in Spain, who have voluntarily and generously contributed to the success of the registry.
We also extend our thanks to the personnel from the ICD manufacturers (Medtronic, Boston Scientific, St, Jude Medical, Biotronik, and Sorin Group) for their help in collecting and sending data to the SEC on the majority of implantations.
We also thank the SEC for their excellent work in data collection and entry, and in particular Justes Gonzalo and José María Naranjo.