Coronary restenosis after bioresorbable vascular scaffold (BVS) implantation is infrequent and little information is available on the main characteristics of these lesions. The aim of this study was to assess restenotic lesions by using optical coherence tomography (OCT).
MethodsWe studied 330 patients with coronary artery disease who received 398 BVS to treat 380 lesions. These patients were clinically and angiographically evaluated at follow-up and OCT was carried out on detection of restenosis.
ResultsAfter a follow-up of 19 ± 10 months, 18 restenotic lesions were detected in 17 patients (5.4%). Depending on the time of presentation, most cases of restenosis were late or very late (9 ± 4 months). The most frequent angiographic pattern was focal restenosis in 12 (67%) patients, which was mainly located at the proximal border in 9 (75%) whether involving the scaffold or not. The homogeneous pattern was infrequent, occurring in 3 (25%) lesions and was only visualized in 3 out of 6 cases of restenosis located at the margin. When the focal restenosis was located in the platform, OCT showed a heterogeneous or layered pattern. Finally, diffuse restenosis was observed in 6 patients (33%). In diffuse restenosis, OCT revealed a lipid-laden or layered tissue structure and the presence of microvessels or microcalcification, potentially suggesting a neoatherosclerotic process.
ConclusionsAfter a mean follow-up of 19 months, the restenosis rate was 5.4%. Most restenotic lesions were focal, located at the proximal border. Diffuse restenosis mostly occurred late or very late and most showed signs suggestive of neoatherosclerosis.
Keywords
Bioresorbable vascular scaffold (BVS) implantation is effective for treating coronary artery disease.1–5 BVS can also provide further potential benefits when it is absorbed. However, restenosis remains a limitation. Little information is available on the characteristics of restenosis after implantation of this bioresorbable platform.5–7 The process of restenosis has been understood as an exaggerated response during the healing process after coronary wall damage during revascularization.8 Adverse responses to balloon angioplasty, excisional atherectomy, bare-metal stents (BMS) and drug-eluting stents (DES) have been analyzed.9–11 The restenosis rate has decreased dramatically due to improvements in stent technology. Specific patterns of restenosis after different revascularization techniques have been described.12 These patterns may differ in terms of their clinical presentation, timing, anatomic location, angiographic length, tissue appearance, and the intraluminal shape. Neoatherosclerosis has recently been described as a different mechanism of late restenosis.13,14
The aim of this study was to analyze coronary restenosis in a cohort of patients who were treated with BVS. Clinical presentation, angiographic appearance and intracoronary neointimal tissue characteristics assessed by optical coherence tomography (OCT) are described.
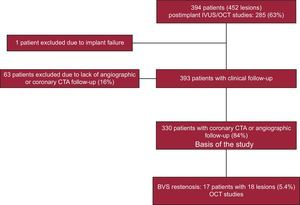
METHODSPatientsFrom January 2012 to January 2015, we treated 394 patients with coronary artery disease with BVS. In these patients, 452 lesions were scaffolded. The flowchart of the study is shown in the Figure 1. These patients were not consecutive. Exclusion criteria included a reference vessel diameter > 4mm, heavy calcification, excessive tortuosity, dual antiplatelet therapy contraindication for at least 1 year, age older than 75 years, renal failure (creatinine clearance ≤ 30mL/min), and cardiogenic shock. All patients signed a written informed consent form for the procedure. After successful revascularization, the patients were discharged and followed up closely by medical visits or telephone calls. A coronary computed tomography angiography (CTA) was scheduled at least 6 months after the procedure to evaluate the scaffolded segment. A new cardiac catheterization was performed in 17 patients who had clinical recurrence, signs of ischemia, or suspected restenosis based on the coronary CTA studies, these patients constituting the study group. Depending on the time of presentation, restenosis–when present–was considered to be early (≤ 6 months), late (6-12 months), or very late (> 12 months).6
Angiographic Studies
Coronary angiograms were performed in different projections to properly delineate the lesions. These lesions were defined following the AHA/ACC classification.15 Predilatation was done according to the operator's discretion.16 The diameter of the BVS was selected according to the proximal reference diameter. Postdilation was performed if the balloon of the BVS was not fully expanded or the intracoronary images indicated that underexpansion was advisable (minimal lumen diameter of BVS lower than 70% compared with the reference area within 5mm proximal and distal to the scaffold) or if there was evidence of malapposition (> 200 microns of nonapposition and ≥ 1mm in length). The balloon selected was a noncompliant balloon that was not more than 0.5mm greater than the diameter of the scaffold. Quantitative coronary angiographic analysis was performed using an offline computerized quantitative coronary angiographic system (CASS system; Pie Medical Imaging, Maastricht, The Netherlands), which was performed by 2 expert operators. At follow-up, we performed a new cardiac catheterization in all patients who developed restenosis. The same methodology and x-ray projections as those in the previous angiographic study were performed to evaluate the angiographic characteristics of restenosis. Binary restenosis was defined as a quantitative coronary angiography diameter stenosis ≥ 50% within the scaffolded segment and 5mm proximal and distal to the implant. These lesions were characterized in accordance with the Mehran classification.17 By means of this cardiac catheterization, the OCT study allowed analysis of the characteristics of the restenotic lesions. Finally, percutaneous treatment of restenosis was performed in all patients.
Follow-up coronary CTA studies were performed using a 64-slice scanner (LightSpeed VCT; GE Healthcare, Little Chalfont, Buckinghamshire, United Kingdom). The scan parameters included slice acquisition 64 × 0.625mm, gantry rotation time 350ms, tube voltage (100-120kV) and tube current (650-800mA). Coronary CTA data were analyzed on a dedicated workstation (Advantage Windows 4.5). The BVS was assessed visually. For the visualization of the scaffolded segment, curved multiplanar reformations and maximum intensity projection were performed, with the best angle or perspective selected for better vessel analysis. Cross-sectional views of the vessel were also reconstructed at 1mm longitudinal steps, including 5mm proximal and distal to the device, using the platinum indicators as landmarks.
Optical Coherence Tomography Procedure and AnalysisAn OCT analysis was performed in all restenotic lesions. In 10 of them (55%), an OCT analysis was available after BVS. The OCT was performed using a commercially available Fourier-domain OCT system (St Jude Medical, St Paul, Minnesota, United States).The OCT images were generated at 100 frames/s as a catheter was pulled back at 20mm/s. A nonocclusive contrast medium was continuously flushed through a guiding catheter (12mL) at a rate of 4mL/s and 600 psi for 3seconds. Continuous images were acquired and stored digitally for subsequent analysis. Lumen and scaffold border detection was performed using the methodology described by Serruys et al.3 To analyze the restenosis, we selected at least 3 consecutive frames in scaffolded segments with ≥ 50% of the restenotic tissue area (scaffold area, lumen area, cross-sectional area). Depending on the characteristics of the neointimal growth, we classified the restenosis in 4 patterns, as previously described13,18; a) homogeneous: a uniform signal-rich band without focal variation or attenuation; b) heterogeneous: focally changing optical properties and various backscattering patterns; c) layered: layers with different optical properties, with high scattering at the adluminal level and low scattering at the abluminal level; d) neoatherosclerotic: lesions with lipid-laden neointima and neointima with calcification or thin-cap fibroatheroma-like neointima. Macrophage infiltration and formation of microvessels have also been reported within neoatherosclerotic lesions.13 The presence of acute disruption or late discontinuities due to the resorption process were also analyzed.19,20 Furthermore, at the minimal lumen area, the restenotic tissue burden was measured (mean restenotic tissue area/mean stent area x 100).
Statistical AnalysisDescriptive analyses were used. Variables are presented as counts and percentages, whereas continuous data are expressed as the mean ± standard deviation. To compare means we used the Wilcoxon t test. All analyses were performed using SPSS 16.0.0. (IBM Corp., Armonk, New York, United States).
RESULTSPatientsThe baseline clinical presentation included ST-segment elevation myocardial infarction in 96 patients (29%), non–ST-elevation acute myocardial infarction in 30 patients (9%), unstable angina in 155 patients (47%), and stable angina in 49 patients (15%). The mean age at BVS implantation was 55 ± 8 years, and 94% of the patients were male. The procedure was successful in 323 patients (98%); 5 patients had periprocedural myocardial infarction (1.3%) and 2 patients died in the hospital (0.5%). After a follow-up of 19 ± 10 months, 18 cases of restenosis were detected in 17 patients (5.4%) and were confirmed angiographically. These patients constitute the basis of our analysis. The clinical data of patients with restenosis are shown in Table 1. The restenosis presentation time was 9 ± 4 months. Restenosis was early in 3 patients (18%), late in 8 patients (47%), and very late in 6 (35%). The clinical presentation of restenosis was benign, and none of the 3 patients with unstable angina had biomarker elevation. Furthermore, at the time of restenosis, 7 patients were asymptomatic. Six patients with a normal coronary CTA 6 months after treatment developed clinical recurrence at later follow-up secondary to late or very late restenosis. Patients treated for BVS restenosis were free of major adverse cardiovascular events at follow-up. The longest clinical follow-up of these patients was 14 months (mean 9 ± 5 months).
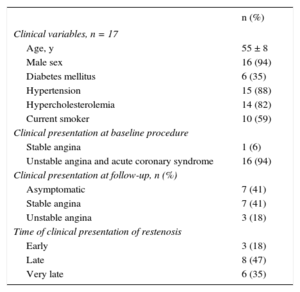
Clinical Data of Patients With Restenosis
| n (%) | |
|---|---|
| Clinical variables, n = 17 | |
| Age, y | 55 ± 8 |
| Male sex | 16 (94) |
| Diabetes mellitus | 6 (35) |
| Hypertension | 15 (88) |
| Hypercholesterolemia | 14 (82) |
| Current smoker | 10 (59) |
| Clinical presentation at baseline procedure | |
| Stable angina | 1 (6) |
| Unstable angina and acute coronary syndrome | 16 (94) |
| Clinical presentation at follow-up, n (%) | |
| Asymptomatic | 7 (41) |
| Stable angina | 7 (41) |
| Unstable angina | 3 (18) |
| Time of clinical presentation of restenosis | |
| Early | 3 (18) |
| Late | 8 (47) |
| Very late | 6 (35) |
At baseline conditions, the mean scaffolded length was 23 ± 9mm. Angiographic stenosis was reduced from 79 ± 23% to 9 ± 8%. The minimal lumen diameter increased from 0.7 ± 0.6mm to 2.9 ± 0.5mm after treatment. Table 2 shows the angiographic and procedural data. Most of the restenotic lesions were complex at baseline conditions. Angiographically, 4 restenotic lesions (22%) reproduced the baseline lesion in term of location and shape. The angiographic restenosis length was 10 ± 7mm. According to the Mehran classification, the most frequent type was focal restenosis in 12 (67%), located at the border of the scaffold (Ib) in 9 (75%) of them. Of these cases, the affected border was isolated in 6 and was combined with proximal intrascaffold renarrowing in 3. Regarding the 7 restenotic lesions detected by coronary CTA in asymptomatic patients, 6 were focal (4 Ib and 2 Ic), and 1 diffuse, from a chronic total occlusion treated with BVS.
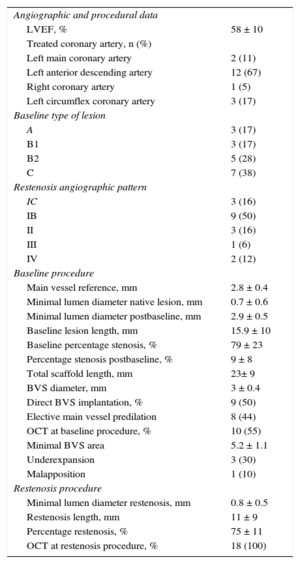
Angiographic and Procedural Findings in 17 Patients With 18 Lesions
| Angiographic and procedural data | |
| LVEF, % | 58 ± 10 |
| Treated coronary artery, n (%) | |
| Left main coronary artery | 2 (11) |
| Left anterior descending artery | 12 (67) |
| Right coronary artery | 1 (5) |
| Left circumflex coronary artery | 3 (17) |
| Baseline type of lesion | |
| A | 3 (17) |
| B1 | 3 (17) |
| B2 | 5 (28) |
| C | 7 (38) |
| Restenosis angiographic pattern | |
| IC | 3 (16) |
| IB | 9 (50) |
| II | 3 (16) |
| III | 1 (6) |
| IV | 2 (12) |
| Baseline procedure | |
| Main vessel reference, mm | 2.8 ± 0.4 |
| Minimal lumen diameter native lesion, mm | 0.7 ± 0.6 |
| Minimal lumen diameter postbaseline, mm | 2.9 ± 0.5 |
| Baseline lesion length, mm | 15.9 ± 10 |
| Baseline percentage stenosis, % | 79 ± 23 |
| Percentage stenosis postbaseline, % | 9 ± 8 |
| Total scaffold length, mm | 23± 9 |
| BVS diameter, mm | 3 ± 0.4 |
| Direct BVS implantation, % | 9 (50) |
| Elective main vessel predilation | 8 (44) |
| OCT at baseline procedure, % | 10 (55) |
| Minimal BVS area | 5.2 ± 1.1 |
| Underexpansion | 3 (30) |
| Malapposition | 1 (10) |
| Restenosis procedure | |
| Minimal lumen diameter restenosis, mm | 0.8 ± 0.5 |
| Restenosis length, mm | 11 ± 9 |
| Percentage restenosis, % | 75 ± 11 |
| OCT at restenosis procedure, % | 18 (100) |
BVS, bioresorbable vascular scaffold; LVEF, left ventricular ejection fraction; OCT, optical coherence tomography.
Restenosis cases detected by coronary CTA consistently identified luminal narrowing. The luminal growth always exhibited a soft and noncalcified appearance (Figure 2).
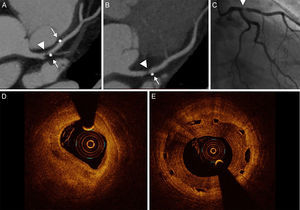
 resulting in severe stenosis. The maximal intensity projection depicts the patent scaffolded segment and the lesion proximal to the metallic marker (arrow). C: Angiographic study confirmed the severe focal stenosis (arrowhead). D: Out-scaffold restenosis. E: Optical coherence tomography study exhibited heterogeneous intrascaffold tissue.")
Coronary computed tomography angiography, angiography, and optical coherence tomography images of restenosis in the proximal left anterior descending artery after bioresorbable vascular scaffold implantation. A and B: Proximal border restenosis. The coronary computed tomography angiography shows a focal noncalcified plaque (arrowhead) resulting in severe stenosis. The maximal intensity projection depicts the patent scaffolded segment and the lesion proximal to the metallic marker (arrow). C: Angiographic study confirmed the severe focal stenosis (arrowhead). D: Out-scaffold restenosis. E: Optical coherence tomography study exhibited heterogeneous intrascaffold tissue.
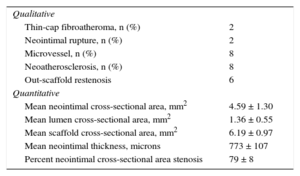
The main findings are summarized in Table 3. Previous predilation of restenosis was required before this study in 3 lesions, which modified the original restenotic lesion at the study. The OCT length of the restenosis was 11 ± 9mm. The lumen had a regular shape in most cases and an absence of intraluminal material. The OCT analysis revealed intimal disruption in only 2 lesions that were predilated.
Optical Coherence Tomography Findings in 18 Restenosis at Follow-up
| Qualitative | |
| Thin-cap fibroatheroma, n (%) | 2 |
| Neointimal rupture, n (%) | 2 |
| Microvessel, n (%) | 8 |
| Neoatherosclerosis, n (%) | 8 |
| Out-scaffold restenosis | 6 |
| Quantitative | |
| Mean neointimal cross-sectional area, mm2 | 4.59 ± 1.30 |
| Mean lumen cross-sectional area, mm2 | 1.36 ± 0.55 |
| Mean scaffold cross-sectional area, mm2 | 6.19 ± 0.97 |
| Mean neointimal thickness, microns | 773 ± 107 |
| Percent neointimal cross-sectional area stenosis | 79 ± 8 |
In 10 out of 18 restenotic lesions, OCT studies were available immediately after BVS implantation. In these lesions, the scaffold area did not differ from that measured at the time of restenosis (scaffold area at baseline study: 7 ± 1mm2, scaffold area at restenosis: 7.1 ± 1.2mm2; P= .735). Late overlapped struts were observed inside the tissue in 5 out of the 18 restenosis, suggesting late platform disruption. Three of them underwent OCT study after BVS implantation, showing optimal apposition and absence of acute scaffold disruption (Figure 3). Three restenotics lesions were predominantly homogeneous, 4 were heterogeneous, 5 were layered, and 6 exhibited lipid-laden characteristics (Figure 4). In 8 restenotic lesions (44%), we observed signs suggestive of neoatherosclerosis. The most common pattern was a layered neointima with or without lipid-laden content, particularly in diffuse restenosis. Furthermore, diffuse restenosis exhibited images that were suggestive of neovascularization of the growing tissue, and most showed macrophage infiltration (Table 4). In addition, the time presentation of diffuse restenosis was always late or very late (Figure 4). In contrast, most of the restenotic lesions that occurred in the first 6 months were located just at the proximal border (less than 5mm), and had a predominantly homogeneous pattern (Figure 5). In 5 out of 6 patients with an affected BVS border without any intrascaffold renarrowing, the OCT study at baseline procedure was revised. Vulnerable plaques were detected in 4 of them with minimal lumen area > 4.5mm2. Additionally, mild proximal dissections were detected in 3 lesions. In 2 lesions, the plaque was not fully covered by the BVS not visible angiographically and with a minimal lumen area of 5.8mm2 and 5.1mm2, respectively. Regarding the treatment of restenosis, a new device was implanted in all lesions. A new BVS was used to treat 4 in-segment proximal restenosis not involving the scaffold (Figure 5). The remaining 14 restenotic lesions were treated with a DES. In the 6 diffuse restenotic lesions, predilation was performed before stent implantation.
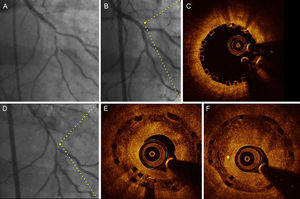
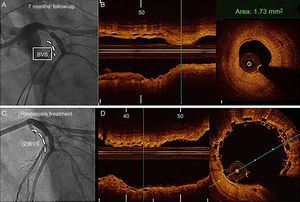
 and optical coherence tomography images (immediately after implantation and at follow-up) in a patient with diffuse restenosis A: Baseline angiography. B: Final result after bioresorbable vascular scaffold implantation (2.5 x 28mm) with provisional stent technique at bifurcation. C: Optical coherence tomography at the proximal segment exhibited optimal apposition and no fractures of the bioresorbable vascular scaffold. D: Angiographic study at follow-up. E: Optical coherence tomography at the proximal segment (same point of panel C) exhibited late overlapped struts and a layered pattern of neointimal tissue. F: Consecutive frame of E with the presence of neovascularization (asterisk).")
Angiographic (baseline, postbioresorbable vascular scaffold implantation and 14 months’ follow-up) and optical coherence tomography images (immediately after implantation and at follow-up) in a patient with diffuse restenosis A: Baseline angiography. B: Final result after bioresorbable vascular scaffold implantation (2.5 x 28mm) with provisional stent technique at bifurcation. C: Optical coherence tomography at the proximal segment exhibited optimal apposition and no fractures of the bioresorbable vascular scaffold. D: Angiographic study at follow-up. E: Optical coherence tomography at the proximal segment (same point of panel C) exhibited late overlapped struts and a layered pattern of neointimal tissue. F: Consecutive frame of E with the presence of neovascularization (asterisk).
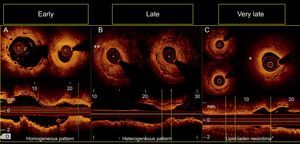
. C: Diffuse restenosis revealing a neoatherosclerotic process with a lipid-laden neointima (asterisk) at midsegments and heterogeneous tissue coverage structure at distal segments of the scaffold visualized in the short-axis and the longitudinal views.")
Patterns of restenosis observed according to the time of presentation. A: Restenosis at margin. B: Focal restenosis with heterogeneous pattern of in-scaffold neovascularization (double asterisk). C: Diffuse restenosis revealing a neoatherosclerotic process with a lipid-laden neointima (asterisk) at midsegments and heterogeneous tissue coverage structure at distal segments of the scaffold visualized in the short-axis and the longitudinal views.
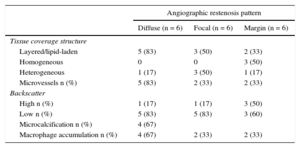
Relationship Between Angiographic and Optical Coherence Tomography Findings
| Angiographic restenosis pattern | |||
|---|---|---|---|
| Diffuse (n = 6) | Focal (n = 6) | Margin (n = 6) | |
| Tissue coverage structure | |||
| Layered/lipid-laden | 5 (83) | 3 (50) | 2 (33) |
| Homogeneous | 0 | 0 | 3 (50) |
| Heterogeneous | 1 (17) | 3 (50) | 1 (17) |
| Microvessels n (%) | 5 (83) | 2 (33) | 2 (33) |
| Backscatter | |||
| High n (%) | 1 (17) | 1 (17) | 3 (50) |
| Low n (%) | 5 (83) | 5 (83) | 3 (60) |
| Microcalcification n (%) | 4 (67) | ||
| Macrophage accumulation n (%) | 4 (67) | 2 (33) | 2 (33) |
 and optical coherence tomography images of late (7 months) restenosis at the proximal margin (B). At baseline, revascularization of the left anterior descending artery was performed with BVS 3.5 x 18mm. B: Restenosis at follow-up with homogeneous out-scaffold tissue. C: Final result of restenosis treatment. D: Minimal overlap of both implanted BVSs. BVS, bioresorbable vascular scaffold.")
Angiographic (A, C) and optical coherence tomography images of late (7 months) restenosis at the proximal margin (B). At baseline, revascularization of the left anterior descending artery was performed with BVS 3.5 x 18mm. B: Restenosis at follow-up with homogeneous out-scaffold tissue. C: Final result of restenosis treatment. D: Minimal overlap of both implanted BVSs. BVS, bioresorbable vascular scaffold.
The underlying mechanism of coronary restenosis after percutaneous treatment is believed to be a combination of intimal hyperplasia and early or delayed dynamic remodeling of the treated segment.21 Stent underexpansion may also play a role. OCT studies on early restenosis after BMS have demonstrated that neointimal proliferation of smooth muscle cells may be the major cause of the restenosis, which is visualized as a high-signal homogeneous region overlying the stent struts.19,20 Gonzalo et al.12 postulated the presence of neointimal materials with different optical properties and suggested that restenosis might be composed of different pathologic tissues. These issues have been analyzed with DES. However, little information is available on restenotic lesions after BVS implantation. To our knowledge, this is the largest reported series of BVS restenosis.
Our observational study suggests that restenosis after BVS is infrequent and appears to have different mechanisms. In our study, we did not observe collapse of the platform as a mechanism of restenosis. Similar results have been reported by Nakatani et al.6 In 6 in-scaffold restenotic lesions analyzed by OCT, they found that late or very late restenosis was attributed to pure intrascaffold tissue growth without extrinsic encroachment of the scaffold. This finding appears to be important because, the support of the platform is already lost in late restenosis. However, late scaffold disruption may occur (Figure 3) and is likely induced by the weakness of the scaffold during the bioresorption process. After 6 months, the platform loses support and slowly starts to lose mass. This analysis of restenosis after BVS implantation was performed over a period of time when the scaffold was still in place. The possibility of restenosis of a treated coronary segment after complete resorption has not yet been explored.
The proximal border was the preferred location of restenosis. In contraposition to BMS restenosis, a proliferative process that exhibits a predominant homogeneous optical appearance is rare in BVS restenosis and is noted only when the location is isolated at the margin (Figure 5). These characteristics could result from a rapid reactive proliferative response or geographic miss. Late restenosis was mostly diffuse and occurred within the scaffold. A layered appearance was a predominant pattern, and optical signs suggestive of neoatherosclerosis were observed (Figure 6). In our study, most very late restenosis exhibited signs suggestive of neoatherosclerosis. OCT studies identify microvessels, macrophage accumulation, and other histological processes that are involved in neoatherosclerosis.13,20,21 These mechanisms in metallic stents were associated with the inability to maintain a fully functional neointimal covering surface within the stented segment, which creates conditions to initiate new atheromatosis.22 In BMS, this phenomenon has been described as usually occurring more than 5 years after implantation.22 According to our results, the time of this process with BVS (13 ± 4 months) seems to be similar to the time of neoatherosclerosis reported in DES. The predictors of this grade of complex neointimal proliferation have been studied and appear to be associated with the thickness of neointimal hyperplasia, smoking history, chronic kidney disease, and the use of DES compared with BMS.23,24
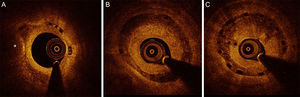
. B and C: Images of restenosis of the same vessel obtained from a patient 14 months after treatment. B depiction of a layered neointima. C: The presence of neovascularization in growing neointimal tissue.")
Optical coherence tomography signs suggestive of neoatherosclerosis. A: Bioresorbable vascular scaffold restenosis at 15 months’ follow-up exhibiting lipid-laden neointima with microcalcification (asterisk). B and C: Images of restenosis of the same vessel obtained from a patient 14 months after treatment. B depiction of a layered neointima. C: The presence of neovascularization in growing neointimal tissue.
Finally, clinical presentation of restenosis was predominantly benign, in correlation with a predominant focal angiographic pattern and with OCT findings, showing no neointimal rupture or intraluminal material.
LimitationsThe sample of restenotic lesions is small, although our study represents the largest series of BVS restenosis. In addition, OCT may have intrinsic limitations in the qualitative analysis of restenotic tissue. However, its high resolution provides detailed information on tissue characteristics. The restenosis rate could be higher because 16% of the patients did not have angiographic or coronary CTA follow-up studies. However clinical follow-up was achieved in all of them. The findings are descriptive and have not been compared with BMS or DES. The study did not analyze restenosis during the period when the device has completely disappeared and, possibly, different patterns may appear if restenosis develops after this.
CONCLUSIONSAfter a mean follow-up of 19 months, restenosis occurred in 5.4% of the lesions, and the clinical presentation was benign. Most of the restenotic lesions were focal and were located at the proximal border. In contrast, diffuse restenosis mostly occurred late or very late and showed signs suggestive of neoatherosclerosis. These findings require confirmation in further studies.
CONFLICTS OF INTERESTJavier Suárez de Lezo, Soledad Ojeda, Manuel Pan, and José Suárez de Lezo have received minor lecture fees from Abbott.
- -
Coronary restenosis after BVS is rare and little information is available on the main characteristics of this type of lesion.
- -
ABSORB II and the GHOST Registry showed comparable clinical outcomes at 1 year and 6 months, respectively, after BVS implantation compared with second-generation everolimus-eluting stents.
- -
Geographical missing and scaffold underexpansion have been identified as a predominant cause of BVS failure in a previous trial.
- -
A comprehensive description of the characterization of coronary restenotic lesions following BVS implantation by OCT.