Quantification of myocardial area-at-risk after acute myocardial infarction has major clinical implications and can be determined by cardiovascular magnetic resonance. The Bypass Angioplasty Revascularization Investigation Myocardial Jeopardy Index (BARI) and Alberta Provincial Project for Outcome Assessment in Coronary Heart Disease (APPROACH) angiographic scores have been widely used for rapid myocardial area-at-risk estimation but have not been directly validated. Our objective was to compare the myocardial area-at-risk estimated by BARI and APPROACH angiographic scores with those determined by cardiovascular magnetic resonance.
MethodsIn a prospective study, cardiovascular magnetic resonance was performed in 70 patients with a first successfully-reperfused ST-segment elevation acute myocardial infarction in the first week after percutaneous coronary intervention. Myocardial area-at-risk was obtained both by analysis of T2-short tau inversion recovery sequences and calculation of infarct endocardial surface area with late enhancement sequences. These results were compared with those of BARI and APPROACH scores.
ResultsBARI and APPROACH showed a statistically significant correlation with T2-short tau inversion recovery for myocardial area-at-risk estimation (BARI, intraclass correlation coefficient=0.72; P<.001; APPROACH, intraclass correlation coefficient=0.69; P<.001). Better correlations were observed for anterior acute myocardial infarction than for other locations (BARI, intraclass correlation coefficient=0.73 vs 0.63; APPROACH, intraclass correlation coefficient=0.68 vs 0.50). Infarct endocardial surface area showed a good correlation with both angiographic scores (BARI, intraclass correlation coefficient=0.72; P<.001; with APPROACH, intraclass correlation coefficient=0.70; P<.001).
ConclusionsBARI and APPROACH angiographic scores allow reliable estimation of myocardial area-at-risk in current clinical practice, particularly in anterior infarctions.
Keywords
Myocardial area-at-risk (AAR) is defined as the area of myocardial hypoperfusion during acute coronary occlusion in the absence of collateral circulation.1, 2, 3 This parameter permits the extension of the salvaged myocardium to be calculated if the necrotic myocardium is subtracted. Both parameters are highly useful, not only regarding the effectiveness of reperfusion therapies but also as prognostic factors in patients with an acute myocardial infarction (AMI). Furthermore, they can play an important role in decision-making in myocardial revascularization since they are able to distinguish between necrosed and viable myocardium.4, 5
T2-short tau inversion recovery (STIR) sequences, by cardiovascular magnetic resonance (CMR), have been validated with microsphere injection in animals, the reference technique for estimating AAR in experimental studies,6 and have been widely used in routine common clinical practice to estimate the AAR in patients with an AMI. In cases of poor-quality images from T2-STIR sequences,7, 8, 9 the infarct endocardial surface area (infarct-ESA), obtained by delayed enhancement sequences,10, 11 constitutes an alternative method.
The angiographic Bypass Angioplasty Revascularization Investigation Myocardial Jeopardy Index (BARI) and Alberta Provincial Project for Outcome Assessment in Coronary Heart Disease (APPROACH) scores have been proposed as alternative methods for early estimation of the AAR during coronary angiography, and are of particular interest when CMR is not available.10, 12, 13, 14 Moreover, it is unknown whether the AMI location plays a role in the accuracy of AAR measurements calculated through angiographic scores.11
The aim of this study was to validate estimation of the AAR obtained with angiographic BARI and APPROACH scores in order to establish their reproducibility and accuracy by comparing them with the measure provided by T2-STIR, considered the reference method, and infarct-ESA.
Methods PatientsBetween October 2008 and June 2010, 75 consecutive patients with ST-segment elevation AMI successfully reperfused through primary percutaneous coronary intervention (PCI) and undergoing CMR within the first week after reperfusion were prospectively studied in a single center trial. The criteria to perform primary PCI were chest pain duration over 30min, ST-segment elevation on the electrocardiogram≥0.1mV in 2 or more adjacent leads and performance of PCI within the first 24h after symptom onset. Patients with hemodynamic instability, acute pulmonary edema or cardiogenic shock just prior to CMR, previous AMI or any other contraindication to the test, were not considered eligible to enter the study. Five (7%) patients were excluded since CMR could not be performed owing to claustrophobia, and none of them for other causes. Data from the remaining 70 patients were evaluated. The artery responsible for the AMI was identified from angiographic findings and clinical information (electrocardiographic data). Informed consent was obtained from all patients and the study was approved by the local ethics committee.
Cardiovascular Magnetic ResonanceAll CMR studies were performed with 1.5 T equipment (Siemens Avanto). Images were obtained in synchronization with the electrocardiogram and in apnea. Short-axis cine views were performed to quantify the volumes and ejection fraction (SSFP sequences; slice thickness: 8mm; space between slices 20%; matrix: 256×256: field of view: 300-370mm; temporal resolution<50ms). To evaluate the edema, STIR sequences were used in the same view as the cine sequences, all in mid-diastole (slice thickness: 8mm; space between slices 20%; matrix: 256×256: FOV: 300-370mm; temporal resolution<50ms; repetition time: 2 R-R intervals; echo time: 100ms; inversion time: 170ms; flip angle: 160°; bandwidth, 781Hz/pixel). Finally, late enhancement sequences were used to quantify the size of the AMI and were obtained 15min after intravenous administration of 0.2 mmol/kg of dimeglumine gadopentetate–Magnevist® (slice thickness: 8mm; space between slices 20%; matrix: 256×256: field of view: 300-370mm; optimal inversion time to suppress the myocardium signal).
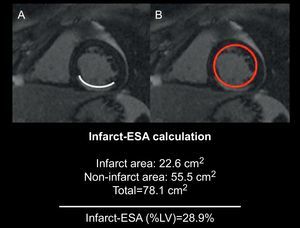
Image AnalysisAll studies were analyzed on a workstation (QMASS MR 7.1, Medis Medical Imaging Systems, The Netherlands) by 2 cardiologists specialized in imaging and blinded to both the clinical and angiographic results. Endocardial and epicardial borders were delineated at end-systole and end-diastole with short-axis views to quantify volumes, functions and mass of the left ventricle (LV). The AAR was quantified in T2-STIR sequences delineating the areas of intensity, plus 2 standard deviations above average, obtained from the remote healthy myocardium, and normalized by the LV mass. Signal intensity was obtained in the edematous area, in the healthy myocardium contralateral to the edema (remote myocardium) and in the background noise area for calculation of the signal-to-noise and contrast-to-noise ratio.5 Hypointense areas within hyperintense regions were interpreted as intramyocardial hemorrhage areas15, 16 and were thus included in the AAR territory. Quantification of the infarcted myocardium was assessed by delineating the enhanced areas in the late enhancement sequences with 5 standard deviations above average, obtained from the remote healthy myocardium, and normalized by the LV mass. The hypoenhanced areas, suggesting microvascular obstruction, were included in the infarct volume. In case of poor quality of T2-STIR sequences, the quantification of AAR was performed with the help of delayed enhancement images to improve the reproducibility of the method. In these cases, the consensus between both cardiologists specialized in cardiac imaging was required. The infarct-ESA was calculated as: (summed endocardial hyperenhancement infarct length/total LV endocardial length)×10010 (Figure 1). The salvaged myocardium was calculated as the difference in AAR, obtained by quantitative analysis of the T2-STIR sequences, minus the size of the necrosis obtained through late enhancement sequences.

Figure 1. Image showing the infarct endocardial surface area score calculation in which infarct endocardial surface area (A) is divided by total endocardial surface (B). 10 Infarct-ESA, infarct endocardial surface area; LV, left ventricle.
Coronary AngiographyAll patients underwent coronary angiography according to the protocol established by the catheterization laboratory. All were implanted with at least one stent depending on the characteristics of the lesion. Collateral flow was evaluated before performing the PCI and according to Rentrop's classification, where 0 stands for total absence of collateral circulation and 3 for complete retrograde filling of the ischemic territory until occlusion.17 Anterograde flow in the infarct-related artery prior to the PCI was characterized using the TIMI (Thrombolysis in Myocardial Infarction) system.18 The AAR was established using the BARI and modified APPROACH scores.
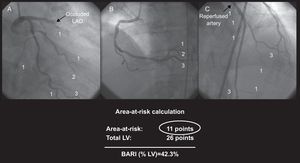
Bypass Angioplasty Revascularization Investigation Myocardial Jeopardy Index ScoreThis system assigns a score to all terminal arteries (terminal portion of the left anterior descending, left circumflex, and right coronary artery, as well as the ramus, diagonals, obtuse marginals, posterior descending and posterolateral branches) based on their length and caliber according to specific criteria.12 A value of 0 represents an almost insignificant vessel size, whereas a value of 3 defines a large-size artery with a length of two thirds the distance between the base and cardiac apex. Right ventricular marginals and posterior descending artery septal branches are not taken into account.12 The final score is obtained by dividing the resulting value from the infarct-related artery by the overall score of all arteries supplying the LV, which finally permits estimation of the percentage of myocardial muscle at risk (Figure 2). Stenosed arteries in noninfarcted areas are not added to the AAR.

Figure 2. Area-at-risk calculation according to Bypass Angioplasty Revascularization Investigation Myocardial Jeopardy Index score: the value of the responsible artery is assessed by its length and branches, and is divided by the total score obtained from all arteries. 12 BARI, Bypass Angioplasty Revascularization Investigation Myocardial Jeopardy Index; LAD, left anterior descending artery; LV, left ventricle.
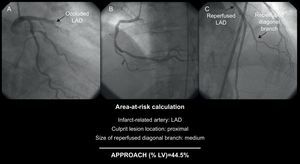
Modified Alberta Provincial Project for Outcome Assessment in Coronary Heart Disease ScoreThis score is based on the division of the LV into regions in accordance with anatomopathological studies in humans, which evaluate the relative proportion of the myocardium perfused by each artery.3, 19, 20 The modified APPROACH score10 provides the AAR value, taking into account the location of the culprit lesion and dominance and size of the secondary branches (Figure 3). As with the BARI score, stenosed arteries in noninfarcted areas are not added to the AAR.

Figure 3. Area-at-risk calculation according to the modified Alberta Provincial Project for Outcome Assessment in Coronary Heart Disease score: based on the responsible artery, location of the lesion and size of some of the main branches. 10 APPROACH, Alberta Provincial Project for Outcome Assessment in Coronary Heart Disease; LAD, left anterior descending artery; LV, left ventricle.
Interobserver VariabilityEach AAR calculation method was assessed with the evaluator blinded to the results of other techniques. All studies, both angiographic and CMR, were evaluated separately by 2 cardiologists specialized in cardiac imaging and 2 interventional cardiologists who were unaware of previous results, to obtain the interobserver variability of each AAR estimation method.
Statistical AnalysisContinuous variables were expressed as mean (standard deviation [SD]) and categorical variables as percentages. The Kolmogorov-Smirnov test was applied to evaluate the normal distribution of variables. The interobserver variability and correlation between methods were calculated using the coefficient of intraclass correlation (ICC), which describes how strongly units in the same group resemble one other. Finally, Student's t-test was used in cases of normal distribution and the Mann-Whitney U test in the opposite case to calculate the difference between groups for continuous parameters. P values<.05 were considered statistically significant. Data plotting used in analyzing the agreement between the different methods was made with Bland-Altman analysis. The SPSS version 13.0 (Chicago, Illinois, United States) software was used for the statistical analysis.
ResultsThe clinical, CMR and angiographic characteristics of the population are shown in Table 1. The descending anterior artery was responsible for the AMI in 30 patients (43%). The mean time from symptom onset to achievement of TIMI flow grade 3 during PCI was 227 (69) min (range: 97-380min). Although 44.30% of patients showed multivessel coronary artery disease, none of nonresponsible lesions showed a chronic total occlusion.
Table 1. Clinical, Cardiovascular Magnetic Resonance and Angiographic Characteristics of the Study Participants (n=70).
| Male | 62 (88.6) |
| Age, years | 57.7±13.9 |
| Hypertension | 35 (50) |
| Smokers | 50 (71.4) |
| Dyslipidemia | 22 (31.4) |
| Diabetes mellitus | 10 (14.3) |
| Family history of ischemic heart disease | 9 (12.9) |
| LVEDV, mL | 161.5±37.5 |
| LVESV, mL | 84.7±31.7 |
| LVEF | 49±10.5 |
| Left ventricular mass, g | 127±28.1 |
| Infarct size, g | 31.7±21.7 |
| Rentrop≤1 | 60 (85.7) |
| TIMI flow before PCI | |
| 0 | 65 (92.9) |
| 1 | 3 (4.3) |
| 2 | 2 (2.9) |
| Number of affected vessels | |
| 1 vessel | 39 (55.7) |
| 2 vessels | 21 (30) |
| 3 vessels | 10 (14.3) |
| Artery responsible for the AMI | |
| Left anterior descending artery | 30 (43) |
| Left circumflex | 11 (16) |
| Right coronary artery | 29 (41) |
AMI, acute myocardial infarction; LVEDV, left ventricle end-diastolic volume; LVESV, left ventricle end-systolic volume; LVEF, left ventricular ejection fraction; PCI, percutaneous coronary intervention; TIMI, Thrombolysis in Myocardial Infarction.
Data are expressed as no. (%) or mean±standard deviation.
CMR was performed 4.3 (1.5) days (range: 2-7 days) after PCI. In all cases, increased signal intensity was detected in T2-STIR as well as in late enhancement sequences. The signal-to-noise ratio of the edematous myocardium vs healthy myocardium was: 11.3 (3.2) vs 5.6 (2.7), respectively (P<.001). The contrast-to-noise ratio of the edematous myocardium vs healthy myocardium was 5.7 (2.1). However, in 4 cases (5.7%) the T2-STIR images were of low quality, and required a consensus between both cardiologists specialized in cardiac imaging.
Comparison Between Infarcted Area and the Different Myocardial Area-at-risk Estimation ScoresThe AAR calculated through T2-STIR analysis varied between 14% and 79.7% of total LV mass (mean [SD]: 36.9 [14.3%]). The AAR measured by T2-STIR sequences was significantly higher than the necrosis size calculation, which varied between 1.1% and 69.7% of total LV mass (mean [SD]: 24.2 [13.5%]) (Table 2). Interobserver variability for infarct size calculation was good (Table 3). The mass of the salvaged myocardium, defined as the difference between AAR obtained by T2-STIR sequences and the necrotic mass assessed through late enhancement sequences, was 16 (11.5g) (range: 1.1-56g) and the myocardial salvaged index was 12.8 (8.6%).
Table 2. Mean Value of Each Myocardial Area-at-risk Quantification Method and Comparison With Infarct Size.
| Parameters | Mean value (SD) | P * |
| Infarct size | 24.2 (13.5%) | - |
| T2-STIR | 36.9 (14.3%) | <.001 |
| BARI | 32.8 (10.8%) | <.001 |
| APPROACH | 30.8 (11.3%) | <.001 |
| Infarct-ESA | 32.0 (14.5%) | <.001 |
APPROACH, Alberta Provincial Project for Outcome Assessment in Coronary Heart Disease; BARI, Bypass Angioplasty Revascularization Investigation Myocardial Jeopardy Index; Infarct-ESA, infarct endocardial surface area; SD, standard deviation; T2-STIR, short tau inversion recovery.
* Infarct size vs myocardial area-at-risk evaluated by each method.
Table 3. Interobserver Variability of Each Myocardial Area-at-risk Quantification Method and Infarct Size Evaluated With the Coefficient of Intraclass Correlation.
| Parameters | ICC (95%CI) |
| Infarct size | 0.89 (0.82-0.93) |
| T2-STIR | 0.81 (0.70-0.89) |
| BARI | 0.91 (0.82-0.96) |
| APPROACH | 0.92 (0.83-0.97) |
| Infarct-ESA | 0.86 (0.78-0.90) |
95%CI, 95% confidence interval; APPROACH, Alberta Provincial Project for Outcome Assessment in Coronary Heart Disease; BARI, Bypass Angioplasty Revascularization Investigation Myocardial Jeopardy Index; ICC, intraclass correlation coefficient; Infarct-ESA, infarct endocardial surface area; T2-sTIR, short tau inversion recovery.
There was an excellent correlation between the BARI and APPROACH scores (Table 4), and both showed very low interobserver variability (ICC=0.91 and ICC=0.92, respectively) (Table 3).
Table 4. Intraclass Correlation Coefficients Between Angiographic and Cardiovascular Magnetic Resonance Methods to Assess Myocardial Area-at-risk.
| Parameters | T2-STIR | APPROACH | BARI |
| Infart-ESA | 0.87 * (0.51-0.94) | 0.72 * (0.58-0.81) | 0.70 * (0.56-0.80) |
| BARI | 0.72 * (0.52-0.83) | 0.91 * (0.83-0.97) | |
| APPROACH | 0.69 * (0.35-0.84) |
APPROACH, Alberta Provincial Project for Outcome Assessment in Coronary Heart Disease; BARI, Bypass Angioplasty Revascularization Investigation Myocardial Jeopardy Index; Infarct-ESA, infarct endocardial surface area; T2-STIR, T2-short tau inversion recovery.
Data are expressed intraclass correlation coefficients (confidence interal).
* P<.001.
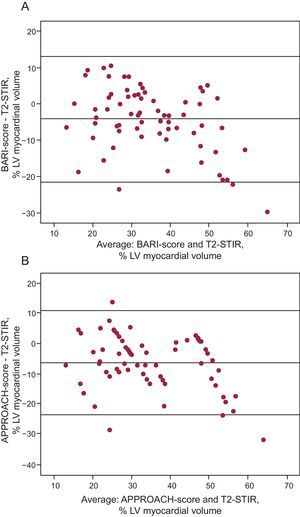
Both BARI and APPROACH showed a good correlation when AAR was obtained through T2-STIR analysis (Table 4 and Figure 4). Nevertheless, the correlations were dependent on infarct location. In anterior infarctions, ICC were 0.73 (0.13-0.89; P<.001) and 0.68 (0.10-0.87; P<.001) for BARI and APPROACH, respectively, whereas in other territories, ICC were 0.63 (0.32-0.81; P=.001) and 0.50 (0.09-0.75; P=.004), respectively.

Figure 4. Bland-Altman analysis comparing T2-STIR with BARI (A), and T2-STIR with APPROACH (B). APPROACH, Alberta Provincial Project for Outcome Assessment in Coronary Heart Disease; BARI, Bypass Angioplasty Revascularization Investigation Myocardial Jeopardy Index; LV: left ventricle; T2-STIR, T2-short tau inversion recovery.
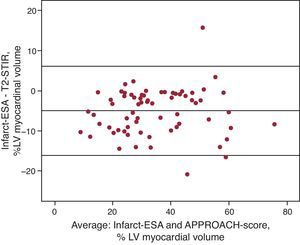
Comparison Between Quantitative Analysis of T2-STIR and Infarct Endocardial Surface AreaInfarct-ESA showed a good correlation with AAR obtained through T2-STIR sequences (Table 4 and Figure 5). In addition, the interobserver variability of both scores was very small, particularly infarct-ESA (Table 3).

Figure 5. Bland-Altman analysis comparing T2-STIR with infarct endocardial surface area. APPROACH, Alberta Provincial Project for Outcome Assessment in Coronary Heart Disease; Infarct-ESA, infarct endocardial surface area; LV, left ventricle; T2-STIR, T2-short tau inversion recovery.
DiscussionThe present study shows a good correlation between AAR defined through angiographic scores and CMR STIR sequences in patients with ST-segment elevation myocardial infarction receiving primary PCI. The correlation was better in anterior infarctions, and both angiographic scores had low interobserver variability. These results demonstrate that angiographic scores provide clinically useful estimation of AAR, particularly in anterior infarctions. This finding is relevant to clinical practice since AAR is an important variable in patients with ST-segment elevation AMI and CMR is not universally available. Several methods have been proposed to estimate AAR. Fluorescent microsphere injection is the technique of choice in animal studies and SPECT (single-photon emission computed tomographt) is the most frequently used technique in humans.6, 21 Nonetheless, the latter is subject to certain limitations owing to the need for 24h a day availability, radiation exposure and low spatial resolution. Angiographic scores represent a rapid alternative method to estimate AAR and are based on the concept of the anatomical AAR proposed by Seiler et al.22 Such an approximation is based on the assumption that each myocardial segment is irrigated by one of the coronary arteries and that the extension of the irrigated area depends on the length and the branches of the vessel. In recent years, CMR has been proposed as an excellent alternative method for AAR estimation. Several studies have shown that T2-weighted sequences performed after AMI permit retrospective identification of AAR both in animals and humans.6, 23
Correlation Between Angiographic Scores and Myocardial Area-at-risk Calculation Through Cardiovascular Magnetic ResonanceAlthough angiographic scores have been partially compared to other reference methods for AAR calculation,10, 11, 14 BARI has not been directly validated by any of the reference methods (T2-STIR sequences or myocardial SPECT), and only one study with significant limitations has evaluated the correlation between APPROACH and T2-STIR. Wright et al.,11 had shown a moderate correlation between BARI and infarct-ESA (r=0.42), which in turn showed a good correlation with T2-STIR (r=0.77). Nevertheless, no direct data on the correlation between BARI and T2-STIR were provided. Previously, Ortiz-Perez et al.,10 had provided a comparison between both angiographic scores and infarct-ESA, obtaining an excellent correlation (r=0.9 for BARI and r=0.87 for APPROACH), although none of the methods had been validated previously. Another recently published study provided data on the correlation between AAR using T2-STIR sequences and APPROACH, with very good results (r=0.78). Nonetheless, some features of that study might limit the general validity of its conclusions: 24% of the 50 included patients had an acute coronary syndrome without ST-segment elevation, up to 20% had a previous history of AMI and up to 26% showed collateral circulation with a value of >1 on the Rentrop scale.14
Our study shows the good correlation between both angiographic scores and all CMR-derived indices in a homogeneous sample. The better results in our series as compared with that of Wright et al., may stem from the fact that all our CMR studies were performed 2-7 days after AMI, while this period of time was up to 20 days in Wright's study.
Cardiovascular Magnetic Resonance Scores for Myocardial Area-at-risk CalculationOwing to the limitations for exact AAR delineation of T2-STIR,7, 8, 9 alternative scores are sometimes required for its estimation. Different methods validated through pathological anatomy, similar to infarct-ESA, have been used in animal samples with the same goal and good results.24, 25 As the calculation of infarct-ESA does not require T2-STIR sequences, and late enhancement sequences do not show as many limitations when high resolution images are obtained, it can constitute an excellent alternative. This could be one of the main reasons why infarct-ESA shows a better interobserver correlation (ICC=0.86) than AAR calculation with T2-STIR (ICC=0.81). Moreover, the correlation between angiographic scores and infarct-ESA is as good as T2-STIR.
Influence of Acute Myocardial Infarction Location on the Correlation Between the Different ScoresWright et al.11 noted that one possible explanation for the discrepancies between T2-STIR and infarct-ESA with regard to the BARI score when compared with the results obtained by Ortiz-Pérez et al.,10 might be that inferior wall infarctions occasionally extend to the right ventricle,26 an area not evaluated by the first 2 methods but partially evaluated by the third. However, on the basis of data obtained in our study, although this explanation could be applied for the BARI score, it cannot be valid for the APPROACH score, which considers solely the LV. A possible reason could be the normal anatomical variability of the coronary arteries.12 The source of the most frequent variation is the posterior descending artery, which basically defines the irrigation predominance of the inferior territory at the expense of the right coronary artery, dominant in 70% of patients, or the circumflex artery.12 Furthermore, other terminal branches, such as the posterolateral arteries, which supply a variable area of the inferior and lateral wall, can originate from both arteries, which explains why these areas are subject to wide anatomical variability in irrigation. Pereztol-Valdés et al.,27 found wide variability in the inferior and lateral walls using cardiac perfusion scintigraphy to calculate the area irrigated by each of the coronary arteries compared to the standardized 17-segment model. Although there are differences in results depending on AMI location, the correlation between angiographic scores and CMR methods in anterior and nonanterior infarctions is statistically significant for each one separately. Therefore, the usefulness of BARI and APPROACH scores for both territories seems consistent.
Clinical Significance of our StudyLarger AAR are associated with greater infarct size, lesser ejection fraction, a higher number of hypoperfused segments and greater microvascular obstruction.4 Moreover, measurement of AAR and comparison with infarct size allows estimation of salvaged myocardium, which adds clinically valuable information compared with infarct size alone. Myocardial infarctions with little or no salvaged myocardium are more likely to be transmural, exhibit more risk of cardiovascular events and trigger adverse remodelling than infarcts of similar size but surrounded by an important mass of salvaged myocardium.28Measurement of AAR is also an essential research tool to evaluate reperfusion strategies and to maximize salvaged myocardium in patients with ST-segment elevation AMI, offering a much needed therapeutic approach.29, 30, 31, 32, 33
LimitationsThe inclusion of patients with ST-segment elevation AMI only, and no other, implies that our results may not be extrapolated to all types of acute coronary syndromes.
ConclusionsThe concordance between the methods used to evaluate the AAR through CMR and angiography is good and they represent an excellent alternative for clinical practice, particularly in anterior myocardial infarction. The infarct-ESA score constitutes an interesting alternative for AAR calculation, particularly in patients whose myocardial signal is hard to delineate in T2-STIR sequences.
FundingPartially funded by the Spanish Cooperative Cardiovascular Research Network (RECAVA, Red Temática de Investigación de Enfermedades Cardiovasculares) RD/006/0014/025 of the Instituto de Salud Carlos III, Spanish Ministry of Science.
Conflicts of interestNone declared.
Received 15 November 2011
Accepted 13 April 2012
Corresponding author: Servicio de Cardiología, Hospital Universitario Vall d’Hebron, Universidad Autónoma de Barcelona, Paseo Vall d’Hebron 119-129, 08035 Barcelona, Spain. moral.sergio@yahoo.es