Keywords
INTRODUCTION
Pulmonary embolism (PE) is a disease with a wide range of clinical manifestations that influences therapeutic strategies.1 Some 5% of patients present in cardiogenic shock and receive systemic fibrinolysis as the treatment of choice.2 In contrast, hemodynamically stable patients are administered low molecular weight heparin (LMWH) or unfractioned heparin as a bridge to oral anticoagulation. Early death in these patients is 2%-10% at £3 months follow-up.3-6 Currently, the therapeutic challenge lies in identifying a group of higher-risk, hemodynamically stable patients, for whom a more aggressive treatment may improve prognosis.
Several studies have shown right ventricular dysfunction determined by transthoracic echocardiography or elevated biomarkers (troponin or natriuretic peptide) associates with prognosis in patients with PE.7-10 However, not all centers have transthoracic echocardiography facilities and interpretation is operator dependent. Cutoff points for cardiac dysfunction markers have not been standardized11 and echocardiography sometimes needs to be repeated,12 diminishing its value in clinical practice.
All centers have electrocardiogram (ECG) facilites. The ECG is a fast, low-cost, and possibly simple tool for prognostic stratification of patients with PE.13 The objective of the present study is to evaluate the prognostic value of electrocardiographic findings in a consecutive series of hemodynamically stable patients diagnosed with acute symptomatic PE.
METHODS
Design
We conducted a prospective cohort study at a university hospital from January 2003 thru December 2006.
Patients and Selection Criteria
We included all outpatients consecutively diagnosed with acute symptomatic PE in the emergency room of Hospital Ramón y Cajal, Madrid (Spain). We excluded patients diagnosed as hemodynamically unstable (defined as systolic blood pressure [SBP] <90 mm Hg, indication for fibrinolytic treatment or inferior vena cava filter, discretionary use of vasoactive drugs, cardiopulmonary reanimation, or orotracheal intubation). Pulmonary embolism was objectively confirmed. Diagnosis of PE using computerized tomography (CT) in angiography showed partial intraluminal defect surrounded by contrast or complete pulmonary artery occlusion in 2 consecutive CT cuts.14 Diagnosis of PE by ventilation/perfusion scintigraphy was performed in high likelihood patients defined according to PIOPED criteria15 (at least 1 segment perfusion defect or 2 subsegments with normal ventilation) or in patients with clinical suspicion of PE, inconclusive scintigraphy, and diagnostic echography of lower limbs showing defect of venous lumen compressibility as a sign of deep vein thrombosis (DVT).
Interventions
Weight-adjusted dosage of LMWH was administered every 12 hours for a minimum of 5 days minimum. Administration of vitamin K antagonists together with LMWH was initiated between day 1 and day 3 of treatment and LMWH was interrupted when International Normalized Ratio (INR) was stable and >2. Monitoring of INR values was according to local practice at the center.
Electrocardiogram
All patients underwent 12-lead ECG (25 mm/s and 1 mV/cm) at diagnosis. We considered evidence of right ventricular dysfunction and evaluated these electrocardiographic findings as predictors of death: a) sinus tachycardia (>100 beats/min); b) ST-segment or T-wave abnormalities; c) right bundle branch block (RBBB); d) S1Q3T3 pattern; and e) recent-onset atrial arrhythmia.
Episodes Analyzed
We defined all-cause death one-month following diagnosis as the principal outcome parameter. Death from PE during the 15 days following diagnosis was the secondary parameter. Two researchers (CEC and DJC) agreed on cause of death without access to patients' clinical characteristic data or electrocardiographic findings.
Statistical Analysis
We analyzed the univariate relation between ECG and other baseline characteristics and the principal outcome parameter with c2 for categorical variables and Student t test for continuous variables. We used the Fisher exact test when expected values were <5. A P value less than .05 was considered significant. We conducted multivariate logistic regression analysis to identify variables predicting death at the month following diagnosis of PE. In the final analysis, we only included variables with P<.10. We calculated risk ratios (RR) with a 95% confidence interval (CI) for each variable in the model. We present sensibility, specificity, positive and negative predictive values, and positive and negative likelihood ratios for prognostic electrocardiographic findings. Statistical analysis was with SPSS 12.0.
RESULTS
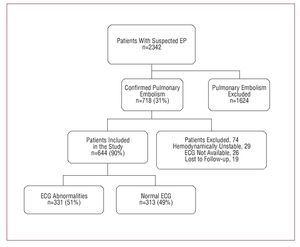
From January 2003 thru December 2006, 718 patients were diagnosed with acute symptomatic PE in the Emergency Room of Hospital Ramón and Cajal, Madrid (Spain); 29 (4%) were excluded as hemodynamically unstable; 26 patients could not undergo ECG at the 48 hours following diagnosis; 19 patients were lost to follow-up. The final population consisted of 644 (93%) hemodynamically stable patients diagnosed with acute symptomatic PE (Figure).

Figure. Flow chart of patients included in the study
At 15 days follow-up, 45 (7%) patients died; 24 from PE. Other causes of death were: cancer (n=8), hemorrhage (n=3), infection (n=3), unknown (n=3), heart failure (n=2), COPD, kidney failure, and epileptic seizure. At 30 days follow-up, 10% (62/644) of patients had died. Cumulative incidence of death from PE at the 30 days follow-up was 5%.
We identified electrocardiographic abnormalities in 51% of patients; sinus tachycardia was the most frequent abnormality (25%). RBBB was identified in 15% of patients; 12% had ST-segment or T-wave abnormalities; 11%, atrial arrhythmias; and 10%, S1Q3T3 pattern. Patient characteristics with or without electrocardiographic abnormalities are compared in Table 1. In patients with abnormal ECG, dyspnea was the most frequent symptom at presentation and they showed significantly lower values of O2 saturation in arterial blood at admission. At 15 days follow-up, significantly more patients died from PE in the group with abnormal ECG (5% vs 2%; P=.05).

Variables associated with all-cause death at one-month following diagnosis in bivariate analysis are in Table 2. After adjusting for predictive clinical variables in bivariate analysis, sinus tachycardia associated significantly with all-cause death at one-month. Variables associated with death from PE at 15 days are in Table 3. Only history of active neoplasia, 34 days immobility and ECG with atrial arrhythmias not previously, diagnosed associate significantly with death in logistic regression analysis.


Atrial arrhythmias not previously diagnosed showed a high negative predictive value for death from PE at 15 days (97%), but the positive predictive value was low (Table 4).

DISCUSSION
In this study, we have analyzed the prognostic capacity of electrocardiographic findings in a consecutive series of stable patients diagnosed with acute symptomatic PE. Essentially, 2 findings derive from our study. Firstly, sinus tachycardia is the only ECG abnormality that increases risk of all-cause death in stable patients with PE at the 30 days following diagnosis. Secondly, atrial arrhythmias led to a 2.8-fold increase in risk of death from PE at 15 days.
We isolated electrocardiographic abnormalities in 51% of the 644 patients studied. This prevalence was significantly below that reported elsewhere.16-19 Stein et al16 identified ECG abnormalities in 77% of patients with submassive PE and in 94% of patients with massive PE. Ferrari et al17 described electrocardiographic abnormalities in 91% of patients, although the majority (74%) presented massive PE. The discrepancy with our results is probably due to the different hemodynamic profiles of the populations studied. The electrocardiographic pattern of subepicardial ischemia (negative T-waves in precordial leads) has been considered the most common electrocardiographic abnormality20,21 and is described in <85% of patients with massive PE. However, prevalence falls to 18% in patients with submassive PE.17 Again, the low-risk profile of our patients could explain the low prevalence of this pattern in the series analyzed.
In logistic regression analysis, we found no association between the electrocardiographic abnormalities previously described as indicators of severe PE16,17 and prognosis. Only sinus tachycardia associated with all-cause death at the first month following diagnosis of PE. This had already been reported.22 Recent-onset atrial arrhythmias, together with history of neoplasia and immobility, associated with death from PE at 15 days follow-up. In patients with PE, these arrhythmias create secondary atrial distension increasing pressure overload23 or could be a marker of preexisting cardiac disease.
In our experience, the negative predictive value of atrial arrhythmias for death from PE is excellent (97%). However, the number of events in the series analyzed was small and, in practical terms, limits this predictive value. In this context, negative (0.79) and positive (2.87) likelihood ratios indicate atrial arrhythmias contribute little added value to clinical considerations in selecting patients at low- (candidates for early discharge) or high-risk (candidates for thrombolytic treatment).
The relation between electrocardiographic findings of right ventricular overload and hemodynamic abnormalities in PE is well-documented.5,17,24 In 151 patients with confirmed diagnosis of PE, presence of a QR pattern in V1 and negative T in V2 associated with moderate or severe right ventricular dysfunction.5 In a study of 80 patients with PE, presence of negative T-wave in V2 associates with mean pulmonary artery pressure elevation (37 [8] mm Hg).17 However, this association seems more complex than initially suspected. Although it is attractive to assume that electrocardiographic abnormalities in patients with PE are the result of myocardial ischemia or of right ventricular wall distension, some studies have been unable to show this association.25
By comparison with previously published studies, ours has a number of advantages. Firstly, we included outpatients consecutively diagnosed with PE by using objective methods. Secondly, only hemodynamically stable patients participated in the study. This is especially important given that there is no doubt that hemodynamically unstable patients should receive thrombolytic treatment3 and cannot be included in outpatient treatment programs. Thirdly, instead of analyzing the correlation between electrocardiographic abnormalities and angiographic, or hemodynamic findings,16,17,24 we directly evaluated the prognostic capacity of the ECG in relation with all-cause death and death from PE. Finally, all patients were managed according to a similar treatment protocol, independently of the electrocardiographic findings.
CONCLUSIONS
Although atrial arrhythmias increase the risk of death from PE in the population studied, electrocardiographic abnormalities are of limited use in the prognostic stratification of these patients.
ABBREVIATIONS
CI: confidence interval
COPD: chronic obstructive pulmonary disease
CT: computed tomography
DVT: deep vein thrombosis
ECG: electrocardiogram
INR: International Normalized Ratio
LMWH: low molecular weight heparin
PE: pulmonary embolism
RBBB: right bundle branch block
RR: relative risk
SBP: systolic blood pressure
VTE: venous thromboembolism
SEE EDITORIAL ON PAGES 229-32
Correspondence: Dr. D. Jiménez Castro.
Servicio de Neumología. Hospital Ramón y Cajal. Departamento de Medicina. Universidad de Alcalá de Henares. 28034 Madrid. España.
E-mail: djc_69_98@yahoo.com
Received July 16, 2007.
Accepted for publication November 28, 2007.