
Pathologic intimal thickening (PIT) has been considered a benign plaque phenotype. We report plaque phenotypic changes in a baseline/follow-up intravascular ultrasound-based virtual histology study.
MethodsA total of 61 patients with stable coronary artery disease were analyzed from the HEAVEN trial (89 patients randomized between routine statin therapy vs atorvastatin 80mg and ezetimibe 10mg) with serial intravascular ultrasound imaging of nonculprit vessels. We compared changes in 693 baseline and follow-up 5-mm long segments in a novel risk score, Liverpool Active Plaque Score (LAPS), plaque parameters, and plaque composition.
ResultsThe PIT showed the highest increase of risk score and, with fibrous plaque, also the LAPS. Necrotic core (NC) abutting to the lumen increased in PIT (22 ± 51.7; P = .0001) and in fibrous plaque (17.9 ± 42.6; P = .004) but decreased in thin cap fibroatheroma (TCFA) (⿿15.14 ± 52.2; P = .001). The PIT was the most likely of all nonthin cap fibroatheroma plaque types to transform into TCFA at follow-up (11% of all TCFA found during follow-up and 35.9% of newly-developed TCFA), but showed (together with fibrous plaque) the lowest stability during lipid-lowering therapy (24.7% of PIT remained PIT and 24.5% of fibrous plaque remained fibrous plaque).
ConclusionsOver the 1-year follow-up, PIT was the most dynamic of the plaque phenotypes and was associated with an increase of risk score and LAPS (together with fibrous plaque), NC percentage (together with fibrous plaque) and NC abutting to the lumen, despite a small reduction of plaque volume during lipid-lowering therapy. The PIT was the main source for new TCFA segments.
Keywords
Recent work suggests coronary artery plaque composition may predict future clinical events.1 Intravascular ultrasound-based virtual histology (IVUS-VH) can assess plaque composition by processing a raw radiofrequency signal from intravascular ultrasound (IVUS). IVUS-VH has exhibited > 90% correlation with conventional histology.2 Using IVUS-VH image data, 6 types of plaque phenotypes can be determined. They correspond to the descriptions of the American Heart Association's Committee on Vascular Lesions.3 Much of the work in this area has focused on fibroatheromas (thin cap fibroatheromas [TCFA] and thick cap fibroatheromas [ThCFA]), as risk factors for future cardiac events, with TCFA established as the highest-risk lesion for the development of acute coronary syndromes.4 Other plaque phenotypes have been considered stable lesions.1,5 Further studies suggest that 1 type of stable plaque phenotype, pathologic intimal thickening (PIT), may serve as a precursor to fibroatheromas.6,7
We sought to investigate the dynamic properties of various plaque phenotypes⿿in patients with stable coronary artery disease treated by lipid-lowering therapy⿿by using an established 3-dimensional (3D) angiography-fusion IVUS-VH imaging protocol in baseline and follow-up studies.
METHODSStudy Population, Angiographic Protocol and Intravascular Ultrasound ImagingFrom a database of 89 serial IVUS-VH studies of patients who underwent elective coronary angiography for stable coronary artery disease and were analyzed in the HEAVEN trial8 (a multicenter, randomized trial comparing routine statin therapy vs aggressive treatment: atorvastatin 80mg plus ezetimibe 10mg per day), we analyzed 61 baseline and follow-up data sets that met the following criteria: a) IVUS-VH of a native coronary artery with stenosis 50% of lumen diameter determined by angiography, with no indication for either percutaneous coronary intervention or coronary artery bypass grafting at the time of initial imaging; b) good-quality baseline and follow-up IVUS-VH pullbacks (ie, without noticeable pullback speed discontinuity); c) imaged vessels free of severe calcification to avoid inconsistency of IVUS-VH plaque type determination in areas of acoustic shadowing, and d) both baseline and follow-up pullbacks at least 30-mm long, with at least 25-mm long overlap after registration in 1 coronary artery.
One segment from each patient was chosen for the study. In case of multiple lesions, a lesion located in a more proximal location, or (in case of similar locations) a lesion with a higher plaque burden was chosen for the analysis.
From 89 patients included in the HEAVEN trial, we used 61 patients. Examinations from 15 patients had an overlap between baseline and follow-up of < 25 mm, angiography of 8 participants were not suitable for 3D reconstruction and in 5 patients either the baseline or follow-up IVUS examinations were noncontinual.
All participants provided informed consent. The study was approved by the institutional review boards of Charles University in Prague.
Creation of 3D Models, Coregistration and Intravascular Ultrasound AnalysisThe IVUS-VH was performed using an IVUS phased-array probe (Eagle Eye 20MHz 2,9 Fr, Volcano Corporation; Rancho Cordova, California, United States), IVUS console, Gold standard software, with automatic pullback at 0.5mm/s (research pullback, model R-l00, Volcano Corporation). After administration of 200μg of intracoronary nitroglycerin, the IVUS catheter was inserted into the target vessel beyond a distal fiduciary point and was then pulled back to the aorto-ostial junction. The proximal fiduciary point was the left main bifurcation in the left coronary artery, and the first branch or a well-defined calcification in the right coronary artery. After 8-14 (mean, 12 ± 2.1) months, patients underwent repeat angiography with IVUS-VH of the same coronary artery.
We used geometrically correct fully 3D vessel reconstruction to ensure precise alignment of baseline and follow-up measurements in this study.
Original IVUS pullback image data were transferred to the Iowa Institute for Biomedical Imaging. For each frame of all IVUS pullbacks, luminal and external elastic membrane surfaces were automatically segmented using fully a 3D LOGISMOS graph-based approach.9 Automatically determined borders were reviewed and algorithmically refined by an expert reader (T. Kovarnik) using an operator-guided computer-aided interface.10 Vessel and lumen surfaces/contours served as the input for off-line virtual histology computation using Volcano's research software, which allows IVUS-VH computations based on user-supplied segmentation of lumen and external elastic membrane. A geometrically correct fully 3D representation of the vascular wall surfaces and IVUS-VH defined tissue characterization was obtained via fusion of angiography and IVUS-VH.11 This 3D model served as a basis for quantitative morphologic analyses and quantitative assessment of plaque composition in every frame of the imaged vessel.12 Vessel models were created for both the baseline and follow-up image pullbacks. After identification of corresponding vascular landmarks in the 3D vessel models, the patient specific model pairs were coregistered by a 3D graph-based optimization technique13 to correctly match pullbacks. Frame-based indices of plaque morphology and virtual histology were computed and averaged in 5mm baseline/follow-up registered vessel segments.
Morphologic indices included external elastic membrane cross-sectional area, lumen cross-sectional area, plaque burden (external elastic membrane cross-sectional area ⿿ lumen cross-sectional area / external elastic membrane cross-sectional area), eccentricity (maximum plaque thickness ⿿ minimum plaque thickness / maximum plaque thickness).14,15
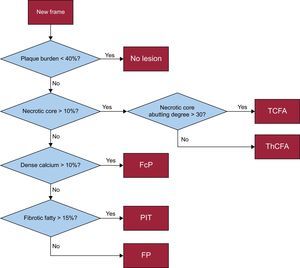
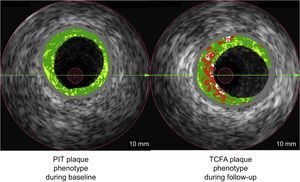
Plaque Phenotype DefinitionsThe IVUS-VH classifies plaque as follows: fibrous, fibro-fatty, dense calcification, and necrotic core (NC). Using IVUS-VH, each 5-mm vessel segment was classified into 1 of 6 categories1,2 (Figure 1):
- 1.
No lesion: plaque burden < 40%.
- 2.
PIT.
- 3.
Fibrous plaque.
- 4.
Fibrocalcified plaque.
- 5.
ThCFA.
- 6.
TCFA.

For determination of the TCFA category, 3 consecutive frames were analyzed. Assigning 1 of the 6 phenotype category labels to each 5-mm segment was based on the morphologic analysis of each frame within the 5-mm segment⿿the segment-specific category for each 5-mm segment resulted from the most severe frame-category type within the segment.
We developed a plaque risk score based on plaque phenotype in individual IVUS frames by assigning the following weights: TCFA (5 points), ThCFA (4 points), fibrocalcified plaque (3 points), fibrous plaque (2 points), PIT (1 point), no lesion (0 point). A risk score was calculated for all frames and the highest score within each 5-mm segment determined the risk score for that segment. We also used the Liverpool Active Plaque Score (LAPS). We used the formula: ⿿2.149 + 0.68 ÿ NC / dense calcification + 3.39 ÿ minimal lumen area < 4mm2 + 5.1 (if the remodeling index was > 1.05) + 3.7 ÿ TCFA based on a study done by Murray et al.16
Statistical AnalysisNumerical variables are described as mean values ± standard deviations or median [interquartile range] as appropriate. Counts and percentages are used to present categorical variables. Mixed-effect-analysis of variance with ⿿patient⿿ as random effect was used to correct the clustering of multiple 5-mm segments within patients for continuous morphological comparison such as plaque area change. For categorical variables, contingency tables were used to display frequency distributions. Statistical significance was calculated by Fisher's exact test. R environment was employed for statistical computing. A P value of .05 denoted the threshold of statistical significance.
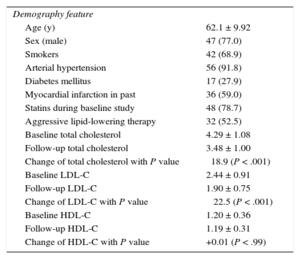
RESULTSBaseline DemographicsDemographic findings of the 61 patients are displayed in Table 1. The cohort was 77% male, with a mean age of 62.1 ± 9.9 years. Total cholesterol and low density lipoprotein cholesterol decreased significantly during the course of the study, despite 78.7% of patients having had prior statin therapy. The coronary arteries were as follows: left anterior descending artery 26 (42.6%), left circumflex artery 8 (13.1%), right coronary artery 27 (44.3%).
Demographics at Baseline (n = 61)
| Demography feature | |
| Age (y) | 62.1 ± 9.92 |
| Sex (male) | 47 (77.0) |
| Smokers | 42 (68.9) |
| Arterial hypertension | 56 (91.8) |
| Diabetes mellitus | 17 (27.9) |
| Myocardial infarction in past | 36 (59.0) |
| Statins during baseline study | 48 (78.7) |
| Aggressive lipid-lowering therapy | 32 (52.5) |
| Baseline total cholesterol | 4.29 ± 1.08 |
| Follow-up total cholesterol | 3.48 ± 1.00 |
| Change of total cholesterol with P value | ⿿18.9 (P < .001) |
| Baseline LDL-C | 2.44 ± 0.91 |
| Follow-up LDL-C | 1.90 ± 0.75 |
| Change of LDL-C with P value | ⿿ 22.5 (P < .001) |
| Baseline HDL-C | 1.20 ± 0.36 |
| Follow-up HDL-C | 1.19 ± 0.31 |
| Change of HDL-C with P value | +0.01 (P < .99) |
HDL-C, high-density lipoprotein cholesterol; LDL-C, low-density lipoprotein cholesterol.
Unit for lipid levels is mmol/L (multiplied by 38.67 to convert mg/dL).
Data are expressed as No. (%) or mean ± standard deviation.
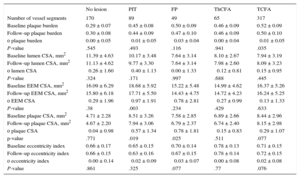
From 61 patients, 693 5-mm long vessel segments were analyzed, with TCFA being the most common phenotype (317 segments, 45.7%), followed by no lesion (170 segments, 24.5%), PIT (89 segments, 12.8%), ThCFA (65 segments, 9.4%), fibrous plaque (49 segments, 7.1%), with very few fibrocalcified plaque (3 segments, 0.4%). Fibrocalcified plaque was not included in most of the analyses, due to its low occurrence. With regard to gray-scale IVUS findings, all groups, except the no lesion group (defined as plaque burden < 40%), had moderate atherosclerotic burden with a baseline plaque burden of 45% to 52% (this difference was nonsignificant across five lesion types). The PIT, fibrous plaque and TCFA plaque phenotypes demonstrated a small decrease of plaque burden at follow-up that was significant in the TCFA group (Table 2), and these groups, together with the no lesion and ThCFA groups, demonstrated a small decrease of plaque in a cross-section area at follow-up that was significant in PIT and fibrous plaque groups (Table 2). The PIT segments exhibited the greatest amount of negative remodeling with a change in the external elastic membrane in a cross-sectional area of ⿿0.97mm2 ± 1.9 (P = .003).
Morphological Changes in All Plaque Phenotypes
| No lesion | PIT | FP | ThCFA | TCFA | |
|---|---|---|---|---|---|
| Number of vessel segments | 170 | 89 | 49 | 65 | 317 |
| Baseline plaque burden | 0.29 ± 0.07 | 0.45 ± 0.08 | 0.50 ± 0.09 | 0.46 ± 0.09 | 0.52 ± 0.09 |
| Follow-up plaque burden | 0.30 ± 0.08 | 0.44 ± 0.09 | 0.47 ± 0.10 | 0.46 ± 0.09 | 0.50 ± 0.10 |
| ο plaque burden | 0.00 ± 0.05 | ⿿0.01 ± 0.05 | ⿿0.03 ± 0.04 | 0.00 ± 0.04 | ⿿0.01 ± 0.05 |
| P-value | .545 | .493 | .116 | .941 | .035 |
| Baseline lumen CSA, mm2 | 11.39 ± 4.63 | 10.17 ± 3.48 | 7.64 ± 3.14 | 8.10 ± 2.67 | 7.94 ± 3.19 |
| Follow-up lumen CSA, mm2 | 11.13 ± 4.62 | 9.77 ± 3.30 | 7.64 ± 3.14 | 7.98 ± 2.60 | 8.09 ± 3.23 |
| ο lumen CSA | ⿿0.26 ± 1.60 | ⿿0.40 ± 1.13 | 0.00 ± 1.33 | ⿿0.12 ± 0.81 | 0.15 ± 0.95 |
| P-value | .324 | .171 | .997 | .688 | .445 |
| Baseline EEM CSA, mm2 | 16.09 ± 6.29 | 18.68 ± 5.92 | 15.22 ± 5.48 | 14.99 ± 4.62 | 16.37 ± 5.26 |
| Follow-up EEM CSA, mm2 | 15.80 ± 6.18 | 17.71 ± 5.50 | 14.43 ± 4.75 | 14.72 ± 4.23 | 16.24 ± 5.25 |
| ο EEM CSA | ⿿0.29 ± 1.96 | ⿿0.97 ± 1.91 | ⿿0.78 ± 2.81 | ⿿0.27 ± 0.99 | ⿿0.13 ± 1.33 |
| P-value | .38 | .003 | .234 | .429 | .633 |
| Baseline plaque CSA, mm2 | 4.71 ± 2.28 | 8.51 ± 3.26 | 7.58 ± 2.85 | 6.89 ± 2.66 | 8.44 ± 2.96 |
| Follow-up plaque CSA, mm2 | 4.67 ± 2.20 | 7.94 ± 3.06 | 6.79 ± 2.37 | 6.74 ± 2.40 | 8.15 ± 2.98 |
| ο plaque CSA | ⿿0.04 ± 0.98 | ⿿0.57 ± 1.34 | ⿿0.78 ± 1.81 | ⿿0.15 ± 0.83 | ⿿0.29 ± 1.07 |
| p-value | .771 | .019 | .025 | .511 | .077 |
| Baseline eccentricity index | 0.66 ± 0.17 | 0.65 ± 0.15 | 0.70 ± 0.14 | 0.78 ± 0.13 | 0.71 ± 0.15 |
| Follow-up eccentricity index | 0.66 ± 0.15 | 0.63 ± 0.16 | 0.67 ± 0.15 | 0.78 ± 0.14 | 0.72 ± 0.15 |
| ο eccentricity index | ⿿0.00 ± 0.14 | ⿿0.02 ± 0.09 | ⿿0.03 ± 0.07 | 0.00 ± 0.08 | 0.02 ± 0.08 |
| P-value | .861 | .325 | .077 | .77 | .076 |
ο, change; CSA, cross-sectional area; EEM, external elastic membrane; FP, fibrous plaque; PIT, pathologic intimal thickening; TCFA, thin cap fibroatheroma; ThCFA, thick cap fibroatheroma.
Unless otherwise indicated, data are expressed as mean ± standard deviation.
The PIT plaque phenotype exhibited the highest increase in risk score. The changes of risk score were as follows: PIT, 2.2 ± 1.7 (P < .001); fibrous plaque, 1.7 ± 1.5 (P < .001); no lesion, 0.7 ± 1.5 (P < .001); ThCFA -0.1 ± 1.4 (P = .58), and TCFA, ⿿0.5 ± 1.1 (P = .0001).
The LAPS and its change over the course of the study are displayed in Table 3. The LAPS significantly increased in fibrous plaque (0.9), PIT (0.7) and ThCFA (0.5) plaque phenotypes and significantly decreased in TCFA plaque phenotype (⿿0.6).
Changes of Liverpool Active Plaque Score
| No. of chunks | LAPS + | LAPS = | LAPS ⿿ | Baseline LAPS | Follow-up LAPS | ο LAPS | P-value | |
|---|---|---|---|---|---|---|---|---|
| No lesion | 170 | 68 (40.0) | 24 (14.1) | 78 (45.9) | ⿿1.6 ± 0.6 | ⿿1.6 ± 1.0 | 0.0 ± 1.1 | .584 |
| PIT | 89 | 60 (67.4) | 1 (1.1) | 28 (31.5) | ⿿1.5 ± 0.6 | ⿿0.8 ± 1.3 | 0.7 ± 1.3 | .0001 |
| FP | 49 | 33 (67.3) | 0 (0.0) | 16 (32.7) | ⿿1.5 ± 0.6 | ⿿0.6 ± 1.4 | 0.9 ± 1.6 | .0001 |
| ThCFA | 65 | 38 (58.5) | 0 (0.0) | 27 (41.5) | ⿿1.2 ± 0.8 | ⿿0.7 ± 1.8 | 0.5 ± 1.5 | .041 |
| TCFA | 317 | 107 (33.8) | 0 (0.0) | 210 (66.2) | 0.7 ± 1.6 | 0.1 ± 1.7 | ⿿0.6 ± 1.6 | .001 |
ο, change; PIT, pathologic intimal thickening; FP, fibrous plaque; LAPS, Liverpool Active Plaque Score; ThCFA, thick cap fibroatheroma; TCFA, thin cap fibroatheroma.
Increasing (+), nonchanging (=), and decreasing (⿿) observation values at follow-up compared with baseline.
Unless otherwise indicated, data are expressed as No. (%) or mean ± standard deviation.
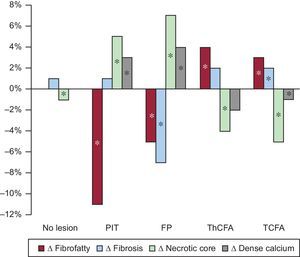
Figure 2 shows the changes of relative plaque composition. Only PIT and fibrous plaque showed an increase of necrotic and calcified tissue. Fibroatheromas (TCFA and ThCFA) showed the opposite changes of plaque composition.

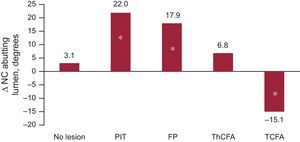
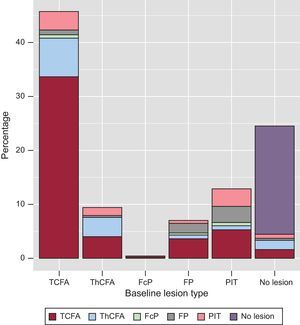
Changes in the NC angle abutting the lumen are shown in Figure 3. The PIT was the plaque phenotype with the highest increase of this most dangerous location of NC. Figure 4 provides a graphic depiction of plaque phenotype transitions between baseline and follow-up. Note that PIT at baseline is the main precursor of newly developed TCFA phenotype at follow-up.

 between baseline and follow-up time points (plaque phenotypes are color-coded). FcP, fibro-calcified plaque; FP, fibrous plaque; PIT, pathologic intimal thickening; TCFA, thin cap fibroatheroma; ThCFA, thick cap fibroatheroma.")
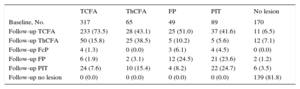
Plaque transition during lipid-lowering therapy is summarized in Figure 5 and Table 4. The main source of new TCFA was the PIT plaque phenotype. Of 336 TCFA chunks identified at follow-up, 233 (69.3%) chunks evolved from baseline TCFA; 37 (11.0%) from baseline PIT; 28 (8.3%) from ThCFA; 25 (7.4%) from fibrous plaque; 11 (3.3%) from no lesion, and 2 (0.6%) from baseline fibrocalcified plaque.

Plaque Phenotype Transition During Study
| TCFA | ThCFA | FP | PIT | No lesion | |
|---|---|---|---|---|---|
| Baseline, No. | 317 | 65 | 49 | 89 | 170 |
| Follow-up TCFA | 233 (73.5) | 28 (43.1) | 25 (51.0) | 37 (41.6) | 11 (6.5) |
| Follow-up ThCFA | 50 (15.8) | 25 (38.5) | 5 (10.2) | 5 (5.6) | 12 (7.1) |
| Follow-up FcP | 4 (1.3) | 0 (0.0) | 3 (6.1) | 4 (4.5) | 0 (0.0) |
| Follow-up FP | 6 (1.9) | 2 (3.1) | 12 (24.5) | 21 (23.6) | 2 (1.2) |
| Follow-up PIT | 24 (7.6) | 10 (15.4) | 4 (8.2) | 22 (24.7) | 6 (3.5) |
| Follow-up no lesion | 0 (0.0) | 0 (0.0) | 0 (0.0) | 0 (0.0) | 139 (81.8) |
FcP, fibrocalcified plaque; FP, fibrous plaque; PIT, pathologic intimal thickening; TCFA, thin cap fibroatheroma; ThCFA, thick cap fibroatheroma.
Unless otherwise indicated, data are expressed as No. (%).
When we analyzed the relative quantity of plaque staying within the same phenotype during the study, the ⿿most conservative⿿ phenotype was no lesion (81.8%) followed by TCFA (73.5%), ThCFA (38.5%), PIT (24.7%) and fibrous plaque (24.5%).
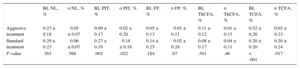
Transition of plaque phenotypes was also influenced by the type of lipid-lowering treatment (Table 5). Aggressive lipid-lowering treatment led to a small increase of PIT and TCFA plaque phenotypes whereas standard treatment led to a decrease of PIT and a higher increase of TCFA plaque phenotypes compared with aggressive treatment. These differences between treatment regimens were significant. Figure 5 summarizes the transition of plaque phenotypes transition. In each instance, PIT changed into a plaque phenotype with a higher risk profile (mainly TCFA), proving that a PIT decrease is a marker of atherosclerosis progression.
Changes of Plaque Phenotypes According to Type of Lipid-lowering Treatment
| BL NL, % | ο NL, % | BL PIT, % | ο PIT, % | BL FP, % | ο FP, % | BL ThCFA, % | ο ThCFA, % | BL TCFA, % | ο TCFA, % | |
|---|---|---|---|---|---|---|---|---|---|---|
| Aggresive treatment | 0.23 ± 0.18 | ⿿0.05 ± 0.07 | 0.09 ± 0.17 | 0.02 ± 0.20 | 0.05 ± 0.13 | ⿿0.01 ± 0.11 | 0.11 ± 0.12 | 0.01 ± 0.13 | 0.52 ± 0.26 | 0.02 ± 0.23 |
| Standard treatment | 0.29 ± 0.23 | ⿿0.06 ± 0.07 | 0.27 ± 0.19 | ⿿0.18 ± 0.18 | 0.14 ± 0.25 | ⿿0.02 ± 0.28 | 0.08 ± 0.17 | 0.04 ± 0.11 | 0.20 ± 0.20 | 0.20 ± 0.24 |
| P-value | .363 | .568 | .002 | .022 | .184 | .87 | .581 | .46 | < .001 | .017 |
ο, change; BL, baseline; FP, fibrous plaque; NL, no lesion; PIT, pathologic intimal thickening; TCFA, thin cap fibroatheroma; ThCFA, thick cap fibroatheroma.
Unless otherwise indicated, data are expressed as mean ± standard deviation.
The focus on TCFA as a high-risk lesion phenotype has resulted in a paucity of investigations on the fate and natural history of other nonfibroatheroma lesion types. We sought to better understand the natural history of these nonfibroatheroma lesion types. Our approach offers the first study analyzing changes of plaque phenotypes using this advanced fusion-based methodology, incorporating segmental analysis rather than a frame-based analysis, which has been used in previous studies. The main findings of this study are as follows:
-
The PIT plaque phenotype showed the highest increase of risk score and LAPS (together with fibrous plaque), despite a small (but significant) decrease of plaque volume during lipid-lowering therapy for both PIT and fibrous plaque.
-
This increase of NC was highest in the fibrous plaque and PIT plaque phenotypes. An increase in NC abutting to the lumen (the most dangerous location) was found predominantly in PIT.
-
Most new fibroatheromas originated from PIT (11% from all TCFA found in follow-up and 35.9% from newly developed TCFA).
-
A number of 5-mm vessel segments with unchanged plaque phenotype were the lowest in the PIT and fibrous plaque groups.
These findings prove PIT as a plaque with the highest activity. The significant increase of risk scores and LAPS, and the increase of NC (relative content and angle abutting to the lumen) in the PIT plaque phenotype occurred despite lipid-lowering therapy. These increases were observed despite small a decrease in plaque volume in the PIT plaque phenotype.
The PIT plaque phenotype was the main precursor of the new TCFA. Not only was the PIT to TCFA transition observed more frequently than any other PIT transition, but of all new TCFA plaques identified at follow-up, PIT is the most frequent plaque type source.
Similar changes were found in the fibrous plaque phenotype, which, however, showed a smaller increase of NC abutting to the lumen and transition to the TCFA plaque phenotype.
The finding that PIT plaque phenotype continues to progress into more advanced plaque types, despite small decreases of plaque volume during aggressive lipid-lowering therapy, is alarming. We have found this phenomenon in patients who have been treated with therapy that successfully lowered levels of both total cholesterol and low density lipoprotein cholesterol. These findings differ from a study reported by Kubo et al.,5 who described PIT and fibrous plaque as nontransitioning and remaining as PIT in more than 70% of cases and as fibrous plaque in more than 80% of cases. However, they reported the most significant increase of plaque area, and decrease of lumen area, together with most significant increases of NC in PIT phenotypes. They concluded that PIT was the most active plaque phenotype in terms of plaque volume and plaque composition, a finding⿿at least related to plaque composition⿿that is similar to ours but differs in regard to the direction of plaque burden changes. Nozue et al.17 have described a relative decrease in PIT as a result of statin therapy. In their study, the relative loss of PIT was more frequent in patients with acute coronary syndrome than in stable patients. It was also more frequent in patients treated with pitavastatin rather than with pravastatin. These authors have described a relative decrease of PIT plaques together with a relative increase of TCFA and calcified TCFA. Fibrous plaque was found as stable plaque phenotypes in their study.
In contrast, studies published by Corban et al.6 and Puri et al.7 report findings similar to ours. They note that PIT most likely changed phenotype. Only 9% of PIT remained as PIT during their 6-month study. The PIT phenotype was associated with a greater NC and dense calcification progression and was more likely to transform into fibroatheroma than to other plaque phenotypes. These findings are similar to ours with 1 exception. We found the highest increase of NC in the fibrous plaque phenotype. However, in the study by Puri et al.,7 56% of PIT remained unchanged at 24 months follow-up. They described PIT as a transitioning plaque phenotype that contributes significantly to high-intensity statin-mediated coronary atheroma regression. While we also found a small regression of plaque volume in the PIT group, the plaque risk profile of our participants continued to progress despite the use of lipid-lowering therapy.
The explanation for increases in NC despite a small plaque reduction may possibly be found in animal trials. Atherosclerotic plaques that developed during a high-cholesterol diet stayed at the same volume during a subsequent low-cholesterol diet but decreased in macrophages and increased in the number of smooth muscle cells after cessation of a proatheroslerotic diet. This was considered a favorable result.18 It can, however, also be speculated that macrophages that converted to foam cells showed cell necrosis and started to form an NC. Lipid-lowering therapy may decrease plaque volume while not affecting the formation of an NC. The PIT plaque phenotype is composed mainly of fibrous and fibro-fatty tissue. This type of plaque is histologically composed of fibrous tissue surrounded by foam cells or macrophages without NC.19 Our earlier study HEAVEN8 showed that statin therapy failed to stop undesirable changes of plaque composition and that fibrous and fibro-fatty tissue was converted to NC with calcification. This observation was also found in other trials (TRUTH,20 VENUS,21 SATURN VH substudy7). Another small study by Eshtehardi et al.22 focused on plaque composition and changes of plaque phenotypes. In 20 patients treated with 80mg of atorvastatin, they found a decrease of relative representation of fibrous and fibro-fatty tissue, increase of NC and calcification together with translation of PIT into fibroatheromas.
In contrast, some trials using IVUS-VH have described a decrease of relative representation of NC during lipid-lowering therapy,23,24 not observed in our study. One possible explanation for this discrepancy could be the phenomenon of plaque-phenotype-specific directions of NC changes. We have shown that NC increased in PIT and fibrous plaque and decreased in fibroatheromas. This different behavior of necrotic tissue was also found in a study by Hwang et al.25 They studied 54 postacute coronary syndrome patients. Patients were treated with statins for 6 months and the authors found a significant reduction of NC in TCFA-type plaque but not in non-TCFA plaques. Only a limited number of trials have analyzed changes of plaque composition in different plaque types separately. For this reason, there is not enough conclusive data, but it is plausible that in a study with a higher number of TCFA lesions, a decrease of necrotic tissue could be found following statin therapy. In contrast, trials with higher numbers of earlier stages of atherosclerotic plaques reported an increase of NC. The explanation of benefit from statin therapy in both primary and secondary prevention of coronary artery disease remains a subject of debate. Based on current knowledge, it seems to be confirmed that statins cause a limited degree of plaque regression. These drugs can initiate a decrease of NC in more advanced plaque phenotypes (fibroatheromas) but do not stop progression of NC in early stages of atherosclerosis. It can be speculated that one of the main positive effects of statin therapy is an increase of fibrous cap thickness that has been found in a study using optical coherence tomography.26
LimitationsThe main limitation of our study is the small number of fully suitable patients from our cohort of 89 patients, as only 61 fulfilled the criteria needed for serial 3D analysis. We tried to overcome this limitation by using advanced fusion-based methodology⿿incorporating segmental analysis rather than the frame-based analysis, which has been used in previous studies. This methodology allowed us to separately analyze behavior of 693 5-mm long vessel segments. A further limitation is the use of patients treated by a standard and aggressive type of lipid-lowering therapy as one group. We decided not to lose statistical power for comparisons between 5 types of plaque phenotypes in 2 groups of participants. Furthermore, this patient cohort reflects the real situation in clinical practice, where part of the patients is treated ⿿conservatively⿿ and another part with a more aggressive type of lipid-lowering therapy. Another limitation is slightly different times of follow-up across the cohort (8-14 months), which is, however, similar to other baseline-to-follow-up studies.
Another limitation is the exclusion of heavily calcified plaques from the analysis. Calcium causes acoustic shadow, where IVUS-VH analysis loses its accuracy and cannot be used for assessment of plaque composition.
CONCLUSIONSIn a study analyzing multiple adjacent 5-mm long vessel segments with coregistered baseline and follow-up angiography/IVUS-VH fusion image data and 3D vessel reconstruction, we were able to uniquely analyze longer vessel segments than by using a per-frame based technique, resulting in examination of more representative vessel segments and a more comprehensive quantitative analysis. With this approach, we report that PIT was observed as the most active plaque phenotype in terms of progression of plaque instability. These changes were found despite lipid-lowering therapy that simultaneously yielded low levels of low-density lipoprotein cholesterol and a small, but significant, decrease of plaque volume. The relative amount of NC increased in less-advanced plaque phenotypes (PIT and fibrous plaque) and decreased in more-advanced ones (fibroatheromas).
FUNDINGThis study was supported, in part, by an internal grant from the Internal Grant Agency of Ministry of Health, Czech Republic, IGA NT13224-4/2012, NIH (National Institutes of Health) grants R01 EB004640 and R01 HL063373, and the National Natural Science Foundation of China 81501545.
CONFLICTS OF INTERESTNone declared.
- -
The PIT has been shown to be a ⿿protective plaque phenotype⿿ with a negative relationship to cardiac events in the PROSPECT trial. This finding was supported by a study by Kubo et al.,5 which described PIT as a stable plaque phenotype that remained fundamentally unchanged in 70% of examples found during a baseline examination.
- -
In contrast, other studies found PIT to be a very active plaque phenotype.
- -
Our aim was to add more data to describe the behavior of PIT during lipid-lowering therapy.
- -
We identified the PIT plaque phenotype as a very active type of plaque, with the highest increase of our novel risk score and of the Liverpool risk score (where a similar result was found for fibrous plaque), an increase of plaque volume, and with increases in the most dangerous plaque composition: NC abutting to the lumen.
- -
Moreover, PIT was a major source of new fibroatheromas, and the number of 5-mm vessel segments with unchanged plaque phenotype was smallest in the PIT and fibrous plaque groups.
- -
These PIT changes occurred despite a significant decrease in plaque volume and a significant reduction of low-density lipoprotein cholesterol levels during aggressive lipid-lowering therapy.