Obesity, and especially morbid obesity, increases the risk of cardiovascular as well as non-cardiovascular diseases. Our objective was to ascertain the trends in morbid obesity in Spain from 1993 to 2006 using representative data from 106,048 participants in the National Health Surveys. An age-adjusted Poisson regression model stratified by sex was fitted using morbid obesity as the dependent variable.
An increasing trend in prevalent morbid obesity from 1.8 to 6.1 per thousand participants was found (increase>200%). Morbid obesity prevalence was higher in women. After adjusting for age, a monotonically increasing prevalence of morbid obesity was apparent for both men and women: the relative increase was 4% per year in women and 12% per year in men. These trends highlight the importance of preventive actions.
Keywords
Obesity (body mass index [BMI] ≥30) is associated with an increased risk of suffering various diseases, including cardiovascular disease. The incidence of cardiovascular disease, diabetes mellitus, high blood pressure and mortality is even higher in those with a BMI of ≥40 (morbid obesity).1 The prevalence of obesity has been increasing in Spain in recent years,2, 3 but the trend for morbid obesity is less well understood. Studies performed in other countries show a growing trend in the prevalence of this problem; indeed, the prevalence of morbid obesity has been growing faster than less serious forms of obesity.4 Patients with heart disease are no exception; the EUROASPIRE study has reported a growing prevalence of obesity among patients with ischemic heart disease in recent years.5
The aim of the present work was to examine the trend of morbid obesity in Spain over the last 14 years using data from repeated cross sectional surveys using the same methodology.
MethodsData were taken from the Encuesta Nacional de Salud or (National Health Survey [NHS]), a cross-sectional study of non-institutionalized adults (ie, people over 16 years of age) representative of the Spanish population. Full details of the NHS are reported elsewhere.2 Self-declared body weight and height data were taken for 1993 (n=21,061), 1995 (n=6,396), 1997 (n=6,396), 2001 (n=21,067), 2003 (n=21,650) and 2006 (n=29,478). All data had been previously validated.6 The mean age of the NHS participants was 44.9±18.7 years; 51.4% of participants were women. The BMI was calculated as body weight (in kilos) / height in meters2. Obesity was defined as a BMI of ≥30, morbid obesity as a BMI of ≥40.
Prevalence estimates were calculated. For the study of disease prevalence trends over time, Poisson regression models were constructed using robust estimates of standard error. Morbid obesity was the independent variable, survey year the dependent variable. Prevalence was calculated per year adjusting for age and sex.
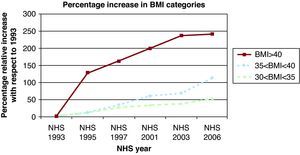
ResultsThe prevalence of obesity (BMI ≥30) rose from 9.1% in 1993 to 15% in 2006, an increase of 65%. Table 1 shows the proportion of men and women and the distribution of BMI by sex and age. The relative increase in more serious obesity was even larger (Figure 1). From 1993 to 2006, the prevalence of morbid obesity increased by more than 200% (from 1.8 to 6.1/1,000 people). In addition, in 1993, 7.7% of Spanish adults had a BMI of ≥30 but <35, while in 2006 this figure had risen to 11.9%, an increase of 54%.
Table 1. Description of the National Health Survey Population Studied.
| Men | Women | |
| Total | 48.6 | 51.4 |
| NHS 1993 (n=21,061) | 48.3 | 51.7 |
| NHS 1995 (n=6396) | 48.3 | 51.7 |
| NHS 1997 (n=6396) | 48.5 | 51.5 |
| NHS 2001 (n=21,067) | 48.3 | 51.7 |
| NHS 2003 (n=21,650) | 48.8 | 51.2 |
| NHS 2006 (n=29,478) | 49.1 | 50.9 |
| BMI by age | ||
| 16-26 years | 23.6±3.2 | 21.8±3.3 |
| 27-36 years | 25.5±3.4 | 23.4±3.9 |
| 37-48 years | 26.5±3.5 | 24.9±4.3 |
| 49-63 years | 27.1±3.7 | 26.8±4.6 |
| >64 years | 26.9±3.6 | 27.1±4.4 |
BMI, body mass index; NHS, National Health Survey.
Data are percentages or means±standard deviation.

Figure 1. Relative increase (%) in prevalence of the different body mass index categories between 1993 and 2006, according to National Health Survey data (raw). BMI, body mass index; NHS, National Health Survey.
Poisson regression using the survey year as the continuous variable and adjusting for age and sex showed an increasing trend for the prevalence of morbid obesity.
The adjusted prevalence ratio per calendar year was 1.07 (95% confidence interval [CI] 1.04-1.09) (Table 2), ie, prevalence increased in real terms at a rate of 7% per year. When examining this increase by sex, the prevalence ratio was 1.04 (95% CI 1.02-1.07) in women and 1.12 (95% CI 1.07-1.18) in men; the interaction survey year x sex was significant (P=.006). When adjusting the Poisson regression model to assess prevalence by sex, morbid obesity was found to be more prevalent among women (1.72, 95% CI 1.33-2.24). In 1993 the prevalence ratio (women/men) was 3.12 (95% CI 1.44-6.78) and in 2006 it was 1.24 (95% CI 0.8-1.91).
Table 2. Morbid Obesity Recorded by National Health Survey, by Year, With 1993 as Reference Data.
| 1993 | 1995 | 1997 | 2001 | 2003 | 2006 | For each year (continuous) a | |
| Total | |||||||
| Prevalence, ‰ | 1.8 | 4.1 | 4.7 | 5.3 | 6 | 6.1 | |
| Prevalence ratio b | 1 (ref.) | 2.29 (1.33-3.97) | 2.55 (1.51-4.3) | 2.81 (1.85-4.28) | 3.07 (2-4.73) | 3.1 (2.05-4.69) | 1.07 (1.04-1.09) |
| Women | |||||||
| Prevalence, ‰ | 2.7 | 5.8 | 8.2 | 7.9 | 8.2 | 6.8 | |
| Prevalence ratio c | 1 (ref.) | 2.11 (1.09-4.08) | 2.88 (1.59-5.21) | 2.68 (1.63-4.41) | 2.73 (1.65-4.52) | 2.24 (1.38-3.64) | 1.04 (1.02-1.07) |
| Men | |||||||
| Prevalence, ‰ | 0.9 | 2.5 | 1.4 | 2.8 | 3.7 | 5.4 | |
| Prevalence ratio c | 1 (ref.) | 2.87 (1.07-7.66) | 1.57 (0.49-5.09) | 3.13 (1.43-6.85) | 3.98 (1.76-8.97) | 5.7 (2.72-11.94) | 1.12 (1.07-1.18) |
| Age<50 years | |||||||
| Prevalence, ‰ | 1.2 | 2.8 | 3.3 | 3.4 | 4.2 | 4.4 | |
| Prevalence ratio d | 1 (ref.) | 2.3 (0.99-5.34) | 2.75 (1.23-6.14) | 2.81 (1.43-5.5) | 3.5 (1.73-7.06) | 3.61 (1.87-6.94) | 1.08 (1.04-1.12) |
| Age ≥50 years | |||||||
| Prevalence, ‰ | 3 | 6.7 | 7.2 | 8.7 | 8.8 | 9 | |
| Prevalence ratio d | 1 (ref.) | 2.26 (1.1-4.65) | 2.42 (1.21-4.82) | 2.87 (1.68-4.9) | 2.81 (1.65-4.8) | 2.97 (1.74-5.04) | 1.06 (1.03-1.09) |
a The survey year was used as the continuous variable (Poisson regression model).
b Adjusted for sex and age (95% confidence interval).
c Adjusted for age (95% confidence interval).
d Adjusted for sex (95% confidence interval).
Table 2 compares the years in terms of different categories, showing data for sex and age. Data for 1993 were taken as a reference.
DiscussionAccording to the examined NHS data, the prevalence of morbid obesity has increased by more than 200% between 1993 and 2006. Prevalence increased in both sexes, but more so in men, who are gradually catching up. Morbid obesity, which is associated with a number of complications1, has increased in prevalence more than other types of obesity since 1993. These findings agree with results from other developed countries4, 7 and with the results for patients with ischemic heart disease in the EUROASPIRE study5. Other studies have also reported a higher prevalence of morbid obesity among women.8 In the USA it is thought that between 1900 and 2000 the prevalence of morbid obesity was multiplied by a factor of 3 among men and 2.3 among women, with women still showing the greater prevalence.9
This important upward trend in the prevalence of morbid obesity in both sexes confirms this problem to be a major part of the obesity epidemic affecting Western countries.10 Small increments in BMI would produce larger effects at the extreme of the distribution. No such increment in morbid obesity would have been expected if it were a rare problem; in such a scenario its prevalence would not be much affected by behavioral changes in the population that impact upon the general prevalence of obesity.
Patients with morbid obesity may require bariatric surgery. The increase in the number of such surgeries performed11 is a good indication of the prevalence of morbid obesity.4, 8 However, the priority of public health systems should be the primary prevention of obesity in the population.
A possible limitation of this study is the use of self-declared information on body weight and height, which could lead to underestimation of the true prevalence of morbid obesity.6 However, this is unlikely to invalidate the study of the trend over time because the degree of underestimation would likely remain the same. More positively, the uniform methodology used in the different surveys, and the use of adjustments, allows for the better assessment of the trend in morbid obesity. Further, the large sample size affords greater statistical power to this study of a problem of relatively low prevalence in Spain.
In conclusion, an increase was seen in prevalence of obesity, and in particular morbid obesity, between 1993 and 2006 in Spain, both in men and women. This increase in obesity and morbid obesity, which is associated with greater morbidity and mortality, represents a great burden on the Spanish health system and is a public health problem that must be urgently tackled with effective preventive measures.
Conflicts of interestNone declared.
Received 11 May 2010
Accepted 29 June 2010
Corresponding author: Departamento de Medicina Preventiva, Edificio de Investigación, Universidad de Navarra, Irunlarrea 1, 31080 Pamplona, Navarra, Spain. mamartinez@unav.es