In Spain, various SCORE tables are available to estimate cardiovascular risk: tables for low-risk countries, tables calibrated for the Spanish population, and tables that include high-density lipoprotein values. The aim of this study is to assess the impact of using one or another SCORE table in clinical practice.
MethodsIn a cross-sectional study carried out in two primary health care centers, individuals aged 40 to 65 years in whom blood pressure and total cholesterol levels were recorded between March 2010 and March 2012 were selected. Patients with diabetes or a history of cardiovascular disease were excluded. Cardiovascular risk was calculated using SCORE for low-risk countries, SCORE with high-density lipoprotein cholesterol, and the calibrated SCORE.
ResultsCardiovascular risk was estimated in 3716 patients. The percentage of patients at high or very high risk was 1.24% with SCORE with high-density lipoprotein cholesterol, 4.73% with the low-risk SCORE, and 15.44% with the calibrated SCORE (P<.01). Treatment with lipid-lowering drugs would be recommended in 10.23% of patients using the calibrated SCORE, 3.12% of patients using the low-risk SCORE, and 0.67% of patients using SCORE with high-density lipoprotein cholesterol.
ConclusionsThe calibrated SCORE table classifies a larger number of patients at high or very high risk than the SCORE for low-risk countries or the SCORE with high-density lipoprotein cholesterol. Therefore, its use would imply treating more patients with lipid-lowering medication. Validation studies are needed to assess the most appropriate SCORE table for use in our setting.
Keywords
Cardiovascular risk establishes the likelihood of experiencing a cardiovascular event within a specific time period, generally 5 or 10 years. The term cardiovascular event refers to ischemic heart disease, cerebrovascular disease, and peripheral artery disease. Cardiovascular risk estimation is of considerable clinical interest because it enables more effective assessment of the need to start lipid-lowering treatment or antihypertensive therapy in patients who have not had a cardiovascular event; that is, for primary prevention.
The method classically used (and still in use) to calculate cardiovascular risk involves the estimations provided by the Framingham study.1,2 This is, without a doubt, the population study with the longest follow-up time and providing the most information on cardiovascular risk factors and their predictive role in coronary events. In Spain, the Framingham equations have undergone several calibrations, such as REGICOR,3 which was carried out with population data from Catalonia, and RICORNA,4 using population data from Navarre. In addition, the REGICOR tables have been validated with data from various health centers throughout Spain.5
Based on European cohort studies, SCORE project6 project was developed, from which tables were derived for high-risk and low-risk countries (among the latter, Spain) and tables were designed including total cholesterol (TC) and the ratio of TC to high-density lipoprotein cholesterol (HDL-C). The SCORE tables estimate the risk of cardiovascular death; that is, the 10-year probability of experiencing fatal coronary and noncoronary cardiovascular disease. The tables are easy to use and include very few parameters: age, sex, systolic blood pressure (SBP), TC, HDL-C, and smoking status. They do not include other variables, such as whether the patient is under treatment with antihypertensive medication or lipid-lowering drugs. A patient with a 10-year cardiovascular risk estimation of 5% or more is considered at high risk. Later on, the SCORE risk table calibrated for Spain was reported, which uses the mean risk factor levels by sex and 5-year age groups, and the specific cardiovascular mortality rates in Spain. The SCORE model calibrated for Spain was observed to produce risks that are 13% higher than the low-risk SCORE function.7 The European guidelines on cardiovascular disease prevention (version 2012)8 and the 2008 CEIPC Spanish adaptation9,10 recommend the SCORE table for risk calculation (in low-risk countries) using the TC value or the TC/HDL-C ratio. One important innovation in these new guidelines is inclusion of the concept of vascular age, which is closely related to cardiovascular risk, as a new tool to motivate patients to change their lifestyle. Recently, new SCORE tables have appeared, which enable risk calculation by direct use of the HDL-C value on the web site of the European Cardiology Society.11
One study by the SCORE project investigators analyzed the improvement in risk estimation that occurred when HDL-C was included as an isolated parameter, separate from the TC/HDL-C ratio.12 In the discriminant analysis, only a modest improvement was observed, according to the receiver operating characteristic curves. In the reclassification analysis, however, it was found that HDL-C was useful in women in high-risk countries and in individuals with very high or very low HDL-C levels.
The aim of the present study was to evaluate the impact on cardiovascular risk calculation using the calibrated Spanish tables and the new SCORE tables incorporating high-density lipoprotein cholesterol (SCORE-HDL) with respect to the SCORE tables for low-risk countries.
A secondary aim was to analyze the vascular age of the study population overall and by sex, and to assess the impact of risk factors on vascular age.
METHODSThis is a cross-sectional study using information from the databases of two primary care centers in the metropolitan area of Barcelona (Spain), which have a catchment population of 75 000 inhabitants. The two centers both use the same type of electronic medical record. We selected all men and women between 40 and 65 years of age for whom the results of at least one SBP and one TC study had been recorded between 1 March 2010 and 31 March 2012. We excluded subjects with a history of diabetes mellitus, acute myocardial infarction, ischemic heart disease, stroke, or peripheral artery disease.
For each subject, cardiovascular disease risk was estimated using the SCORE tables for low-risk countries, SCORE-HDL tables, and SCORE tables calibrated for the Spanish population. The classic risk function was calculated applying the original formula6 and using the STATA program (version 9.2). The formulas used to calculate the adjusted risk for HDL-C and calibrated risk for the Spanish population have not been reported; hence, this was done manually using the HeartScore® program from the European Society of Cardiology,11 consulted during the months of April and May, 2012. In the risk calculation, former smokers (nonsmokers of more than 1 year) and those for whom this information was missing were considered nonsmokers. The current HDL-C level had not been recorded in 26.4% of patients. Using the ICE multiple imputation procedure from the STATA program, 3 data sets were obtained with HDL-C values imputed from the information on age, sex, SBP, TC, smoking, and history of hypertension (HT) and hypercholesterolemia. The results of these data sets were combined following Rubin's rules. Analyses were carried out separately and in combination.13,14
Based on the risk estimates obtained with the 3 tables, we calculated the percentage of patients who met the therapeutic goals and were receiving lipid-lowering therapy. Following the recommendations of the European guidelines on cardiovascular disease prevention (version 2012),8 the therapeutic goals for low-density lipoprotein cholesterol (LDL-C) in patients with high and very high risk according to SCORE are as follows: for 5% to 9% risk, the recommended LDL-C level is lower than 100mg/dL, and for greater than or equal to 10% risk, the recommended level is lower than 70mg/dL. When LDL-C level was not available (30.9% of patients), TC levels were used, with the following therapeutic goals: lower than 175mg/dL for risk levels of 5% to 9% and lower than 150mg/dL for risk levels of greater than or equal to 10%.
Vascular age was calculated with the tables designed by Cuende et al.,15 using the SCORE table to estimate the associated risk at each age in nonsmoking individuals with a pre-established SBP value of 120 mmHg and a TC value of 190mg/dL (ie, “healthy individuals”). To estimate the vascular age of a patient, his or her cardiovascular risk is first calculated according to age, sex, presence of risk factors, and the SBP and TC values. The result obtained is then matched with the “healthy individual” with the closest cardiovascular risk within certain intervals (see tables developed by Cuende et al. Once the “healthy individual” is identified, the patient's vascular age corresponds to the age of the “healthy individual” with whom he or she has been matched.
In the comparison of the study variables between men and women, the Student t test for independent data was used for continuous variables and the chi-square test for categorical variables. The mean calculated risk values obtained with the different SCORE tables were compared using analysis of variance for repeated measures, whereas the percentages of high-risk patients were compared using symmetry and marginal homogeneity testing.
Multiple linear regression analysis was applied as a predictive model of vascular age, which was used as the dependent variable, and the variables for calculating cardiovascular risk were considered independent (smoking, SBP, TC). Two different models were developed, one for men and another for women.
In all cases, the bilateral value for statistical significance was set at P≤.05. All analyses were performed using STATA, version 9.2.
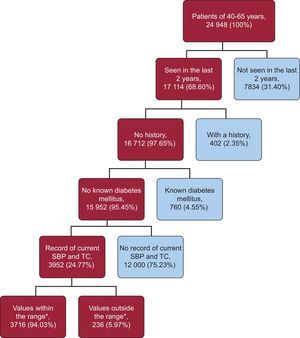
RESULTSAt the time of writing, 24 948 individuals aged 40 to 65 years were assigned to the 2 participating health centers (53.74% women) and 68.60% had come to the center for some reason at least once during the 2 years before the start of the study period. The mean age of the patients seen was 52.08 (7.59) years, and 55.78% were women. Furthermore, 97.65% (n=16 712) of these patients had no history of cardiovascular disease, and 95.45% (n=15 952) of that subgroup did not have known diabetes.
Calculation of cardiovascular risk was possible in only 24.77% of the candidate patients because in the previous 2 years, blood pressure had not been measured in 2572 patients, TC had not been analyzed in 1295 patients, and neither of these parameters had been recorded for 8133 patients.
Cardiovascular risk also could not be estimated in patients who had values outside the limits specified in the HeartScore® program of the European Society of Cardiology; that is, SBP values lower than 100 or greater than 180mmHg (163 patients), or TC values lower than 105 or greater than 305mg/dL (63 patients), or both these criteria (3 patients).
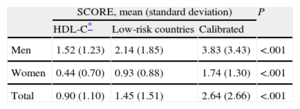
In 981 patients, HDL-C values were not available, and imputations were calculated according to the procedure described above. Ultimately, 3716 patients were candidates for the study, and their cardiovascular risk was estimated using the SCORE for low-risk countries, the calibrated SCORE, and the SCORE-HDL (Fig. 1). The general characteristics of the patients evaluated are described in Table 1. The comparison between mean results for the different SCORE tables is shown in Table 2. Significant differences were found: the calibrated SCORE showed the highest values and SCORE-HDL the lowest.

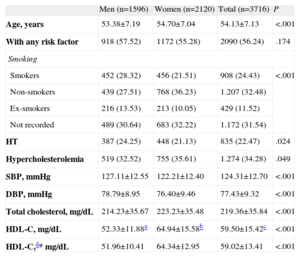
General Characteristics of the Patients Evaluated
| Men (n=1596) | Women (n=2120) | Total (n=3716) | P | |
| Age, years | 53.38±7.19 | 54.70±7.04 | 54.13±7.13 | <.001 |
| With any risk factor | 918 (57.52) | 1172 (55.28) | 2090 (56.24) | .174 |
| Smoking | ||||
| Smokers | 452 (28.32) | 456 (21.51) | 908 (24.43) | <.001 |
| Non-smokers | 439 (27.51) | 768 (36.23) | 1.207 (32.48) | |
| Ex-smokers | 216 (13.53) | 213 (10.05) | 429 (11.52) | |
| Not recorded | 489 (30.64) | 683 (32.22) | 1.172 (31.54) | |
| HT | 387 (24.25) | 448 (21.13) | 835 (22.47) | .024 |
| Hypercholesterolemia | 519 (32.52) | 755 (35.61) | 1.274 (34.28) | .049 |
| SBP, mmHg | 127.11±12.55 | 122.21±12.40 | 124.31±12.70 | <.001 |
| DBP, mmHg | 78.79±8.95 | 76.40±9.46 | 77.43±9.32 | <.001 |
| Total cholesterol, mg/dL | 214.23±35.67 | 223.23±35.48 | 219.36±35.84 | <.001 |
| HDL-C, mg/dL | 52.33±11.88a | 64.94±15.58b | 59.50±15.42c | <.001 |
| HDL-C,d* mg/dL | 51.96±10.41 | 64.34±12.95 | 59.02±13.41 | <.001 |
DBP, diastolic blood pressure; HDL-C, high-density lipoprotein cholesterol; HT, hypertension; SBP, systolic blood pressure.
Values are expressed as no. (%) or mean±standard deviation
Comparison of Mean Values Obtained Using the SCORE for Low-Risk Countries, SCORE Calibrated for Spain, and SCORE With High-density Lipoprotein Cholesterol
| SCORE, mean (standard deviation) | P | |||
| HDL-C* | Low-risk countries | Calibrated | ||
| Men | 1.52 (1.23) | 2.14 (1.85) | 3.83 (3.43) | <.001 |
| Women | 0.44 (0.70) | 0.93 (0.88) | 1.74 (1.30) | <.001 |
| Total | 0.90 (1.10) | 1.45 (1.51) | 2.64 (2.66) | <.001 |
HDL-C, high-density lipoprotein cholesterol
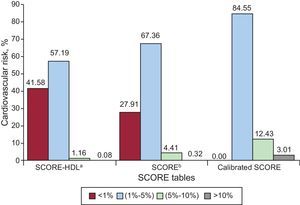
Risk estimation according to the different SCORE tables is shown in Figure 2. In general, most patients were categorized as not being at high risk, although there were differences according to the calculation method used (98.57% with SCORE-HDL, 95.27% with the SCORE for low-risk countries, and 84.55% with the calibrated SCORE). The distribution of patients into the various risk levels was significantly different depending on the method used (P<.001), such that the largest number of patients were classified as at high or very high risk using the calibrated SCORE, followed by the low-risk SCORE and SCORE-HDL.

Cardiovascular risk categories according to the various SCORE tables: SCORE for low-risk countries, SCORE calibrated for Spain, and SCORE with high-density lipoprotein cholesterol. SCORE-HDL: SCORE with high-density lipoprotein cholesterol.
aWith missing values imputed as described.
bCalculated by SCORE without rounding off decimals to nearest whole number.
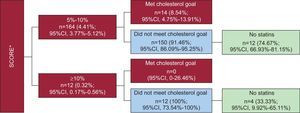
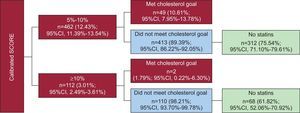
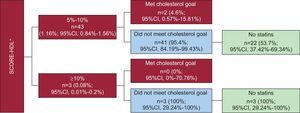
Figures 3–5 show the percentages of patients at high or very high risk according to the 3 scales, those who reached or did not reach the LDL-C therapeutic goals, and among the latter, how many were receiving statins treatment. Between 80% and 90% (depending on the table used) did not reach the LDL-C therapeutic goal, and in this group, between 75% and 80% were not receiving lipid-lowering medication. Theoretically, 3.12% of the patients studied (n=116) should be treated using the low-risk SCORE, 10.23% of patients (n=380) using the calibrated SCORE, and 0.67% of patients (n=25) using the SCORE-HDL.

Patients at high or very high risk classified by the SCORE for low-risk countries, according to whether or not they reach the therapeutic goals for cholesterol and whether or not they are receiving lipid-lowering drugs. 95%CI, 95% confidence interval. *Calculated by SCORE without rounding off decimals to nearest whole number.


Patients at high or very high risk classified by the SCORE with high-density lipoprotein cholesterol according to whether or not they reach the therapeutic goals for cholesterol and whether or not they are receiving lipid-lowering drugs. 95%CI, 95% confidence interval; SCORE-HDL: SCORE with high-density lipoprotein cholesterol. *Missing high-density lipoprotein values were imputed using the techniques described in “Methods”.
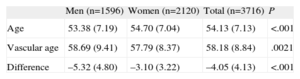
The vascular age of the total population and the vascular age by sex are shown in Table 3. In general, vascular age was 4 years older than the chronological age (5 years in men and 3 years in women).
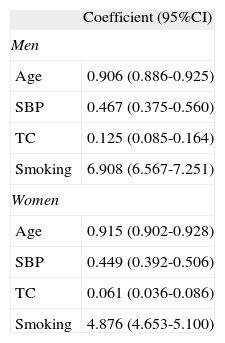
The results of the separate multiple linear regression models for men and women are shown in Table 4. Smoking was the strongest predictor of vascular age: elimination of smoking while maintaining the status of the remaining variables would reduce the vascular age by 7 years in men and 5 years in women.
Multiple Linear Regression Analysis to Evaluate Determinants of Vascular Age in Men and Women
| Coefficient (95%CI) | |
| Men | |
| Age | 0.906 (0.886-0.925) |
| SBP | 0.467 (0.375-0.560) |
| TC | 0.125 (0.085-0.164) |
| Smoking | 6.908 (6.567-7.251) |
| Women | |
| Age | 0.915 (0.902-0.928) |
| SBP | 0.449 (0.392-0.506) |
| TC | 0.061 (0.036-0.086) |
| Smoking | 4.876 (4.653-5.100) |
95%CI, 95% confidence interval; SBP, systolic blood pressure; TC, total cholesterol.
The changes refer to every 10 mg/dL of total cholesterol and every 10 mmHg of systolic blood pressure.
Over the last decade, cardiovascular risk estimation has become a cornerstone of clinical practice guidelines for cardiovascular disease prevention in the comprehensive management of cardiovascular risk factors in clinical practice.16,17
The choice of risk table to use for this purpose has been the subject of research and debate. According to a survey recently conducted in various health administrations in Spain,18 SCORE is the recommended table in 9 autonomous communities, followed by REGICOR in 3 communities, and the classic Framingham score in another 3 (2 autonomous communities did not respond).
In a study carried out in the primary care setting,19 SCORE was compared with REGICOR and moderate agreement was observed between the two methods: 7.9% of the population was classified at high risk with REGICOR and 9.2% with SCORE. In our study, the percentage of patients at high or very high risk according to the SCORE for low-risk countries was substantially lower (4.73%), likely due to the lower prevalence of smoking, HT, and hypercholesterolemia in our population. In a study evaluating agreement between the SCORE and Framingham tables,20 SCORE classified 5.5% of patients at high risk, whereas Framingham identified 8%. Of note, use of SCORE would exclude a relevant percentage of high-risk patients (according to Framingham) from lipid-lowering therapy. The percentage of patients at high or very high risk in that study was similar to the value in ours.
The SCORE tables have been calibrated in 7 European countries, including Spain, which theoretically would make them the most highly recommendable tables for use in these countries. However, no studies to date have focussed on comparing the outcome of applying the calibrated tables. Our results show that the use of one table or another would imply a widely varying prescription of lipid-lowering treatment, from 25 patients when the SCORE-HDL is used to 380 patients when the calibrated SCORE is applied. These differences are mainly due to the fact that the percentage of patients at high and very high risk differs depending on which table is used: 1.24% with SCORE-HDL, 4.73% with SCORE for low-risk countries, and 15.44% with the calibrated SCORE.
Regardless of the table used, it is striking that 80% to 90% of the high- or very high-risk patients identified did not reach the therapeutic goals set by the European guidelines. In a primary care study involving 9 countries (including Spain),21 in which attainment of LDL-C goals was assessed for primary and secondary prevention, 73% of all patients achieved the goals set by the guidelines, and Spain was precisely the country showing the lowest percentage (47.4%). In the DYSIS, another international study, 2273 high-risk patients participated from Spain, and 61.4% did not have LDL-C levels within the therapeutic objectives.22 Another study performed in the primary care setting and involving 1223 patients with cardiovascular disease23 reported that 60.1% had poorly controlled LDL-C levels, and that one of the determinants of this poor control was not receiving lipid-lowering treatment. It is very likely that LDL-C control in primary and secondary prevention of cardiovascular disease is influenced as much by treating or not with statins as by therapeutic inertia.
One of the innovations of the European guidelines on cardiovascular disease prevention in clinical practice (version 2012)8 is that it introduces the concept of vascular age, which can be calculated individually in a visual manner using risk tables or by the HeartScore® program of the European Society of Cardiology. For the present study we performed automated calculations using the tables designed by Cuende et al.,15 and found that the overall population had a higher vascular age than chronological age, and it was higher in men than in women. This is because the prevalence of risk factors was high, and 56% of the population had at least one risk factor (Table 1).
In analyzing the predictors of vascular age, smoking had the greatest influence in both men and women.
LimitationsOne of the limitations of this study is related to selection of the population, of which around 75% of all candidate patients had to be excluded for missing information on SBP or TC values in the previous two years. There are several possible explanations. These parameters may not have been recorded even though patients were seen at the center during this period; the data may have been recorded inappropriately for data collection, or the information was not recorded because patients had not come to the center during the two-year period. Comparison of the demographic and clinical data of the excluded and included population (data not presented) showed a slightly higher percentage of men (46% vs 43%) and significantly lower mean age (50 years vs 54 years) in the excluded patients. Thus, this was a younger population that generally uses primary case centers less often. As to the risk factors, the excluded population had a lower prevalence of HT (6% vs 22%) and hypercholesterolemia (7% vs 34%). Therefore, this was clearly a healthier population of patients who came less often to their health center and/or required fewer SBP and TC studies. Another limitation of the study is that it was performed in the population attended in health centers, and we cannot know whether the results observed can be extrapolated to the general population. The variables SBP and TC were collected retrospectively and the quality of the determinations cannot be assured, although the physicians used them to make their clinical decisions.
Another possible limitation could be related to underrectording of smoking (32% in our study) and that these patients were assumed to be nonsmokers in the cardiovascular risk calculations. We believe, however, that our approach was reasonable and that it did not affect the results. In primary care visits, patients are routinely questioned about whether they smoke, and physicians mainly record a smoking habit, and nonsmoking is not recorded as often. In any case, assuming the worst-case scenario that all patients without data on smoking were actually smokers (a highly improbable situation), the general risk according to the SCORE tables for low-risk countries would increase from 1.45 to 1.80 (a difference of 0.35 points), which is still quite low.
CONCLUSIONSThe calibrated SCORE table for Spain identifies a larger number of patients as being at high cardiovascular risk than the SCORE-HDL or SCORE for low-risk countries, which would imply a greater number of patients treated with statins. Validation studies of these tables are needed to determine which of them is the most suitable for use in clinical practice in our setting. Smoking is the risk factor with the greatest impact on vascular age.
CONFLICTS OF INTERESTNone declared.