Cardiovascular prevention continues to be one of the major challenges to our society, as this group of diseases generates very high morbidity and mortality rates.1 Basically, there are two types of prevention strategies: one aimed at the population and the other focusing on high-risk individuals.2 The first strategy is based on the introduction of measures that affect the population as a whole, such as, for example, legislation to regulate smoking in public places.3 The strategy for high-risk individuals involves identifying those at high risk for developing a cardiovascular disease and establishing preventive measures on an individual basis in accordance with the level of risk. To identify these subjects in primary prevention, the tool usually employed is opportunistic screening, in which the cardiovascular risk factors are determined in everyone who seeks medical attention from the health care system. To convert these factors into an estimate of the cardiovascular risk, there are different risk functions and charts. In their article published in the Revista Española de Cardiología, Brotons et al.4 evaluate the impact on cardiovascular risk estimation of the use of different SCORE (Systematic Coronary Risk Evaluation) charts applicable in Spain: SCORE for countries with low risk, SCORE for low risk including the variable of high-density lipoprotein cholesterol (HDL-C), and the calibrated SCORE, and observed highly inconsistent results when they compared the three charts. With the chart that includes HDL-C, 1.24% of the study population had a risk > 5%; this proportion was nearly 4-fold higher when the low-risk SCORE chart was used and 12.5-fold higher with the calibrated SCORE chart.
In this editorial comment, we will illustrate the fundamentals, utility, and limitations of risk functions, responding to a number of basic questions.
WHAT ARE RISK FUNCTIONS? WHAT INFORMATION DO THEY PROVIDE? AND HOW IS RISK REPORTED?Risk functions are mathematical equations to calculate the probability that an individual will develop the event of interest (coronary, cardiovascular, etc.) within a given period of time (generally 10 years), according to that person's level of exposure to different risk factors. When we calculate, using the SCORE function or charts, that a person's cardiovascular risk is 4%, the information that we receive is that, of 100 individuals with the same characteristics in terms of risk factors (age, sex, systolic blood pressure, total cholesterol, HDL-C, smoking habit) as the person in our office, 4 will die of cardiovascular disease over the next 10 years, but we do not know whether the patient in front of us will be in the group of 4 or in the group of the remaining 96.
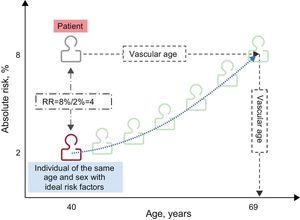
In the office, it is often difficult to convey the risk and ensure that the patient correctly interprets this information, what a risk of 4% signifies, and that this risk is intermediate. In addition to conveying this probability, referred to as absolute risk, and the risk category to which it corresponds (low, intermediate, high, or very high), other ways of effectively transmitting the risk—relative risk and vascular age (Figure)—are used, especially with young people, who are generally at low or intermediate risk, even if they have many risk factors. The relative risk compares the absolute risk of the patient with that of another patient of the same age and sex, with ideal levels of risk factors, in such a way that one patient can have a risk of 8%, but another person of the same age and sex without risk factors has a risk of 2%, that is, the first patient has a risk 4 times higher than he or she could have if all risk factors were at an ideal level. Vascular age corresponds to the age at which an individual with risk factors at an ideal level would reach the patient's current risk.5,6
HOW RISK FUNCTIONS ARE VALIDATED
Risk functions should calibrate and discriminate adequately. A correct calibration indicates that the estimated probabilities of the occurrence of an event reflect the actual situation, and the statistic normally used is Nam-D’Agostino chi-square. Moreover, the functions have to distinguish well between the individuals who are going to experience an event and those who will not. Discrimination is calculated by means of the area under the ROC (receiver operating characteristic) curve or the c-statistic, where a value of c=0.70 indicates that, if we randomly choose a person who will develop a disease and another who will not, the estimated risk would be greater in the affected person than in the control in 70% of the cases. Ideally, the statistic should be near 1, and a value of 0.50 would indicate that the function would be equivalent to tossing a coin.
CAN RISK FUNCTIONS BE TRANSFERRED FROM ONE COUNTRY TO ANOTHER?There are studies demonstrating that risk functions can be transferred from one country to another, but this transfer must be preceded by an adaptation to the true epidemiological situation of the country; that is, the functions must be recalibrated. To recalibrate a function, it is necessary to have population data on the incidence of the disease and the prevalence of the risk factors included in the function. The risks assigned to each risk factor can indeed be directly transferred from one region to another. Recalibration may also be necessary in regions in which the risk function was originally developed, but in which the incidence of the disease or the prevalence of the risk factor has changed over time. As Brotons et al.4 point out in their article, in Spain, a number of functions have been recalibrated to the true epidemiological situation of the country, and there are data on the validity of the REGICOR (Registre Gironí del COR) function.7
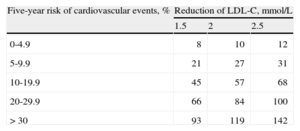
IS IT BETTER TO USE RISK FUNCTIONS OR TO CONSIDER THE RISK FACTORS INDIVIDUALLY?No clinical trial has demonstrated that, for cardiovascular prevention, the use of risk functions is better than considering the risk factors individually. However, the guidelines recommend that we calculate risk taking into account the exposure not only to one risk factor but to several, since it is necessary to consider the patient in his or her entirety and the factors interact with one another.8 As a stronger argument, we can use the results of a recent meta-analysis, in which it was observed that the variable most closely associated to the number of cardiovascular events prevented by statin therapy is the cardiovascular risk prior to the initiation of treatment, independently of the baseline levels of low-density lipoprotein cholesterol (LDL-C) (Table).9
Estimate of the Number of Cardiovascular Events Prevented for Every 1000 Patients Treated With Statins According to Their Baseline Cardiovascular Risk and the Reduction of Low-Density Lipoprotein Cholesterol Concentrations
| Five-year risk of cardiovascular events, % | Reduction of LDL-C, mmol/L | ||
| 1.5 | 2 | 2.5 | |
| 0-4.9 | 8 | 10 | 12 |
| 5-9.9 | 21 | 27 | 31 |
| 10-19.9 | 45 | 57 | 68 |
| 20-29.9 | 66 | 84 | 100 |
| >30 | 93 | 119 | 142 |
LDL-C, low-density lipoprotein cholesterol.
Adapted from the Cholesterol Treatment Trialists’ (CTT) Collaborators et al.9
In a recent study involving 1390 primary care physicians in Spain, it was observed that only 38% of the professionals calculated the risk in more than 80% of their patients with at least one cardiovascular risk factor.10 The major barriers to calculating cardiovascular risk indicated by the professionals were the lack of time (81%), the lack of computerized risk calculators (19%), the fact that the functions are not based on data obtained in the Spanish population (16%), and the lack of information on some variable that was necessary for the calculation of risk (15%). Moreover, 71% of the professionals were of the opinion that there were too many cardiovascular prevention guidelines and 50% thought that the goals for achieving risk factor control were not realistic.
The reality is that, as documented by Brotons et al.4 and other authors,11 a large proportion of high-risk patients do not receive proper treatment and many of those treated are not at high risk, a fact that calls into question the adequacy of the preventive measures used in clinical practice.
HOW DO WE ESTABLISH THE THRESHOLD FOR DEFINING HIGH RISK?One of the most common questions posed when a risk function is presented is the point from which the risk is considered high. Risk is continuous, and thus any cutoff point to define high risk is arbitrary. Risk functions or charts provide an estimator of the probability that the event of interest will occur within a given period of time, but they do not establish levels of risk per se. These cutoff points are generally established by consensus. Initially, when the only risk functions were those of Framingham, high risk was defined as a 10-year probability > 20% of a coronary event occurring. This point was established because it was the probability that a person who had had a coronary event would experience a second event within the following 10 years. In recent years, new methods have been developed, such as decision curves, that enable the calculation of the net benefit and the net benefit fraction, and cost-effectiveness analyses, upon which the choice of the cutoff point must be based, in order to decide whether to initiate a drug therapy or focus on lifestyle modification.12
WHAT ARE THE LIMITATIONS OF RISK FUNCTIONS?The most important limitation of risk functions is their low sensitivity, to the extent that a great number of coronary or cardiovascular events occur in the group of the population with intermediate risk.13 This apparent paradox is explained by the fact that a large proportion of the population is at intermediate risk, and thus contributes many cases. Important efforts are being made to identify biomarkers that improve the reclassification of individuals, especially those at intermediate risk.
Another of the limitations of the functions is that the number of factors they consider is limited. Thus, at the clinical level, the estimated risk has to be contextualized in the overall profile of the patient, taking into account other factors in addition to those considered in the functions. On the other hand, the functions do not take into account the length of exposure to the different risk factors considered and the majority do not take into account drug therapies.14 Finally, we could also point out that most of the functions estimate the 10-year risk, and in young people, this risk is usually low. In recent years, different functions to estimate the 30-year and lifetime risk have been reported.15,16
WHICH RISK FUNCTION SHOULD BE USED?The ideal function should encompass all the events that are relevant to the patient and, moreover, have shared causes and treatment. In our case, they should include the cardiovascular events related to arteriosclerosis, whether fatal or not, and take into account the incidence of this group of diseases and the prevalence of the cardiovascular risk factors in Spain. At the present time, three functions are mainly utilized in Spain17: SCORE, which estimates the 10-year risk of cardiovascular mortality in the population aged 35 years to 64 years; the original Framingham function, which estimates the 10-year risk of fatal or nonfatal coronary events in the population aged 35 years to 74 years, and REGICOR, which is the Framingham score calibrated with data from Girona, a province in northeastern Spain. Certain scientific societies8 and the Spanish Interdisciplinary Cardiovascular Prevention Committee18 recommend the use of the SCORE charts, although in some communities, the use of REGICOR or even the original Framingham score are recommended, and there is an open debate as to which risk function should be used. The results of the study presented by Brotons et al.4 extend this debate as to which SCORE function to use: low risk, including HDL-C, or calibrated. The lack of agreement between the results obtained with the different risk functions has also been observed in other populations.19 To continue to advance and respond to this question, it will be necessary to validate the different risk functions in a Spanish population and the REGICOR function has already been validated7; as the authors conclude, cohort studies are needed to validate the SCORE charts for use in our general population.
FUNDINGThe author receives funding from the Spanish Ministry of Science and Innovation, the Instituto de Salud Carlos III, the European Regional Development Fund (Cardiovascular Research Network RD12/0042/0013), the Spanish Health Research Fund (FIS PI12/00232), and the Agència de Gestió d’Ajuts Universitaris i de Recerca of Catalonia, Spain (2009 SGR 1195).
CONFLICT OF INTERESTThe author declares he has no conflicts involving economic interests. The author declares that he is a member of the group of researchers that calibrated and validated the REGICOR function in Spain.