To evaluate the use of health care resources and their cost according to the effects of kidney failure in heart failure patients during 2-year follow-up in a population setting.
MethodsObservational retrospective study based on a review of medical records. The study included patients ≥ 45 years treated for heart failure from 2008 to 2010. The patients were divided into 2 groups according to the presence/absence of KF. Main outcome variables were comorbidity, clinical status (functional class, etiology), metabolic syndrome, costs, and new cases of cardiovascular events and kidney failure. The cost model included direct and indirect health care costs. Statistical analysis included multiple regression models.
ResultsThe study recruited 1600 patients (prevalence, 4.0%; mean age 72.4 years; women, 59.7%). Of these patients, 70.1% had hypertension, 47.1% had dyslipidemia, and 36.2% had diabetes mellitus. We analyzed 433 patients (27.1%) with kidney failure and 1167 (72.9%) without kidney failure. Patients with kidney failure were associated with functional class III-IV (54.1% vs 40.8%) and metabolic syndrome (65.3% vs 51.9%, P<.01). The average unit cost was €10 711.40. The corrected cost in the presence of kidney failure was €14 868.20 vs €9364.50 (P=.001). During follow-up, 11.7% patients developed ischemic heart disease, 18.8% developed kidney failure, and 36.1% developed heart failure exacerbation.
ConclusionsComorbidity associated with heart failure is high. The presence of kidney failure increases the use of health resources and leads to higher costs within the National Health System.
Keywords
Cardiovascular disease is the leading cause of mortality in developed countries.1 The detection and control of cardiovascular risk factors remains the key strategy in its prevention.2 Heart failure (HF) is a major public health problem and is characterized by significant mortality, frequent hospitalization, and poor quality of life. The overall prevalence of HF is increasing. In Europe, the prevalence of HF is 2% to 3% and affects 10% to 20% of patients > 65 years.3 In-hospital mortality is high and readmissions are frequent.4,5
Ischemic heart disease is the most common cause of HF, occurring in 60% to 70% of HF patients, and is particularly prevalent in elderly patients.2 Renal dysfunction is common in HF patients and its prevalence increases according to the severity of HF, age, and a history of hypertension or diabetes mellitus.1 Kidney failure (KF) is an accepted risk factor for poor prognosis in HF patients and can affect 30% to 50% of patients.6
Heart failure is among the diseases with the greatest impact on health and society, not only because of its high prevalence, but also because of its associated acute and chronic complications. Heart failure increases the use of health resources.2,5,7 In general, the management of HF consumes 1% to 2% of health budgets in European countries, of which around 75% are hospital costs.2,8
Few studies have been conducted in Spain on the use of health care resources and costs in HF patients and the relationship between HF and KF (a risk factor for poor prognosis in HF patients) in the general population. This study contributes information relevant to this issue.
The main aim of the study was to assess the use of health care resources and costs in HF patients according to the effects of KF during 2-year follow-up in a population setting. Secondary aims were to determine the comorbidity and mortality associated with HF patients.
METHODSStudy Design and SettingThis was an observational, longitudinal, retrospective, multicenter study based on medical records extracted from electronic health records of hospital outpatients (OMIAPWIN, Stacks CIS) and inpatients (GesDohc, Cibal Systems). The study population consisted of patients from 6 primary care (PC) centers and 2 acute care hospitals. The majority of patients registered in the hospitals lived in cities, were of low-middle socioeconomic status, and worked in factories.
Inclusion and Exclusion CriteriaAll patients admitted for an HF episode (prevalent or incident) from 2008 to 2010 (inclusion date) who fulfilled the following characteristics were included in the study: a) age ≥ 40 years; b) undergoing regular follow-up (> 1 visit per year) according to the protocol/guidelines for cardiovascular risk established by each hospital, and c) patient follow-up could be guaranteed. Patients were excluded if they had been transferred or moved to other geographic areas. The patients were divided into 2 groups according to the presence/absence of KF.
Diagnosis of Heart Failure and Kidney FailureA diagnosis of HF was made according to the ICPC-2 (International Classification of Primary Care, second edition)9 (code: K77) and/or the ICD-9-CM (International Classification of Diseases, Ninth Revision, Clinical Modification) (code: 428). A diagnosis of acute HF (exacerbation in hospital) was made according to a diagnostic coding derived from the Framingham diagnostic criteria10 and the European Society of Cardiology guidelines.2 Kidney failure (estimated glomerular filtration rate) was defined as a deterioration of renal function (serum creatinine: men, >133 mmol/L; women, >124 mmol/L; or estimated glomerular filtration rate<60mL/min) based on the first measurements following inclusion.
Sociodemographic and Comorbidity VariablesMain study variables were age, sex, and duration of HF (from diagnosis); personal history according to the ICPC-29 (hypertension, diabetes mellitus, dyslipidemia, obesity, smoking, alcoholism, liver failure, ischemic heart disease, stroke, chronic obstructive pulmonary disease, bronchial asthma, dementia or memory disorders); neurological diseases (Parkinson disease, epilepsy, multiple sclerosis, and other neurological diseases); depressive syndrome, malignant neoplasm, valvular heart disease, atrial fibrillation, anemia, and thyroid abnormalities. The following indicators were used to obtain a summary comorbidity variable for each patient: a) the Charlson comorbidity index11 to estimate patient severity; b) the number of diagnoses, and c) an individual case-mix index obtained using the Adjusted Clinical Groups patient classification system that assigns each patient to a single group with similar resource consumption.12 The Adjusted Clinical Groups system provides resource utilization bands whereby each patient is grouped into 1 of 5 mutually exclusive categories based on their overall morbidity.
Biochemical and Anthropometric Parameters and the Definition of the Metabolic SyndromeBiochemical and anthropometric parameters: systolic blood pressure, diastolic blood pressure, body mass index, baseline glycemia, glycohemoglobin, serum triglycerides, total cholesterol, high-density lipoprotein cholesterol, low-density lipoprotein cholesterol, and serum creatinine. The metabolic syndrome was defined by the presence of 3 of the 5 National Cholesterol Education Program-Adult Treatment Panel III modified diagnostic criteria.13 In this study, a body mass index value ≥ 28.8 was used in place of waist circumference. This approach has been applied by other authors.14 The first measurements obtained after patient inclusion were used.
Other Clinical VariablesData on the following clinical variables were obtained from electronic medical records: a) preserved left ventricular ejection fraction ≥ 45% or depressed left ventricular ejection fraction<45% (of any etiology); b) NYHA (New York Heart Association) class I-II and III-IV; c) de novo HF or a first diagnosis of chronic decompensated HF, and d) cause of HF (ischemia, hypertension, valvular heart disease, idiopathic dilated cardiomyopathy, or other). The first measurements obtained after patient inclusion were used.
TreatmentThe codes used to identify the treatment administered were obtained from the ATC/DDD system.15 Drug treatment information was obtained from the prescribing PC physician or referring cardiologist: diuretics, digoxin, angiotensin-converting enzyme inhibitors, angiotensin receptor blockers, beta-blockers, spironolactone, nitrates, calcium antagonists, antiarrhythmic agents, antiplatelet agents, anticoagulants, and statins. These records were obtained at patient inclusion.
Patient Follow-upDuring the follow-up period (2 years), we recorded new episodes of cardiovascular events and KF: a) ischemic heart disease (angina [K74, K76] and acute myocardial infarction [K75]); b) cerebrovascular disease (ischemic or hemorrhagic stroke [K90], transient ischemic attack [K91], and peripheral arterial disease [K92]); c) kidney disease; d) coronary revascularization, heart valve surgery, or heart transplant, and e) readmissions for HF (K77) and all-cause mortality.
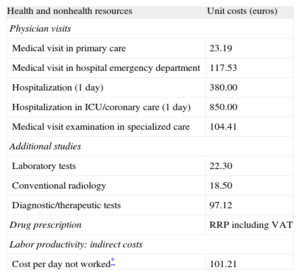
Resource Use and Cost ModelDirect costs related to health care activities (medical visits, hospital days, emergencies, diagnostic tests or therapeutic orders, outpatient medication) and non-health-care costs (indirect costs) related to loss of productivity (days of disability) were calculated from the time of inclusion. Cost was expressed as average cost per patient (unit cost). Table 1 shows the unit cost of health care and unit cost of lost working days for 2012. Days of disability or loss of productivity were quantified according to the average wage (Spanish National Institute of Statistics).16
Unit Costs and Lost Productivity (2012)
| Health and nonhealth resources | Unit costs (euros) |
| Physician visits | |
| Medical visit in primary care | 23.19 |
| Medical visit in hospital emergency department | 117.53 |
| Hospitalization (1 day) | 380.00 |
| Hospitalization in ICU/coronary care (1 day) | 850.00 |
| Medical visit examination in specialized care | 104.41 |
| Additional studies | |
| Laboratory tests | 22.30 |
| Conventional radiology | 18.50 |
| Diagnostic/therapeutic tests | 97.12 |
| Drug prescription | RRP including VAT |
| Labor productivity: indirect costs | |
| Cost per day not worked* | 101.21 |
ICU, intensive care unit; RRP, recommended retail price; VAT, Value Added Tax.
Spanish Institute of Statistics: Spanish National Accounts 2012.16 Costs pertaining to 2012. Source of information on health resources: Badalona Serveis Assistencials. This organization is a publicly funded body that provides private services, which facilitated access to its analytical accounts.
The study was classified (No-EPA [post-authorisation study]) by the Spanish Agency on Medication and Health Care Supplies (Agencia Española del Medicamento y Productos Sanitarios) and was subsequently approved by the Clinical Research Ethics Committee of the Hospital Universitari Germans Trias i Pujol in Badalona (Barcelona, Spain).
Statistical AnalysisDescriptive statistics were performed using a confidence interval of 95% (95%CI) and a Kolmogorov-Smirnov test was used to verify the normal distribution of the variables. Analysis of variance and chi-square were used in the bivariate analysis. A binary logistic regression model was used to obtain the variables associated with the presence/absence of KF using the enter procedure (Wald statistic). A multiple linear regression model (for consecutive steps) was used to obtain the variables associated with health costs. Health and nonhealth costs were compared by analysis of covariance, as recommended by Thompson and Barber.17 Covariables (estimated marginal means with Bonferroni adjustment) were sex, age, resource utilization bands, Charlson index, and time from diagnosis. The SPSSWIN version 19 software package was used for analysis and a P value<.05 was selected as the cutoff for statistical significance.
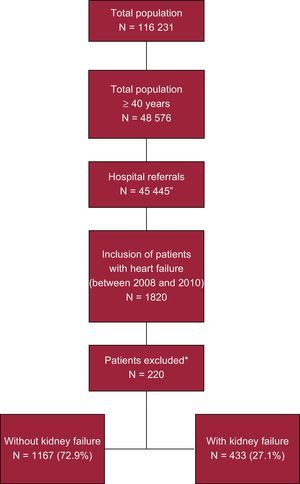
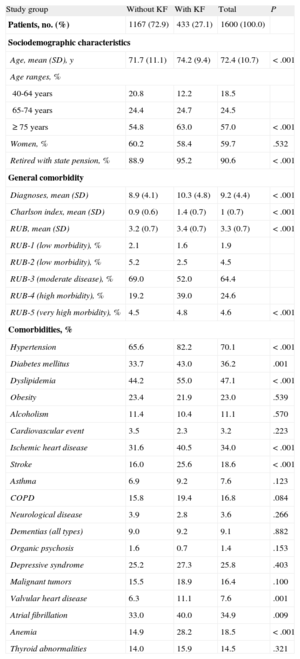
RESULTSGeneral and Clinical CharacteristicsOf an initial selection of 48 576 patients ≥ 45 years referred to the hospitals, 1820 had a diagnosis of HF (Figure 1). Of these, 1600 were enrolled in the study. These patients were divided into 2 groups according to the presence/absence of KF. The group of patients with impaired renal function constituted 27.1% (n=433; 95% CI, 24.9%-29.3%) of the total sample. Table 2 shows the general characteristics of the 2 study groups. The mean age of the patients was 72.4 (10.7) years and 59.7% were women. Heart failure-associated morbidity was high: 70.1% of all patients had hypertension, 47.1% had dyslipidemia, 36.2% had diabetes mellitus, 34.9% had atrial fibrillation, and 34.0% had ischemic heart disease. The logistic model showed that the presence of KF was associated with overall comorbidity (Charlson index; odds ratio [OR]=3.2; 95%CI, 2.6-4.0), hypertension (OR=2.3; 95%CI, 1.7-3.1), anemia (OR=1.9; 95%CI, 1.4-2.5), valvular heart disease (OR=1.8; 95%CI, 1.2-2.8), ischemic heart disease (OR=1.6; 95%CI, 1.1-2.5), and diabetes mellitus (OR=1.4, 95%CI, 1.1-1.9) (P<.05).
; lost to follow-up, 75 (34.1%), and moved to other geographic areas or other causes, 58 (26.4%).")
Study overview. Retrospective observational design to determine the economic impact of patients with heart failure. All patients were followed up for 2 years after the date of inclusion. *Reasons for patient exclusion: missing or inconsistent data, 87 (39.5%); lost to follow-up, 75 (34.1%), and moved to other geographic areas or other causes, 58 (26.4%).
General Characteristics of the Study Groups
| Study group | Without KF | With KF | Total | P |
| Patients, no. (%) | 1167 (72.9) | 433 (27.1) | 1600 (100.0) | |
| Sociodemographic characteristics | ||||
| Age, mean (SD), y | 71.7 (11.1) | 74.2 (9.4) | 72.4 (10.7) | <.001 |
| Age ranges, % | ||||
| 40-64 years | 20.8 | 12.2 | 18.5 | |
| 65-74 years | 24.4 | 24.7 | 24.5 | |
| ≥ 75 years | 54.8 | 63.0 | 57.0 | <.001 |
| Women, % | 60.2 | 58.4 | 59.7 | .532 |
| Retired with state pension, % | 88.9 | 95.2 | 90.6 | <.001 |
| General comorbidity | ||||
| Diagnoses, mean (SD) | 8.9 (4.1) | 10.3 (4.8) | 9.2 (4.4) | <.001 |
| Charlson index, mean (SD) | 0.9 (0.6) | 1.4 (0.7) | 1 (0.7) | <.001 |
| RUB, mean (SD) | 3.2 (0.7) | 3.4 (0.7) | 3.3 (0.7) | <.001 |
| RUB-1 (low morbidity), % | 2.1 | 1.6 | 1.9 | |
| RUB-2 (low morbidity), % | 5.2 | 2.5 | 4.5 | |
| RUB-3 (moderate disease), % | 69.0 | 52.0 | 64.4 | |
| RUB-4 (high morbidity), % | 19.2 | 39.0 | 24.6 | |
| RUB-5 (very high morbidity), % | 4.5 | 4.8 | 4.6 | <.001 |
| Comorbidities, % | ||||
| Hypertension | 65.6 | 82.2 | 70.1 | <.001 |
| Diabetes mellitus | 33.7 | 43.0 | 36.2 | .001 |
| Dyslipidemia | 44.2 | 55.0 | 47.1 | <.001 |
| Obesity | 23.4 | 21.9 | 23.0 | .539 |
| Alcoholism | 11.4 | 10.4 | 11.1 | .570 |
| Cardiovascular event | 3.5 | 2.3 | 3.2 | .223 |
| Ischemic heart disease | 31.6 | 40.5 | 34.0 | <.001 |
| Stroke | 16.0 | 25.6 | 18.6 | <.001 |
| Asthma | 6.9 | 9.2 | 7.6 | .123 |
| COPD | 15.8 | 19.4 | 16.8 | .084 |
| Neurological disease | 3.9 | 2.8 | 3.6 | .266 |
| Dementias (all types) | 9.0 | 9.2 | 9.1 | .882 |
| Organic psychosis | 1.6 | 0.7 | 1.4 | .153 |
| Depressive syndrome | 25.2 | 27.3 | 25.8 | .403 |
| Malignant tumors | 15.5 | 18.9 | 16.4 | .100 |
| Valvular heart disease | 6.3 | 11.1 | 7.6 | .001 |
| Atrial fibrillation | 33.0 | 40.0 | 34.9 | .009 |
| Anemia | 14.9 | 28.2 | 18.5 | <.001 |
| Thyroid abnormalities | 14.0 | 15.9 | 14.5 | .321 |
COPD, chronic obstructive pulmonary disease; KF, kidney failure; RUB, resource utilization bands; SD, standard deviation; SS, Social Security.
Unless otherwise indicated, data are expressed as No. (%) or mean (standard deviation).
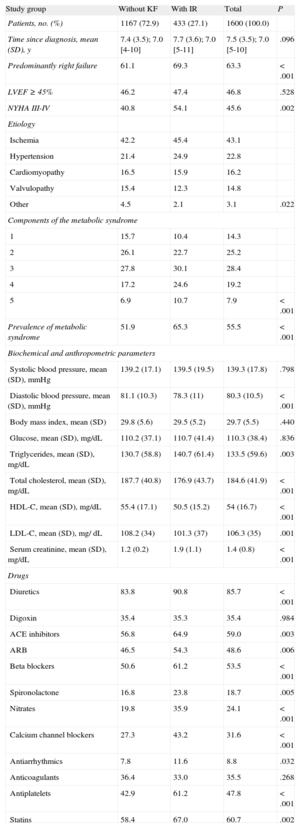
Table 3 shows the distribution of clinical variables, metabolic syndrome, and drug treatment by group. The median time from diagnosis was 7.5 years and the most frequent cause of HF was ischemia (43.1%). There were more patients with NYHA III-IV (54.1% vs 40.8%, P=.002) and the metabolic syndrome (65.3% vs 51.9%, P<.001) in the group with KF than in the group without KF. Patients with KF used more drugs, with the exception of digoxin and anticoagulants. The most commonly used drugs were diuretics (85.7%), statins (60.7%), angiotensin-converting enzyme inhibitors (59.0%), beta blockers (53.5%), and angiotensin receptor blockers (48.6%).
Clinical Variables, the Metabolic Syndrome, and Drugs Administered by Study Group
| Study group | Without KF | With IR | Total | P |
| Patients, no. (%) | 1167 (72.9) | 433 (27.1) | 1600 (100.0) | |
| Time since diagnosis, mean (SD), y | 7.4 (3.5); 7.0 [4-10] | 7.7 (3.6); 7.0 [5-11] | 7.5 (3.5); 7.0 [5-10] | .096 |
| Predominantly right failure | 61.1 | 69.3 | 63.3 | <.001 |
| LVEF ≥ 45% | 46.2 | 47.4 | 46.8 | .528 |
| NYHA III-IV | 40.8 | 54.1 | 45.6 | .002 |
| Etiology | ||||
| Ischemia | 42.2 | 45.4 | 43.1 | |
| Hypertension | 21.4 | 24.9 | 22.8 | |
| Cardiomyopathy | 16.5 | 15.9 | 16.2 | |
| Valvulopathy | 15.4 | 12.3 | 14.8 | |
| Other | 4.5 | 2.1 | 3.1 | .022 |
| Components of the metabolic syndrome | ||||
| 1 | 15.7 | 10.4 | 14.3 | |
| 2 | 26.1 | 22.7 | 25.2 | |
| 3 | 27.8 | 30.1 | 28.4 | |
| 4 | 17.2 | 24.6 | 19.2 | |
| 5 | 6.9 | 10.7 | 7.9 | <.001 |
| Prevalence of metabolic syndrome | 51.9 | 65.3 | 55.5 | <.001 |
| Biochemical and anthropometric parameters | ||||
| Systolic blood pressure, mean (SD), mmHg | 139.2 (17.1) | 139.5 (19.5) | 139.3 (17.8) | .798 |
| Diastolic blood pressure, mean (SD), mmHg | 81.1 (10.3) | 78.3 (11) | 80.3 (10.5) | <.001 |
| Body mass index, mean (SD) | 29.8 (5.6) | 29.5 (5.2) | 29.7 (5.5) | .440 |
| Glucose, mean (SD), mg/dL | 110.2 (37.1) | 110.7 (41.4) | 110.3 (38.4) | .836 |
| Triglycerides, mean (SD), mg/dL | 130.7 (58.8) | 140.7 (61.4) | 133.5 (59.6) | .003 |
| Total cholesterol, mean (SD), mg/dL | 187.7 (40.8) | 176.9 (43.7) | 184.6 (41.9) | <.001 |
| HDL-C, mean (SD), mg/dL | 55.4 (17.1) | 50.5 (15.2) | 54 (16.7) | <.001 |
| LDL-C, mean (SD), mg/ dL | 108.2 (34) | 101.3 (37) | 106.3 (35) | .001 |
| Serum creatinine, mean (SD), mg/dL | 1.2 (0.2) | 1.9 (1.1) | 1.4 (0.8) | <.001 |
| Drugs | ||||
| Diuretics | 83.8 | 90.8 | 85.7 | <.001 |
| Digoxin | 35.4 | 35.3 | 35.4 | .984 |
| ACE inhibitors | 56.8 | 64.9 | 59.0 | .003 |
| ARB | 46.5 | 54.3 | 48.6 | .006 |
| Beta blockers | 50.6 | 61.2 | 53.5 | <.001 |
| Spironolactone | 16.8 | 23.8 | 18.7 | .005 |
| Nitrates | 19.8 | 35.9 | 24.1 | <.001 |
| Calcium channel blockers | 27.3 | 43.2 | 31.6 | <.001 |
| Antiarrhythmics | 7.8 | 11.6 | 8.8 | .032 |
| Anticoagulants | 36.4 | 33.0 | 35.5 | .268 |
| Antiplatelets | 42.9 | 61.2 | 47.8 | <.001 |
| Statins | 58.4 | 67.0 | 60.7 | .002 |
ACE, angiotensin-converting enzyme; ARB, angiotensin receptor blockers; HDL-C, high-density lipoprotein cholesterol; KF, kidney failure; LDL-C, low-density lipoprotein cholesterol; LVEF, left ventricular ejection fraction; NYHA, New York Heart Association; SD, standard deviation.
Unless otherwise indicated, data are expressed as percentage, mean (standard deviation), or median [interquartile range].
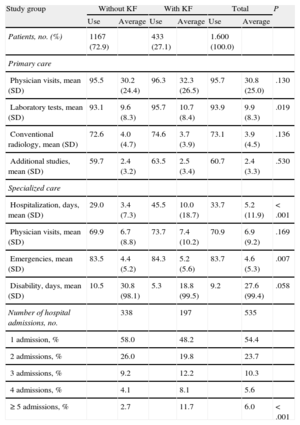
Table 4 shows the use of health and nonhealth resources in the 2 groups. Patients with KF used more health resources, especially in PC medical visits (32.3 vs 30.2; P=.013), hospital days (10.0 vs 3.4; P<.001), and emergency services (5.2 vs 4.4, P=.007). Mean hospital stay was 8.6 (8.8) days; hospital stay of patients with KF was longer (9.7 days vs 8.2 days; P=.002). During the study period, there were an average of 1.1 admissions vs 0.50 admissions (P<.001), respectively.
Use of Health and Nonhealth Resources (Average Unit) by Study Groups
| Study group | Without KF | With KF | Total | P | |||
| Use | Average | Use | Average | Use | Average | ||
| Patients, no. (%) | 1167 (72.9) | 433 (27.1) | 1.600 (100.0) | ||||
| Primary care | |||||||
| Physician visits, mean (SD) | 95.5 | 30.2 (24.4) | 96.3 | 32.3 (26.5) | 95.7 | 30.8 (25.0) | .130 |
| Laboratory tests, mean (SD) | 93.1 | 9.6 (8.3) | 95.7 | 10.7 (8.4) | 93.9 | 9.9 (8.3) | .019 |
| Conventional radiology, mean (SD) | 72.6 | 4.0 (4.7) | 74.6 | 3.7 (3.9) | 73.1 | 3.9 (4.5) | .136 |
| Additional studies, mean (SD) | 59.7 | 2.4 (3.2) | 63.5 | 2.5 (3.4) | 60.7 | 2.4 (3.3) | .530 |
| Specialized care | |||||||
| Hospitalization, days, mean (SD) | 29.0 | 3.4 (7.3) | 45.5 | 10.0 (18.7) | 33.7 | 5.2 (11.9) | <.001 |
| Physician visits, mean (SD) | 69.9 | 6.7 (8.8) | 73.7 | 7.4 (10.2) | 70.9 | 6.9 (9.2) | .169 |
| Emergencies, mean (SD) | 83.5 | 4.4 (5.2) | 84.3 | 5.2 (5.6) | 83.7 | 4.6 (5.3) | .007 |
| Disability, days, mean (SD) | 10.5 | 30.8 (98.1) | 5.3 | 18.8 (99.5) | 9.2 | 27.6 (99.4) | .058 |
| Number of hospital admissions, no. | 338 | 197 | 535 | ||||
| 1 admission, % | 58.0 | 48.2 | 54.4 | ||||
| 2 admissions, % | 26.0 | 19.8 | 23.7 | ||||
| 3 admissions, % | 9.2 | 12.2 | 10.3 | ||||
| 4 admissions, % | 4.1 | 8.1 | 5.6 | ||||
| ≥ 5 admissions, % | 2.7 | 11.7 | 6.0 | <.001 | |||
KF, kidney failure; SD, standard deviation.
Unless otherwise indicated, data are expressed as percentage or mean (standard deviation).
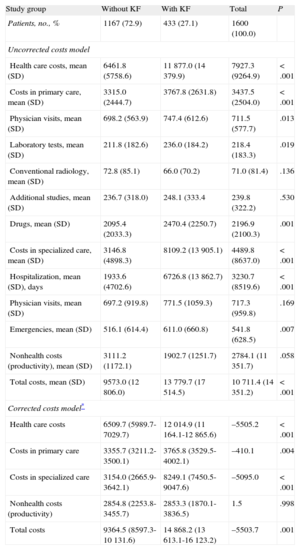
The total cost of treating all study patients was €17.1 million, of which 74.0% was health care costs and 26.0% non-health-care costs (loss of productivity). Table 5 shows the health care costs per patient per group. Of total healthcare costs, PC accounted for 43.4% and specialized care accounted for 56.6%. Hospital admissions accounted for the largest percentage of total costs (30.2%). In PC, visits accounted for 6.6% and drug prescription 20.5% of costs.
Gross and Corrected Costs (euros) by Study Group During 2-Year Follow-up
| Study group | Without KF | With KF | Total | P |
| Patients, no., % | 1167 (72.9) | 433 (27.1) | 1600 (100.0) | |
| Uncorrected costs model | ||||
| Health care costs, mean (SD) | 6461.8 (5758.6) | 11 877.0 (14 379.9) | 7927.3 (9264.9) | <.001 |
| Costs in primary care, mean (SD) | 3315.0 (2444.7) | 3767.8 (2631.8) | 3437.5 (2504.0) | <.001 |
| Physician visits, mean (SD) | 698.2 (563.9) | 747.4 (612.6) | 711.5 (577.7) | .013 |
| Laboratory tests, mean (SD) | 211.8 (182.6) | 236.0 (184.2) | 218.4 (183.3) | .019 |
| Conventional radiology, mean (SD) | 72.8 (85.1) | 66.0 (70.2) | 71.0 (81.4) | .136 |
| Additional studies, mean (SD) | 236.7 (318.0) | 248.1 (333.4 | 239.8 (322.2) | .530 |
| Drugs, mean (SD) | 2095.4 (2033.3) | 2470.4 (2250.7) | 2196.9 (2100.3) | .001 |
| Costs in specialized care, mean (SD) | 3146.8 (4898.3) | 8109.2 (13 905.1) | 4489.8 (8637.0) | <.001 |
| Hospitalization, mean (SD), days | 1933.6 (4702.6) | 6726.8 (13 862.7) | 3230.7 (8519.6) | <.001 |
| Physician visits, mean (SD) | 697.2 (919.8) | 771.5 (1059.3) | 717.3 (959.8) | .169 |
| Emergencies, mean (SD) | 516.1 (614.4) | 611.0 (660.8) | 541.8 (628.5) | .007 |
| Nonhealth costs (productivity), mean (SD) | 3111.2 (1172.1) | 1902.7 (1251.7) | 2784.1 (11 351.7) | .058 |
| Total costs, mean (SD) | 9573.0 (12 806.0) | 13 779.7 (17 514.5) | 10 711.4 (14 351.2) | <.001 |
| Corrected costs model* | ||||
| Health care costs | 6509.7 (5989.7-7029.7) | 12 014.9 (11 164.1-12 865.6) | –5505.2 | <.001 |
| Costs in primary care | 3355.7 (3211.2-3500.1) | 3765.8 (3529.5-4002.1) | –410.1 | .004 |
| Costs in specialized care | 3154.0 (2665.9-3642.1) | 8249.1 (7450.5-9047.6) | –5095.0 | <.001 |
| Nonhealth costs (productivity) | 2854.8 (2253.8-3455.7) | 2853.3 (1870.1-3836.5) | 1.5 | .998 |
| Total costs | 9364.5 (8597.3-10 131.6) | 14 868.2 (13 613.1-16 123.2) | –5503.7 | .001 |
95%C, 95% confidence interval; KF, kidney failure; SD, standard deviation.
Unless otherwise indicated, data are expressed as No. (%) or mean (standard deviation).
Analysis of covariance: model: linearly independent pair-wise comparisons of estimated marginal means with their respective 95% confidence intervals and the difference. Random components: sex and presence/absence of kidney failure. Covariates: age, sex, general morbidity (Charlson index; resource utilization bands), and time since diagnosis (years). The average total unit cost/patient-year was €5356.
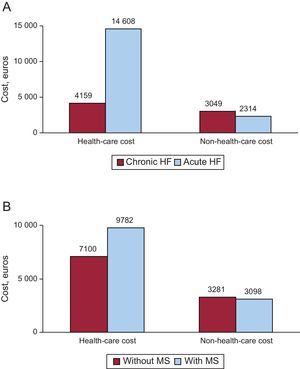
The average total unit cost of HF was €10 711.4. The average health care cost of patients with KF and without KF was €13 779.7 and €9573.0 (P<.001), respectively. The average total unit costs and the average health care unit costs corrected by covariates (analysis of covariance) according to the presence/absence of KF were €14 868.2 and €9364.5 (P=.001) and €12 014.9 and €6509.7 (P<.001), respectively. Figure 2 shows the distribution of health and nonhealth costs by acute or chronic HF and presence/absence of the metabolic syndrome.
. B: by metabolic syndrome (presence or absence). Values are expressed in euros. Statistically significant differences were found in health care costs (P<.001) but not in non-health-care costs. HF, heart failure; MS, metabolic syndrome.")
Health-care costs and non-health-care costs. A: by type of heart failure (acute or chronic). B: by metabolic syndrome (presence or absence). Values are expressed in euros. Statistically significant differences were found in health care costs (P<.001) but not in non-health-care costs. HF, heart failure; MS, metabolic syndrome.
The costs of HF were further analyzed using the average total unit cost of the following variables: sex (men vs women, €12 997.0 vs €9167.7), functional class (NYHA I-II vs III-IV, €7781.1 vs €14 284.5), hospitalization for HF during follow-up (yes vs no, €17 147.7 vs €7478.2) and by left ventricular ejection fraction (preserved vs depressed, €9621.3 vs €11 049.8) (P<.01 in all cases).
Incidence of Cardiovascular Events, Mortality and SurvivalDuring follow-up, the rate of new cases was as follows: ischemic heart disease, 11.7% (with KF vs without KF, 14.5% vs 10.7%; P=.032); stroke, 6.6% (9.1% vs 5.1%; P=.048); revascularization, 12.1% (11.4% vs 12.4%; P=.766); and KF, 18.8%. The rate of all-cause mortality was 23.7% (30.7% vs 21.1%, P<.001). In total, 36.1% of patients (n=535) had an exacerbation of HF (Table 4) and this figure was higher in patients with KF (48.3% vs 31.5%; P<.001). Of these patients, 189 were new cases (de novo HF or acute HF, 35.3%). The 5-year survival of HF patients was 57.0%.
DISCUSSIONThis study investigated the economic impact of HF on resource use and costs in Spain. Kidney failure is very prevalent in patients at high cardiovascular risk,6 is an important prognostic factor in patients, and is considered to be more definitive than other parameters such as left ventricular ejection fraction or functional class.2 Moreover, in hospitalized patients, KF is associated with increased hospitalization stay, mortality, and readmission for HF.6 Belziti et al6 retrospectively analyzed 200 patients who had been hospitalized for HF and found that 23% had a diagnosis of KF. Mortality and readmission rates were higher in patients with KF. These results are consistent with those presented in the literature2,7 and highlight the importance of KF in the prediction of disease progression.
The results of the logistic model show that KF in the presence of HF is associated with general and specific comorbidity. These results are consistent with those described in the review articles by Triposkiadis and Skoularigis18 and Shah and Agarwal,19 who found that comorbidity associated with HF plays a key in disease progression and response to treatment. This burden of comorbidity is associated with higher rates of hospitalization.20–22 A review of the literature shows that data on HF costs are scarce and difficult to compare. The excellent general review studies conducted by Liao et al23 and Norton et al24 showed that patients with HF have high morbidity and mortality and impaired quality of life. They also showed that HF is one of the most costly chronic diseases in developed countries and consumes 1% to 2% of all health spending. The costs of HF will probably increase because of an aging population and current epidemiological trends (increased obesity and diabetes mellitus).
Several studies have addressed the issue of the cost of HF. Bogner et al25 conducted an observational study of hospitalized patients and showed that the combination of HF and diabetes mellitus involves higher costs than HF alone ($32 676 vs $22 230, respectively). Dall et al26 found that the mean annual cost of HF was $33 247. The authors estimate an increase in disease prevalence of 26% between 2013 and 2022, with a corresponding increase in the use of health resources. Mejhert et al27 recently studied 208 patients ≥ 60 years in a population setting like ours (PC and hospital) and found that average yearly cost per patient was about €5700, results that are more similar to ours. A recent study28 that used a methodology similar to ours (population setting, 2-year follow-up) found that the total cost of patients with diabetes mellitus was about €2500. This figure underscores the high cost of HF in Spain.
There was also significant variation between patients at follow-up. In our study, mortality was high and exacerbations and cardiovascular and renal complications were frequent. We found that HF mortality was approximately 12% per year (31% in 3 years). This percentage is similar to that found in other studies, such as those by Lund et al29 (34% in 3 years) and by Nunez et al30 (15% had an infarction and 20.8% died).
LimitationsThe study may have been limited by factors common to retrospective studies, such as diseases being underreported, and also by potential variations between physicians and between patients due to the observational design, and even by the cost system used. The study may also have been limited by the potential inaccuracy of diagnostic coding used in the diagnosis of HF and other comorbidities or by limitations concerning the reliability of the Framingham criteria themselves. Other limitations included the following: a) patients with subclinical or mild forms of HF and/or KF were not included because only some of these patients entered the hospital system; b) the absence of certain prognostic biomarkers, such as brain natriuretic peptide, because this is not routinely measured; c) variables such as left ventricular ejection fraction and functional class were not determined during follow-up, and d) although information on the main pharmacological groups was obtained, changes in treatment during follow-up were not recorded and the degree of adherence to treatment was not assessed. A further limitation was that direct nonhealth costs were not included, meaning “out-of-pocket costs” paid by the patient or family members, because these were not recorded in the database and the patient could not be consulted due to the study design.
Future studies should include cost-effectiveness and treatment trials. The present study should be replicated in other health care settings.
CONCLUSIONSComorbidity associated with HF is high. The presence of KF increases the use of health resources and costs within the National Health System.
CONFLICT OF INTERESTThis study was funded by Novartis, which had no influence on the final results. Statistical analysis was performed by Antoni Sicras Mainar and funded by Novartis. All the authors declare no conflicts of interest. Novartis was not involvement in the design, data collection, data analysis, decision to publish, or the preparation of the manuscript.