Tricuspid annular plane systolic excursion (TAPSE) is an echocardiographic measure that allows us to assess right ventricular systolic function. TAPSE measurement is common in adults but reference values for children are scarce. Our objective was to establish reference values for TAPSE in Spanish children and to determine the relationship of these values with age and body surface.
MethodsThis prospective study included 405 patients (from newborn to age 18 years, 53% male) referred for assessment of cardiac murmurs. Patients with confirmed cardiac or any other disease were excluded. We collected TAPSE measurements by M-mode echocardiography and recorded anthropometric variables. We analyzed the intra- and interobserver reproducibility of these measurements.
ResultsMean TAPSE values were 17.09±5.09cm with nonsignificant differences between sexes. A curvilinear regression model proved appropriate, with values increasing in proportion to age group, height, weight, body mass index, and body surface. Body surface showed a strong positive correlation with TAPSE values (r=0.81), whereas frequency had a negative correlation (r=–0.74). Multivariate analysis confirmed these correlations and the interactions between variables (age, height, weight, body surface). Graphs of estimated normal population-based TAPSE values adjusted by age and body surface are provided.
ConclusionsWe present reference values for TAPSE in Spanish children and adolescents. The TAPSE measurement was reproducible and associated directly with age and body surface. These reference values could guide decision making in daily clinical practice.
Keywords
The complex geometry of the right ventricle (RV) makes systolic function evaluation difficult. The thick trabeculae in the endocardial surface and muscular elongated outflow tract—located in a different plane to that of the inflow tract—prevent us from adopting the theoretical volumetric models that can be applied in the left ventricle.1, 2, 3, 4, 5 Moreover, RV geometry is even more complex in congenital heart disease, where it may lead to RV interventions.6 The RV functional situation can condition therapeutic management and clinical course in certain congenital abnormalities.7 Hence, in daily clinical practice, we need a means to reliably, reproducibly measure RV systolic function.8, 9
In M-mode echocardiography, tricuspid annular plane systolic excursion (TAPSE) measures the variation during the cardiac cycle in the situation of the lateral portion of the annulus of the tricuspid valve, from the apical 4-chamber view. TAPSE is an echocardiographic parameter that estimates RV systolic function adequately and correlates well with reference techniques like cardiac magnetic resonance imaging.10 Recommendations for echocardiographic evaluation of RV and TAPSE values in the adult population can be found in the literature.11, 12 Isolated, pioneering studies that establish reference values in children and adolescents have also been published.13 In Spain, however, adequate TAPSE reference values are not available.
The principle objective of the present study was to establish baseline TAPSE values in a sample of Spanish children and adolescents and determine the influence of anthropometric variables on those values.
METHODS PopulationFrom 1 January 2008 to 30 June 2010, we prospectively enrolled 405 children and adolescents (from newborn to age 18 years) of both sexes who had been referred to the pediatric cardiology service of our tertiary hospital for cardiac murmur studies. We did not include patients with other symptoms (dyspnea or its equivalent in infancy, chest pain, palpitations, etc.), patients diagnosed with any syndrome (eg, trisomy 21, monosomy 45), or patients with any other noncardiovascular diagnosis. We also excluded patients with a final diagnosis of structural heart disease or cardiac arrhythmia during the clinical consultation. At the time of patient assessment, we discounted the presence of noncardiovascular disease on the basis of the medical record.
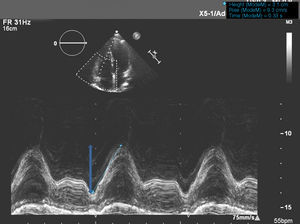
EchocardiographyWe performed a complete transthoracic echocardiography study (Philips iE-33; Philips Medical Systems, The Netherlands) with 5-1 and 8-3 Mhz probes. We followed a standard protocol —without angle correction or recording respiratory cycles— that included segment analysis of extra- and intracardiac relationships, excluded intracardiac defects and defects of the great arteries, and evaluated left ventricular function. We did not consider that patent foramen ovale of <2mm constituted a structural heart disease. We recorded heart rate (HR), weight, and height at the time of the echocardiographic study. A trained operator (>5 years experience) reviewed and reported on the echocardiograms and included in the study those patients considered normal according to the protocol. We measured TAPSE in 2-dimensional M-mode echocardiograms from the 4-chamber view, positioning the cursor on the lateral tricuspid annulus near the free RV wall and aligning it as close as possible to the apex of the heart (Figure 1).

Figure 1. Standard technique for measuring tricuspid annular plane systolic excursion using one-dimensional mode echocardiography.
Statistical AnalysisStatistical analysis was with SPSS 15.0 (SPSS; Illinois, United States) and R 2.11.0 (R Development Core Team)14 for raw data analysis. We considered TAPSE values had a normal distribution (demonstrated with a Q-Q plot graph, not shown). Values are expressed as mean±standard deviation (SD).. We present tables with percentiles and sample deviations. We include Z-score values. The Z-score of a variable is the position, expressed in terms of±SD, of the case observed with respect to the population mean. We analyzed differences between groups using Student t test or ANOVA—according to the number of variables studied—for quantitative variables, or chi-squared for qualitative variables. To compare the relationship between continuous variables and anthropometric characteristics of the sample, we used different regression models (curvilinear estimates including linear, logarithmic, inverse, squared, cubed, s, compound, potential and exponential). Finally, we used the closest univariate model to obtain correlation coefficients. We defined the curves describing sample trajectories by polynomial local regression (loess). To do so, we used the loess function15 of the basic R statistics installation.
We estimated mean TAPSE trajectories as a function of population age and body surface (BS) from sample data, using linear models including covariables defined from splines. We determined covariable matrices that defined splines by means of 3 squared functions obtained from B-spline-type base functions. We calculated spline curve significance using likelihood-ratio test and compared the complete model with reduced embedded models that included a simple linear regression. We calculated the design matrices used in the regression models that incorporated the covariables for age and BS transformed by B-splines16 with the splineDesign function of the R splines package.
To determine reproducibility of the measurements, we evaluated interobserver variability in 20 randomly selected cases by measuring the same parameters for different mutually blinded operators. We also determined intraobserver variability by measuring values again at >15 days after the cardiac sonographer first recorded them, calculating the intraclass correlation,17 and constructing Bland-Altman plots.
We established statistical significance as P <5% (2-tailed).
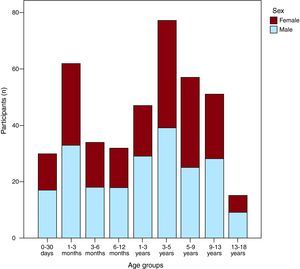
RESULTSThe study group consisted of 405 patients, 217 males (53%). Figure 2 shows the distribution of participants into age groups by sex. Table 1 gives population characteristics. We found no statistically significant differences in values of TAPSE, left ventricular ejection fraction, or anthropometric characteristics by sex.

Figure 2. Histogram of frequencies by age. Data for the male population (blue) and female population (garnet).
Table 1. Anthopometric Characteristics of Study Participants Classified as Total Cohort and Stratified by Sex
| Total | Female | Male | |
| Patients | 405 (100) | 189 (46.7) | 216 (53.3) |
| Age (years) | 4.12±4.29 | 4.19±4.28 | 4.08±4.4 |
| Weight (kg) | 18.05±16.07 | 18.26±14.74 | 18.7±17.17 |
| Height (cm) | 95.22±35.34 | 95.34±35 | 95.11±35.51 |
| HR (bpm) | 110.49 (30.04) | 111.02±28.28 | 110.02±31.56 |
| BS (m2) | 0.67±0.39 | 0.67±0.38 | 0.67±0.4 |
| TAPSE (mm) | 17.09±5.09 | 16.78±4.36 | 17.14±4.86 |
| LVEF (%) | 69.55±7.32 | 69.86±7.68 | 69.28±6.99 |
BS, body surface; HR, heart rate; LVEF, left ventricular ejection fraction; TAPSE, tricuspid annular plane systolic excursion.
Data are expressed as n (%) or mean±standard deviation.
In our sample, general mean TAPSE±2 SD was 17.09±5.09mm and ranged from 10.56±3.96mm in newborns to 20.95±6.54mm in the 13- to 18-year-old group.
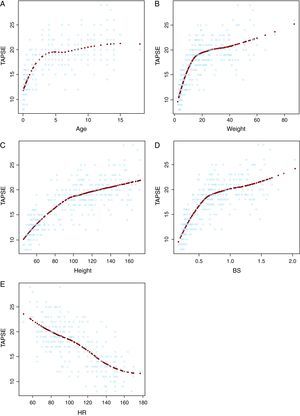
In univariate analysis, BS and age presented the best positive curvilinear correlations with TAPSE values (r=0.798 and r=0.81, respectively; P<.001), whereas HR maintained a negative correlation (r=–0.742; P<.001). Figure 3 shows the relationships between TAPSE and each of the aforementioned variables. In multivariate analysis, with results similar to those of univariate analysis, we constructed 2 models: one for linear relationships and the other for the curve (by splines) for age and BS. Both models highlight the same factors, revealing a triple interaction age-BS-HR and a simple interaction BS-sex (height and weight disappeared in the model once BS had been included). We found the same interactions between TAPSE and BS, age, and HR as in the linear relationships.

Figure 3. Loess curves for each variable with respect to tricuspid annular plane systolic excursion, indicating their sample distribution. A, TAPSE with reference to age. B, TAPSE with reference to weight. C, TAPSE with reference to height. D, TAPSE with reference to body surface. E, TAPSE with reference to heart rate. The TAPSE/heart rate relationship is inversely proportionate. BS, body surface; HR, heart rate; TAPSE, tricuspid annular plane systolic excursion.
Moreover, we observed a substantial reduction in the values measured in the sample with respect to age in the relationship between mean TAPSE adjusted for mean BS (Table 2), from mean BS 0.23 m2 with indexed TAPSE 45.91mm/m2 to mean BS 1.59 m2 with indexed TAPSE 45.91mm/m2.
Table 2. Sample Values for Tricuspid Annular Plane Systolic Excursion in Children and Adolescents, With 95% (± 2 Standard Deviations) and 99% (± 3 Standard Deviations) Confidence Intervals, a as a Function of Age Group. Mean Body Surface is Also Given, With Maximums and Minimums Stratified by Age
| Age | No | TAPSE (mm) | Body surface (m2) | Mean TAPSE BS-indexed | ||||
| Mean | ±2 SD (95%) | ±3 SD (99%) | Mean | Minimum | Maximum | |||
| 0-30 days | 30 | 10.56 | 6.614.52 | 4.6216.5 | 0.23 | 0.17 | 0.28 | 45.91 |
| 1-3 months | 62 | 12.96 | 9.2816.64 | 7.4418.48 | 0.28 | 0.21 | 0.44 | 46.28 |
| 3-6 months | 34 | 14.22 | 10.1218.32 | 8.0720.37 | 0.34 | 0.29 | 0.56 | 41.82 |
| 6-12 months | 32 | 15.17 | 9.1121.23 | 6.0824.26 | 0.41 | 0.29 | 0.56 | 37 |
| 1-3 years | 47 | 17.13 | 11.3322.93 | 8.4325.83 | 0.54 | 0.27 | 0.75 | 31.72 |
| 3-5 years | 77 | 19.36 | 14.1224.6 | 11.527.22 | 0.72 | 0.32 | 1.07 | 26.88 |
| 5-9 years | 57 | 19.33 | 13.615.05 | 10.7527.91 | 0.93 | 0.52 | 1.35 | 20.78 |
| 9-13 years | 51 | 21.01 | 14.6927.33 | 11.5330.49 | 1.28 | 0.46 | 1.7 | 16.41 |
| 13-18 years | 15 | 20.95 | 14.4127.49 | 11.1430.76 | 1.59 | 1.33 | 2.04 | 13.17 |
BS, body surface; SD, standard deviation; TAPSE, tricuspid annular plane systolic excursion.
a In fact,±2.56 SD corresponds to the 99% confidence interval and ± 3 SD would be 99.7% in a normal distribution.
Sample TAPSE percentiles corresponding to each age group are in Table 3; percentiles corresponding to BS are in Table 4.
Table 3. Percentiles of Tricuspid Annular Plane Systolic Excursion Values in the Sample, by Age Group
| Age | No | p5 | p10 | p25 | p50 | p75 | p90 | p95 |
| 0-30 days | 30 | 7.8 | 8.01 | 8.99 | 10.7 | 11.95 | 13.36 | 14.59 |
| 1-3 months | 62 | 10 | 11 | 11.9 | 12.85 | 13.73 | 15.87 | 16.34 |
| 3-6 months | 34 | 11.15 | 11.7 | 12.58 | 13.65 | 16 | 17.35 | 17.9 |
| 6-12 months | 32 | 10.86 | 12 | 13.08 | 14.55 | 17.7 | 20 | 21.35 |
| 1-3 years | 47 | 12.3 | 13.24 | 15 | 17.2 | 19 | 21.2 | 22.3 |
| 3-5 years | 77 | 15.5 | 16.44 | 17.8 | 19 | 21 | 22.1 | 23.92 |
| 5-9 years | 57 | 14.7 | 15.94 | 17.5 | 19 | 20.85 | 23.66 | 25 |
| 9-13 years | 51 | 15.24 | 17.1 | 19 | 21.5 | 23 | 24.96 | 27.2 |
| 13-18 years | 15 | 15.5 | 17 | 18 | 20.8 | 23 | 26.8 | 28 |
Table 4. Percentiles of Tricuspid Annular Plane Systolic Excursion Values in the Sample by Body Surface
| Body surface | No | p5 | p10 | p25 | p50 | p75 | p90 | p95 |
| 0-0.25 m2 | 31 | 7.8 | 8.02 | 9 | 10.9 | 11.5 | 12.94 | 13 |
| 0.26-0-5 m2 | 142 | 10.92 | 11.4 | 12.5 | 13.55 | 15.63 | 17.7 | 19 |
| 0.51-0.75 m2 | 91 | 13.18 | 14.12 | 16.8 | 18.5 | 20 | 22 | 23.32 |
| 0.76-1 m2 | 63 | 15.14 | 16.88 | 17.7 | 19 | 21 | 22 | 24.36 |
| 1.01-1.25 m2 | 31 | 16.9 | 17.7 | 19 | 21 | 22.7 | 23.36 | 25 |
| 1.26-1.5 m2 | 29 | 14.6 | 15.5 | 18 | 19.7 | 23.25 | 25 | 27.25 |
| 1.51-1.75 m2 | 15 | 18 | 18 | 19.3 | 21.5 | 25 | 27.2 | 28.4 |
| 1.76-2.04 m2 a | 3 | 20 | 20 | 20 | 23 | 23 | 26.8 | 28 |
a Limited due to the scant number of participants within this body surface range.
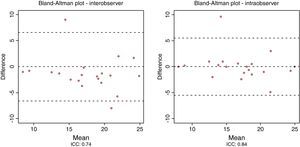
TAPSE measurement showed good inter- and intraobserver concordance (IC=0.74 and IC=0.84, respectively). Figure 4 shows this concordance in Bland-Altman plots.

Figure 4. Bland-Altman plots evaluating inter- (A) and intraobserver (B) concordance for tricuspid annular plane systolic excursion. ICC, intraclass correlation coefficient.
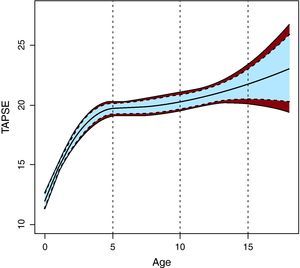
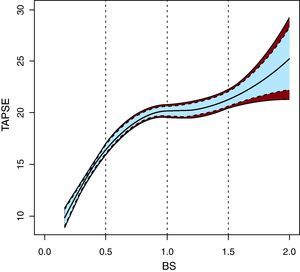
In terms of the population, spline estimates indicated age-related expected mean TAPSE values (Z-score), with 95% (Z-score±1) and 99% confidence intervals (Figure 5). Figure 6 shows the BS-related mean TAPSE values.

Figure 5. Graph showing, as a function of age, the estimated population-wide mean values of tricuspid annular plane systolic excursion in normal children and adolescents in Spain (Z-score), together with 95% (dotted line, Z-score±1) and 99% (continuous line) confidence intervals, which are appropriate and accessible in daily clinical practice in a pediatric echocardiography laboratory. TAPSE, tricuspid annular plane systolic excursion.

Figure 6. Graph showing, as a function of body surface, the estimated population-wide mean values for tricuspid annular plane systolic excursion in normal children and adolescents in Spain (Z-score), together with 95% (dotted line, Z-score±1) and 99% (continuous line) confidence intervals, which are appropriate and accessible in daily clinical practice in a pediatric echocardiography laboratory. BS, body surface; TAPSE, tricuspid annular plane systolic excursion.
DISCUSSIONWe present, for the first time in Spain, the normal values for TAPSE in a sample of children and adolescents adjusted by age and BS. In consonance with other pioneering studies of children and adolescents,13 we present reference values to guide diagnostic and therapeutic decision making with no need to extrapolate data from the adult population.
In our study, the relationship between TAPSE and weight, height, and BS was positive. In contrast to adults, when studying reference values in children and adolescents, the difficulty lies in the development-related changes that determine the marked dependence of many anthropometric variables on the maturity of the individual being studied.18 The nature of this dependence is known for many RV echocardiographic variables, such as the Tei index.19 Our findings coincide with those reported by Koestenberger, who found a positive correlation of TAPSE measurement with BS and age, with a more rapid progression in newborn and lactating infants than in older children and adolescents, quite like that described in the present study.13 On the other hand, the relation between TAPSE and HR was linear and negative. Although not all studies have found HR has a clear influence on tricuspid annular plane movement,20 in our case the relationship may be due to the inverse association of age and HR that occurs from birth to maturity, as indicated in the multivariate model with its numerous, complex interactions.
Measuring TAPSE as a parameter to evaluate RV systolic function was reproducible. In our study, we found good inter- and intraobserver concordance for TAPSE,17 in line with published recommendations21 and in parallel with other studies conducted in different circumstances.22 This same conclusion about reproducibility has been reached by other methods.13 Moreover, in contrast to other less readily available (magnetic resonance [MR] imaging) or more invasive (diagnostic right catheterization) techniques, this method is accessible in any pediatric echocardiography laboratory. Future studies will probably be needed to determine the clinical role of TAPSE measurement in children and adolescents.
LimitationsThe values presented for older age groups should be taken with caution due to the relatively small number of patients included. Notwithstanding, in the oldest age range, adult group values could be applied. It may also be necessary to validate results in future studies with a second independent sample of children. Without a reference pattern to compare right ventricular function, we could not discern possible effects on ventricular function when values were within the normal range.
CONCLUSIONSWe present TAPSE reference values for normal Spanish children and adolescents. TAPSE values depended on age but not on sex and were directly proportionate to BS and inversely proportionate to HR. This information —presented in percentiles, nomograms and Z-scores— could be used to help with decision making in daily clinical practice.
CONFLICTS OF INTERESTNone declared.
Received 31 October 2010
Accepted 12 April 2011
Corresponding author: Unidad Coronaria, Instituto Cardiovascular, Hospital Clínico San Carlos, Avda. Profesor Martín Lagos s/n, 28040 Madrid, Spain. ibnsky@yahoo.es