Intracoronary ultrasound estimation of the functional significance of intermediate angiographic lesions has mainly been based on measuring the minimal lumen area. These estimates take no account of lesion length and pay insufficient attention to long coronary lesions.
MethodsWe included 61 lesions with visual angiographic stenosis of 40% to 70% that required treatment with a ≥20mm stent, studied with ultrasound and fractional flow reserve. Three-dimensional analysis of the ultrasound study was conducted offline and blinded to fractional reserve values. Angiographic and ultrasound parameters were correlated with fractional reserve.
ResultsFrom the angiography we obtained data on mean reference diameter (2.87 [0.57] mm), length (29.8 [10.01] mm), and severity of stenosis (50.3% [8.7]%). Mean fractional flow reserve was 0.78 (0.09). We found a weak linear correlation (R) between fractional reserve and the ultrasound parameters that did not include lesion length: fractional reserve-minimal luminal area (R=0.4; P=.003). The correlation was stronger when lesion length was included: fractional reserve–volume of plaque (R=–0.65; P<.0005); fractional reserve–length/mean luminal area (R=0.73; P<.0005). The strongest correlation came from the product of mean stenosis by area multiplied by lesion length (R=−0.78; P<.0005).
ConclusionsIn long coronary lesions, the correlation between ultrasound-measured minimal lumen area and functional significance is weak. In these cases, estimates of functional significance should incorporate lesion length or be derived from direct fractional flow reserve measurement.
Keywords
.
INTRODUCTIONThe percentage of stenosis as obtained by angiography and the angiographic characteristics of the lesion continue to be useful and constitute the most commonly-used method of deciding on the revascularization of a coronary lesion. Their limitations are known, especially in the presence of complex anatomy and, above all, when the degree of angiographic stenosis is in the intermediate value range.1,2 The validity of fractional flow reserve (FFR)—measured by using an intracoronary pressure wire to determine the need to revascularize dubious or intermediate angiographically significant lesions—has been proven,3,4 leading to its increased use in recent years.5 The usefulness of intracoronary ultrasound (IVUS), also typically used to decide on revascularization when angiographic measures are unclear, has been questioned in recent studies that have compared IVUS with FFR.6–8
Both coronary angiography (>70% stenosis by diameter) and IVUS9 (>4mm2 minimal lumen area [MLA] or >2mm2 minimal lumen diameter), the most frequently-used criteria to defer or to indicate revascularization, are based on measurements taken at a specific point on the lesion and take no account of lesion length. This is at odds with the classic flow dynamics equation, in which the resistance to flow across stenosis depends on length as well as stenosis diameter or significance.10,11 Neither does the decision based on focal measures of diameter or minimum areas take into account the existence of tandem lesions or diffusely-diseased segments that might condition flow, independently or in addition to the maximum degree of stenosis measured at a specific point.
In a series of long lesions, the present study compares IVUS parameters obtained using automatic withdrawal and 3-dimensional reconstruction with the FFR value determined in the same lesion.
METHODSDesign and Patients EnrolledProspective observational cohort study of patients undergoing coronary angiography for suspected coronary disease between 1 January 2009 and 31 May 2010. In all patients, a pressure wire and IVUS were used for decision-making on revascularization of a coronary lesion of intermediate severity (visually-estimated 40%-70% diameter stenosis) and long enough to require a ≥20mm stent, if treatment was indicated.
We excluded lesions in a vessel irrigating the previously-infarcted zone, clearly unstable lesions (presence of thrombus, ulcerations, or <3 thrombolysis in myocardial infarction flow), patients contraindicated for adenosine, and those declining to give written informed consent. We also excluded patients in whom the lesion under study had other proximal or distal lesions with >20% visual stenosis. Finally, we excluded lesions that might trigger ST-segment elevation acute coronary syndrome, as a pressure wire is not normally used to evaluate this type of lesion in our laboratory.
ProcedureOn deciding to perform the invasive study, the diagnostic catheter used for coronary angiography was replaced by a 6 Fr catheter guidewire. With this catheter, we repeated the projections that had obtained the best possible view of the lesion, showing the most visible stenosis with no superimposed branches or length loss due to curvature. Before introducing the intracoronary guidewire, all patients received intravenous sodium heparin at 100UI/kg weight, if this had not previously been administered. Functional measurement was with a 0.014″ intracoronary pressure wire (Pressure Wire, Radi Medical Systems; Uppsala, Sweden or PrimeWire, Volcano Corp.; San Diego, California, United States). The guidewire was calibrated externally and then advanced to the distal tip of the guiding catheter, checking the balance between the pressure curves in the catheter an en the FFR measuring system required it. After administering 200-300μg intracoronary d pressure wire, equalizing them as needed or wh nitroglycerine, the guidewire was advanced until the sensor was at least 20mm distal of the lesion under study. We measured FFR by administering 300-1200μg intracoronary adenosine, taking special care to avoid wedging the catheter in the coronary ostium after bolus injection of the drug. We determined FFR using the ratio, beat by beat, between mean aortic pressure at the tip of the guidewire catheter and mean pressure distal to the lesion recorded with the pressure wire, in maximum hyperemia. We measured FFR at least 3 times and used the lowest of the readings. We attempted a >600μg dose of intracoronary adenosine if a smaller amount failed to produce asystole ≥6s.
Following the pressure wire study, we administered another 200-300μg intracoronary nitroglycerin and introduced the IVUS catheter (Atlantis Pro, Boston Scientific Co.; Boston, Massachussetts, United States) through the same intracoronary guidewire until it was at least 20mm distal of the target lesion. We then performed automatic withdrawal at 0.5mm/s, ending in the guiding catheter when <100mm withdrawal length permitted this. Any decision on revascularization was at the discretion of the operator, based on functional and ultrasound study data.
Quantitative Coronary AngiographyAngiographic and ultrasound records were assessed offline by 2 experienced interventional cardiologists (RL and PC) who, although they might have participated in the procedures, were blinded to the functional assessment results when they were measured. Quantitative coronary angiography (QCA) was conducted with a contrast-filled catheter for calibration. Reference segments and percent stenosis were measured at end-diastole, in the projection showing the highest degree of severity. Lesion length was determined in the projection showing least shortening. Following a previous study,11 we used direct measurements of length (LQCA), proximal and distal reference diameter (obtained in the 5mm adjacent to the proximal and distal limits of the lesion), minimal lumen diameter, (MLDQCA), and mean lesion lumen diameter (MLLDQCA) to calculate the following indices: reference diameter (REFDQCA)=mean of the proximal and distal reference diameters; percent stenosis by maximum diameter (%SMAXDQCA)=100×(REFDQCA−MLDQCA)/REFDQCA; percent stenosis by mean diameter (%SMEDDQCA)=100×(REFDQCA−MLLDQCA)/REFDQCA; %SMAXDQCA×LQCA; %SMEDDQCA×LQCA; LQCA/MLDQCA; and LQCA/MLLDQCA. Analysis was with QAngio XA 7.1.43.0 software (Medis Medical Imaging Systems; Leiden, The Netherlands).
Intracoronary Ultrasound Quantification StudyThree-dimensional quantification of the IVUS images was also blind to the functional assessment results. After automatic tracing of the vessel areas and artery lumen, frame-to-frame correction was performed. We considered the proximal and distal reference areas to be the mean areas of the 5mm adjacent to the proximal and distal edges of the lesion. The points at which the lesion began and ended were judged by the interventional cardiologist taking the measurement, using angiographic anatomy references in the few cases when this was considered necessary.
The software automatically determined MLA after corrections were made for the intima and external elastic lamina edges. The software automatically calculates lesion plaque volume (vessel volume−lumen volume) and mean lumen area. For each lesion, we calculated theoretical conus truncus volume corresponding to the proximal and distal reference areas and lesion length (VOLTCONOIVUS). We used direct measurements of length (LIVUS), proximal and distal reference areas (MLAIVUS), mean lesion lumen area (MLLAIVUS), vessel volume in the lesion segment (VESVLSIVUS), and lumen volume in the lesion segment (LVOLLSIVUS) to calculate the following indices: reference area (REFAIVUS)=mean proximal and mean distal reference areas; percent stenosis by maximum area (%SMAXAIVUS)=100×(REFAIVUS−MLLAIVUS)/REFAIVUS; percent stenosis by mean area (%MEALSIVUS)=100×(REFAIVUS−MLLAIVUS)/REFAIVUS; LIVUS/MLAIVUS; LIVUS/MLLAIVUS; %SMAXAIVUS×LIVUS; %MEALSIVUS×LIVUS; LVOLLSIVUS/VESVLSIVUS; and LVOLLSIVUS/VOLTCONOIVUS. Analysis was done with QCU-CMS 4.1 software (Medis Medical Imaging Systems; Leiden, The Netherlands).
Statistical AnalysisQuantitative variables are expressed as mean (standard deviation) and qualitative variables as absolute values and percentage. We performed several linear correlation studies to determine the Pearson correlation coefficient between observed FFR and the angiography and IVUS-derived indices. The predictive value of FFR <0.80 for the angiographic and ultrasound indices was estimated with the corresponding receiver operating characteristic (ROC) curve. From this, we estimated the best cutoff points for each parameter, with their corresponding sensitivity, specificity, and positive and negative predictive values. We chose the cutoff points for which the sum of the sensitivity and specificity values was highest. Analysis was with SPSS 15.0 for Windows (SPSS Inc.; Chicago, Illinois, United States) and SigmaPlot for Windows 11.0 (Systat Software Inc.; Chicago, Illinois, United States).
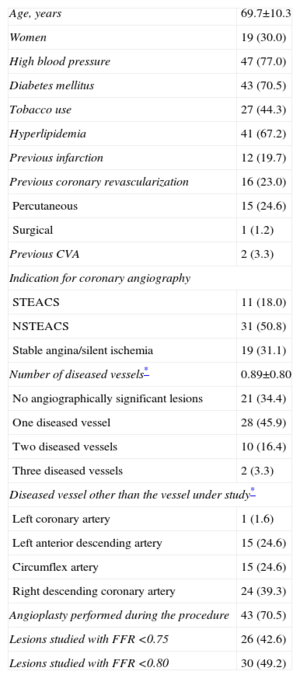
RESULTSDuring the study period, our laboratory conducted 282 intracoronary pressure wire studies. Of these, 191 failed to meet the inclusion criteria, 18 presented several lesions in the vessel where the pressure wire study was performed, and in 12 patients the operator decided to perform only the pressure wire study. We finally included 61 lesions studied in 61 patients. Baseline patient characteristics are presented in Table 1. Up to 70% of patients had diabetes mellitus. In most of the patients, coronary angiography was indicated for acute coronary syndrome. In 69% of patients, we found angiographically significant lesions in a vessel other than that under study. In 43% of the lesions studied, FFR was <0.75; in 49%, FFR was <0.80.
Baseline Characteristics of Patients (n=61)
| Age, years | 69.7±10.3 |
| Women | 19 (30.0) |
| High blood pressure | 47 (77.0) |
| Diabetes mellitus | 43 (70.5) |
| Tobacco use | 27 (44.3) |
| Hyperlipidemia | 41 (67.2) |
| Previous infarction | 12 (19.7) |
| Previous coronary revascularization | 16 (23.0) |
| Percutaneous | 15 (24.6) |
| Surgical | 1 (1.2) |
| Previous CVA | 2 (3.3) |
| Indication for coronary angiography | |
| STEACS | 11 (18.0) |
| NSTEACS | 31 (50.8) |
| Stable angina/silent ischemia | 19 (31.1) |
| Number of diseased vessels* | 0.89±0.80 |
| No angiographically significant lesions | 21 (34.4) |
| One diseased vessel | 28 (45.9) |
| Two diseased vessels | 10 (16.4) |
| Three diseased vessels | 2 (3.3) |
| Diseased vessel other than the vessel under study* | |
| Left coronary artery | 1 (1.6) |
| Left anterior descending artery | 15 (24.6) |
| Circumflex artery | 15 (24.6) |
| Right descending coronary artery | 24 (39.3) |
| Angioplasty performed during the procedure | 43 (70.5) |
| Lesions studied with FFR <0.75 | 26 (42.6) |
| Lesions studied with FFR <0.80 | 30 (49.2) |
CVA, cerebrovascular accident; FFR, fractional flow reserve; NSTEACS, non-ST segment elevation acute coronary syndrome; STEACS, ST-segment elevation acute coronary syndrome.
Data are expressed as no. (%) or mean±standard deviation.
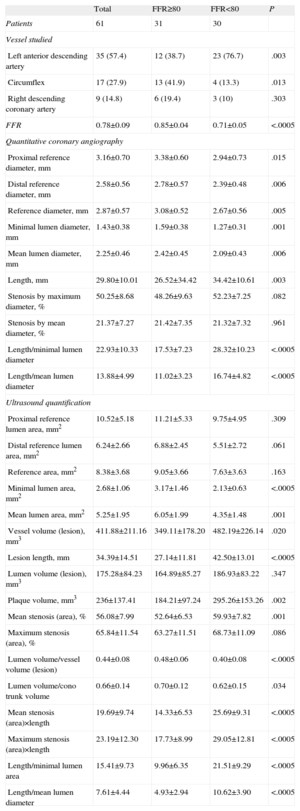
Angiographic and ultrasound characteristics of the lesions, in general and according to whether or not they presented FFR <0.80, are shown in Table 2. Mean angiographic reference diameter was 2.87 (0.70) mm, with mean length of 29.80 (10.01) mm and mean degree of stenosis 50.25% (8.68)%. Lesions with <0.80 FFR had significantly smaller reference diameters, smaller minimum lumen diameters, and greater length. However, maximum and mean degree of stenosis were not significantly greater.
Angiographic Characteristics of Lesions According to Fractional Flow Reserve Cutoff Point at 0.80
| Total | FFR≥80 | FFR<80 | P | |
| Patients | 61 | 31 | 30 | |
| Vessel studied | ||||
| Left anterior descending artery | 35 (57.4) | 12 (38.7) | 23 (76.7) | .003 |
| Circumflex | 17 (27.9) | 13 (41.9) | 4 (13.3) | .013 |
| Right descending coronary artery | 9 (14.8) | 6 (19.4) | 3 (10) | .303 |
| FFR | 0.78±0.09 | 0.85±0.04 | 0.71±0.05 | <.0005 |
| Quantitative coronary angiography | ||||
| Proximal reference diameter, mm | 3.16±0.70 | 3.38±0.60 | 2.94±0.73 | .015 |
| Distal reference diameter, mm | 2.58±0.56 | 2.78±0.57 | 2.39±0.48 | .006 |
| Reference diameter, mm | 2.87±0.57 | 3.08±0.52 | 2.67±0.56 | .005 |
| Minimal lumen diameter, mm | 1.43±0.38 | 1.59±0.38 | 1.27±0.31 | .001 |
| Mean lumen diameter, mm | 2.25±0.46 | 2.42±0.45 | 2.09±0.43 | .006 |
| Length, mm | 29.80±10.01 | 26.52±34.42 | 34.42±10.61 | .003 |
| Stenosis by maximum diameter, % | 50.25±8.68 | 48.26±9.63 | 52.23±7.25 | .082 |
| Stenosis by mean diameter, % | 21.37±7.27 | 21.42±7.35 | 21.32±7.32 | .961 |
| Length/minimal lumen diameter | 22.93±10.33 | 17.53±7.23 | 28.32±10.23 | <.0005 |
| Length/mean lumen diameter | 13.88±4.99 | 11.02±3.23 | 16.74±4.82 | <.0005 |
| Ultrasound quantification | ||||
| Proximal reference lumen area, mm2 | 10.52±5.18 | 11.21±5.33 | 9.75±4.95 | .309 |
| Distal reference lumen area, mm2 | 6.24±2.66 | 6.88±2.45 | 5.51±2.72 | .061 |
| Reference area, mm2 | 8.38±3.68 | 9.05±3.66 | 7.63±3.63 | .163 |
| Minimal lumen area, mm2 | 2.68±1.06 | 3.17±1.46 | 2.13±0.63 | <.0005 |
| Mean lumen area, mm2 | 5.25±1.95 | 6.05±1.99 | 4.35±1.48 | .001 |
| Vessel volume (lesion), mm3 | 411.88±211.16 | 349.11±178.20 | 482.19±226.14 | .020 |
| Lesion length, mm | 34.39±14.51 | 27.14±11.81 | 42.50±13.01 | <.0005 |
| Lumen volume (lesion), mm3 | 175.28±84.23 | 164.89±85.27 | 186.93±83.22 | .347 |
| Plaque volume, mm3 | 236±137.41 | 184.21±97.24 | 295.26±153.26 | .002 |
| Mean stenosis (area), % | 56.08±7.99 | 52.64±6.53 | 59.93±7.82 | .001 |
| Maximum stenosis (area), % | 65.84±11.54 | 63.27±11.51 | 68.73±11.09 | .086 |
| Lumen volume/vessel volume (lesion) | 0.44±0.08 | 0.48±0.06 | 0.40±0.08 | <.0005 |
| Lumen volume/cono trunk volume | 0.66±0.14 | 0.70±0.12 | 0.62±0.15 | .034 |
| Mean stenosis (area)×length | 19.69±9.74 | 14.33±6.53 | 25.69±9.31 | <.0005 |
| Maximum stenosis (area)×length | 23.19±12.30 | 17.73±8.99 | 29.05±12.81 | <.0005 |
| Length/minimal lumen area | 15.41±9.73 | 9.96±6.35 | 21.51±9.29 | <.0005 |
| Length/mean lumen diameter | 7.61±4.44 | 4.93±2.94 | 10.62±3.90 | <.0005 |
FFR, fractional flow reserve.
Data are expressed as no. (%) or mean±standard deviation.
Mean ultrasound lesion MLA was 2.68 (1.06) mm2, with mean length 34.39 (14.51) mm. Lesions with <0.80 FFR presented significantly smaller MLA, greater length, higher plaque volume, and other parameters associated with a higher degree of stenosis and greater length.
Length measured by IVUS was a mean 4.16 (12.8) mm greater than length measured by QCA (P=.025).
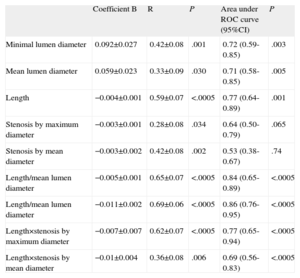
In linear regression models, linear correlation with FFR was weak for all the angiographic parameters analyzed (Table 3), although it was comparatively stronger in those that include the length of the lesion studied. Parameters including length also showed the best predictive values with FFR cutoff point<0.80, according to the corresponding ROC curves (Table 3). The best cutoff value for angiographically-derived percent stenosis was 45.6% stenosis (sensitivity, 86.2%; specificity, 48.3%) and 26.5mm lesion length (sensitivity, 86.2%; specificity, 58.6%).
Analysis of Linear Correlation Between Angiographic Parameters and Fractional Flow Reserve Value. Areas Under the Receiver Operating Characteristic Curve for <0.80 Fractional Flow Reserve Cutoff Point
| Coefficient B | R | P | Area under ROC curve (95%CI) | P | |
| Minimal lumen diameter | 0.092±0.027 | 0.42±0.08 | .001 | 0.72 (0.59-0.85) | .003 |
| Mean lumen diameter | 0.059±0.023 | 0.33±0.09 | .030 | 0.71 (0.58-0.85) | .005 |
| Length | −0.004±0.001 | 0.59±0.07 | <.0005 | 0.77 (0.64-0.89) | .001 |
| Stenosis by maximum diameter | −0.003±0.001 | 0.28±0.08 | .034 | 0.64 (0.50-0.79) | .065 |
| Stenosis by mean diameter | −0.003±0.002 | 0.42±0.08 | .002 | 0.53 (0.38-0.67) | .74 |
| Length/mean lumen diameter | −0.005±0.001 | 0.65±0.07 | <.0005 | 0.84 (0.65-0.89) | <.0005 |
| Length/mean lumen diameter | −0.011±0.002 | 0.69±0.06 | <.0005 | 0.86 (0.76-0.95) | <.0005 |
| Length×stenosis by maximum diameter | −0.007±0.007 | 0.62±0.07 | <.0005 | 0.77 (0.65-0.94) | <.0005 |
| Length×stenosis by mean diameter | −0.01±0.004 | 0.36±0.08 | .006 | 0.69 (0.56-0.83) | <.0005 |
95%CI, 95% confidence interval; ROC, receiver operating characteristic.
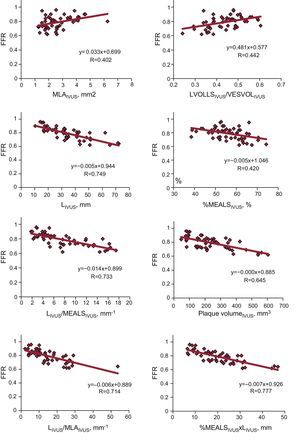
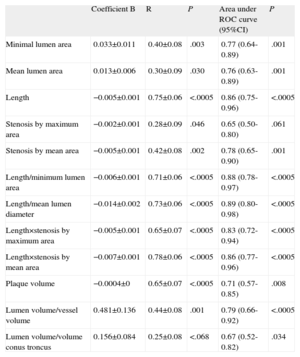
In linear regression models using the IVUS parameters analyzed and FFR value obtained (Table 4 and Fig. 1), the linear correlations were also weak, although they were stronger than those observed using the angiographic parameters. The strongest linear correlations and best predictive values with the ROC curve-derived FFR cutoff point <0.80 were found—as with the angiographic parameters—in those including lesion length: LIVUS, LIVUS/MLAIVUS×LIVUS/MLLAIVUS, %SMAXAIVUS×LIVUS, %MEALSIVUS×LIVUS. None of the volumetric parameters analyzed showed a strong correlation with the FFR values obtained.
Analysis of Linear Correlation Between Ultrasound Parameters and Fractional Flow Reserve Value. Areas Under Receiver Operating Characteristic Curve for <0.80 Fractional Flow Reserve Cutoff Point
| Coefficient B | R | P | Area under ROC curve (95%CI) | P | |
| Minimal lumen area | 0.033±0.011 | 0.40±0.08 | .003 | 0.77 (0.64-0.89) | .001 |
| Mean lumen area | 0.013±0.006 | 0.30±0.09 | .030 | 0.76 (0.63-0.89) | .001 |
| Length | −0.005±0.001 | 0.75±0.06 | <.0005 | 0.86 (0.75-0.96) | <.0005 |
| Stenosis by maximum area | −0.002±0.001 | 0.28±0.09 | .046 | 0.65 (0.50-0.80) | .061 |
| Stenosis by mean area | −0.005±0.001 | 0.42±0.08 | .002 | 0.78 (0.65-0.90) | .001 |
| Length/minimum lumen area | −0.006±0.001 | 0.71±0.06 | <.0005 | 0.88 (0.78-0.97) | <.0005 |
| Length/mean lumen diameter | −0.014±0.002 | 0.73±0.06 | <.0005 | 0.89 (0.80-0.98) | <.0005 |
| Length×stenosis by maximum area | −0.005±0.001 | 0.65±0.07 | <.0005 | 0.83 (0.72-0.94) | <.0005 |
| Length×stenosis by mean area | −0.007±0.001 | 0.78±0.06 | <.0005 | 0.86 (0.77-0.96) | <.0005 |
| Plaque volume | −0.0004±0 | 0.65±0.07 | <.0005 | 0.71 (0.57-0.85) | .008 |
| Lumen volume/vessel volume | 0.481±0.136 | 0.44±0.08 | .001 | 0.79 (0.66-0.92) | <.0005 |
| Lumen volume/volume conus troncus | 0.156±0.084 | 0.25±0.08 | <.068 | 0.67 (0.52-0.82) | .034 |
95%CI, 95% confidence interval; ROC, receiver operating characteristic.

Graph of linear correlation between intracoronary ultrasound parameters and fractional flow reserve value. %MEALS, percentage by mean area of lesion stenosis; FFR, fractional flow reserve; IVUS, intracoronary ultrasound; L, lesion length; LVOLLS, lumen volume for lesion length; MLA, minimal lumen area; MLLA, mean lesion lumen diameter; VESVOL, vessel volume for lesion length.
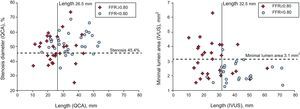
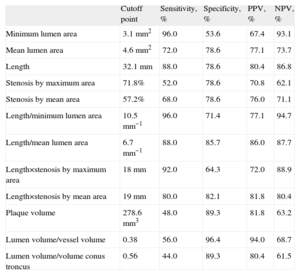
The best cutoff points for each ultrasound parameter analyzed are shown in Table 5. Figure 2 shows the classification power of the angiographic (%SMAXDQCA and LQCA) and ultrasound (MLAIVUS and LIVUS) cutoff points, which were better for the ultrasound parameters chosen. Joint use of the two angiographic cutoff points (maximum degree of stenosis and length) to predict <0.80 FFR showed a sensitivity of 72.4%; specificity, 79.3%; positive predictive value, 77.8%; and negative predictive value, 74.2%. Joint use of the two ultrasound cutoff points (MLAIVUS <3.1mm2 and LIVUS >32.5mm) had a sensitivity of 84.0%; specificity, 85.7%; positive predictive value, 84.0%; and negative predictive value, 85.7%.
Best Cutoff Points to Obtain <0.80 Fractional Flow Reserve for Intracoronary Ultrasound Parameters Derived From Receiver Operating Characteristic Curves
| Cutoff point | Sensitivity, % | Specificity, % | PPV, % | NPV, % | |
| Minimum lumen area | 3.1mm2 | 96.0 | 53.6 | 67.4 | 93.1 |
| Mean lumen area | 4.6mm2 | 72.0 | 78.6 | 77.1 | 73.7 |
| Length | 32.1mm | 88.0 | 78.6 | 80.4 | 86.8 |
| Stenosis by maximum area | 71.8% | 52.0 | 78.6 | 70.8 | 62.1 |
| Stenosis by mean area | 57.2% | 68.0 | 78.6 | 76.0 | 71.1 |
| Length/minimum lumen area | 10.5mm−1 | 96.0 | 71.4 | 77.1 | 94.7 |
| Length/mean lumen area | 6.7mm−1 | 88.0 | 85.7 | 86.0 | 87.7 |
| Length×stenosis by maximum area | 18mm | 92.0 | 64.3 | 72.0 | 88.9 |
| Length×stenosis by mean area | 19mm | 80.0 | 82.1 | 81.8 | 80.4 |
| Plaque volume | 278.6mm3 | 48.0 | 89.3 | 81.8 | 63.2 |
| Lumen volume/vessel volume | 0.38 | 56.0 | 96.4 | 94.0 | 68.7 |
| Lumen volume/volume conus troncus | 0.56 | 44.0 | 89.3 | 80.4 | 61.5 |
NPV, negative predictive value; PPV, positive predictive value.
 and ultrasound parameters (right panel), with the cutoff points for each parameter. Crosses, lesions with fractional flow reserve≥0.80; circles, lesions with fractional flow reserve<0.80; FFR, fractional flow reserve; IVUS, intracoronary ultrasound; QCA, quantitative coronary angiography.")
Graph of dispersion between most frequently used angiographic parameters (left panel) and ultrasound parameters (right panel), with the cutoff points for each parameter. Crosses, lesions with fractional flow reserve≥0.80; circles, lesions with fractional flow reserve<0.80; FFR, fractional flow reserve; IVUS, intracoronary ultrasound; QCA, quantitative coronary angiography.
The present study shows the limitations of IVUS to determine the functional significance of long coronary lesions that are angiographically moderate and the importance of considering length as one of the most significant parameters when estimating the functional significance of this lesion type. Our observation of almost 50% of lesions with FFR <0.80 contrasts with the nearly 30% of functionally significant lesions observed in published series12,13 even though the lesions included have similar degrees of stenosis. These data alone underline the importance of lesion length to functional significance.
We have recently published a study showing the limitation of angiography and the importance of coronary lesion length for functional significance in a subgroup of lesions selected in exactly the same way as in the present study: angiographically moderate lesions of a length requiring the implantation of >20mm stents should percutaneous treatment be undertaken.14 One limitation of this study derives from the inherent limitation of angiography to correctly determine degree of stenosis and extent of coronary disease. The IVUS increases the accuracy with which we can determine lesion diameter and minimum lesion area, the reference data needed to assess degree of stenosis and coronary lesion length.15–17 The present study shows that the predictive value of ultrasound parameters including lesion length can correlate better than angiography with intracoronary pressure wire-derived functional significance but they also present numerous classification errors, especially false positives.
The IVUS was proposed as a reliable means of estimating the functional significance of a coronary lesion. The most frequently used ultrasound parameter is MLA, with cutoff points that vary according to the type of lesion involved and the study.9,18–20 More recent studies point to IVUS limitations in determining functional significance of angiographically intermediate lesions with stenosis, although most center on focal ultrasound parameters (principally MLA) without taking account of lesion length. These studies include lesions of a mean length <15mm7,8,21,22 and, reasonably enough in such short lesions, MLA may not be as important as in longer lesions and the linear correlation with FFR may be weak or nonexistent.
This deficient correlation between MLAIVUS and FFR has been explained in different ways. Lesion length is one reason different FFR values occur despite identical MLA. The effect of length, of limited relevance in <15mm lesions, can increase when assessing long coronary stenoses such as those in the present study. Other factors involved in direct functional assessment using FFR23,24 (myocardial territory size, microvascular disease, or vessel size) and not involved in purely anatomic assessment using IVUS may determine the deficient IVUS-FFR correlation despite their taking lesion length into account. For example, the existence of microvascular damage can limit maximum achievable coronary flow in a specific myocardial territory because it impedes vasodilation, hence the possibly minimal contribution of stenosis (despite reduced MLA) to limiting maximum blood flow reaching this myocardial zone.
In a recent study, Lee et al.25 established a length of 20mm, together with an MLA value, as a cutoff point to estimate FFR <0.80 for <3mm arteries. The predictive value of length in their study was lower than that found in ours, although the authors included lesions with a mean length of 17.9mm, whereas in our study the lesions measured >34mm. In the same study, a combination of focal parameters (MLA) with others that included lesion length (plaque burden and length itself) presented the best predictive value, as it did in our study.
We have found that a combination of the ultrasound parameters of <3.1mm2 MLA with >32.5mm length was associated with >80% sensitivity, specificity, and predictive values. It is beyond the scope of the present study to analyze whether this cutoff point, composed of 2 joint measures, is equally valid for the 3 coronary vessels and all their segments. We believe the relatively high measures of diagnostic validity found for this composite cutoff point further underline the importance of taking lesion length into account if it is decided not to use the functional measure to indicate for revascularization of this lesion type.
Our study has failed to find a volumetric parameter that correlates well with FFR. Volume of plaque was the best parameter, ahead of those in which length intervened. The volumetric relations of lumen volume/vessel volume and lumen volume/theoretical conus troncus volume had a weak correlation with FFR. The presence of different degrees of artery remodeling can mean relations between volumes do not associate with increased deterioration of coronary flow. This weak correlation can even be considered as an expression of the adaptive significance of coronary artery remodeling in response to growth of atheromatous plaque.15,26
LimitationsThis single-center study only included long lesions, in the absence of other visible lesions proximal and distal to the lesion being studied, so the number of lesions included is small. Even so, we believe it is sufficient to show both the importance of considering lesion length when estimating the functional significance of a lesion from ultrasound data and the limitations of IVUS for this type of estimate. The scarce number of lesions included prevents us from analyzing specific anatomic factors that could cause differences in the functional significance of lesions (proximal, medial or distal location, risk territory, etc.). Assessment of these anatomic factors requires a larger, and probably multi-center, study. Although lesion length was measured by experienced IVUS interventional cardiologists following the standard technique for this type of analysis, the sometimes diffuse character of coronary disease means a certain degree of variability or inaccuracy can arise in assessing where the lesion starts and finishes. We believe that being blinded to the FFR results when conducting IVUS analysis can compensate for the influence of the results on any possible measurement inaccuracy.
CONCLUSIONSIn angiographically moderate lesions of >20mm, IVUS-derived length is a parameter we should consider when estimating functional significance. This estimate should combine focal parameters of maximum stenosis and length, although the correlation with intracoronary pressure wire-derived FFR values is low. The joint selection of <3.1mm2 MLA and >32.5mm length associates with a <0.80 FFR cutoff point with the best sensitivity and specificity values. When the principle object of study of an angiographically dubious lesion is to learn its possible functional significance, it seems advisable to use a direct FFR-derived measurement rather than an estimate based on anatomic data.
CONFLICTS OF INTERESTNone declared.