In recent years, rapid technological advances have allowed the development of new electrophysiological procedures that would not have been possible without the parallel development of imaging techniques used to plan and guide these procedures and monitor their outcomes. Ablation of atrial fibrillation is among the interventions with the greatest need for imaging support. Echocardiography allows the appropriate selection of patients and the detection of thrombi that would contraindicate the intervention; cardiac magnetic resonance imaging and computed tomography are also essential in planning this procedure, by allowing a detailed anatomical study of the pulmonary veins. In addition, in cardiac resynchronization therapy, echocardiography plays a central role in both patient selection and, later, in device adjustment and in assessing the effectiveness of the technique. More recently, ablation of ventricular tachycardias has been established as a treatment option; this would not be possible without planning using an imaging study such as cardiac magnetic resonance imaging of myocardial scarring.
Keywords
In recent years, the field of electrophysiology has expanded rapidly, with an increase in the complexity and number of techniques performed. This would not have been possible without the parallel development of noninvasive cardiovascular imaging techniques that allow the precise study of cardiac anatomy and complex cardiac function. Cardiac imaging techniques allow better patient selection and individualized planning of procedures, help guide the performance of procedures by detecting potential complications early, and lastly, assess the long-term treatment outcomes at follow-up. This review focuses on the usefulness of imaging techniques in some of the more complex procedures, such as ablation of atrial fibrillation (AF), cardiac resynchronization therapy (CRT), and ablation of ventricular tachycardias.
CARDIOVASCULAR IMAGING IN PATIENTS WITH ATRIAL FIBRILLATION TREATED WITH ABLATIONAtrial fibrillation is the most common arrhythmia in the general population, and its prevalence increases with age.1 The pathogenesis of AF usually involves an ectopic focus in the pulmonary veins. There is also an anatomical substrate that favors the generation and persistence of the arrhythmia, which can be detected with imaging and essentially is identified by the presence of atrial dilatation2 and dysfunction.3 Transthoracic echocardiography is the first-line imaging technique used to identify this substrate and, therefore, to select patients who are candidates for ablation treatment. This technique allows assessment of the presence of associated structural heart disease (such as valvular disease, left ventricular hypertrophy, and ventricular dysfunction). Transthoracic echocardiography also has therapeutic implications, as it indicates the risk of recurrence (according to atrial size and function4) and determines whether a combined therapeutic approach (for example, surgical ablation and mitral repair) would be appropriate, in cases of associated structural disease.
For estimation of the size of the left atrium (LA) 2-dimensional (2D) echocardiography is the most widely-used technique in clinical practice because of its availability; however, it underestimates LA volume compared with the 3-dimensional (3D) techniques of 3D echocardiography and cardiac magnetic resonance (CMR) imaging.5 Left atrial size (diameter and volume) has been demonstrated to be a predictive factor for the occurrence of idiopathic AF2 and its recurrence after cardioversion.6 Regarding the success of AF ablation, although arterial hypertension and an anteroposterior LA diameter of > 45 mm have been demonstrated to be independent predictors of success,7 mean atrial volume determined using 3D techniques (echocardiography4 and computed tomography [CT])8 has been demonstrated to predict AF recurrence after ablation better than LA measurements determined using conventional 2D echocardiography. Another recently introduced parameter is the sphericity index as measured on CMR9: spherical remodeling of the LA increases the risk of AF recurrence and is a better discriminator than atrial size.
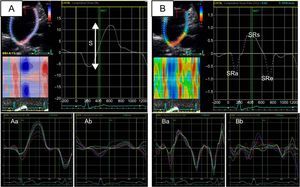
Left atrial function can be divided into 3 phases (reservoir, conduit, and booster pump) that can be studied using echocardiography with either volumetric measurements (2D or 3D) or myocardial deformation imaging (strain and strain rate)10 (Figure 1). A reduction in either the reservoir function4,11 or the contractile, or booster pump, function12 of the LA has been associated with AF occurrence and with successful ablation. Study of LA function can identify those patients whose arrhythmia will be stopped by ablation, both in patients with AF treated with a first ablation and in those treated with a second procedure.13
. A: left atrial strlain (a, patient with normal left atrial strain; b, patient with decreased left atrial strain). B: left atrial strain rate (a, patient with normal left atrial strain rate; b, patient with decreased left atrial strain rate). S, global left atrial strain; SRa, strain rate during atrial contraction (contractile function); SRe, strain rate during the early ventricular filling phase (conduction function); SRs, strain rate during ventricular systole (reservoir function).")
Study of left atrial function using myocardial deformation derived from 2-dimensional echocardiography (speckle-tracking strain). A: left atrial strlain (a, patient with normal left atrial strain; b, patient with decreased left atrial strain). B: left atrial strain rate (a, patient with normal left atrial strain rate; b, patient with decreased left atrial strain rate). S, global left atrial strain; SRa, strain rate during atrial contraction (contractile function); SRe, strain rate during the early ventricular filling phase (conduction function); SRs, strain rate during ventricular systole (reservoir function).
Delayed-enhancement CMR is attracting increasing interest for the detection of atrial fibrosis, which is considered an indicator of the arrhythmogenic substrate of AF. A prospective multicenter study (the DECAAF study)14 showed an association between the degree of fibrosis and AF recurrence after ablation. Patients were classified according to the degree of fibrosis (Utah stage), and recurrence was significantly associated with the initial degree of fibrosis (stage I, 15.3%; stage II, 32.6%; stage III, 45.9%; stage IV, 51.1%). Fibrosis detection using CMR could be useful for stratifying the risk of AF occurrence or AF recurrence after ablation.15 However, there are some technical limitations in terms of standardization: CMR has a limited spatial resolution, and the atrial wall is very thin; in addition, good atrial wall segmentation is needed, and currently there are various algorithms that use different thresholds of signal intensity to define fibrosis.16
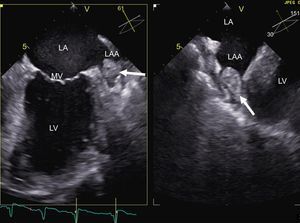
Imaging also allows the detection of potential complications that would contraindicate the technique. The detection of a thrombus in the left atrial appendage using transesophageal echocardiography is one of the most well-known contraindications for the procedure (Figure 2). There are various risk factors for thrombosis, such as female sex, the presence of structural heart disease, LA dilatation, and persistent AF: the presence of these factors increases, in an additive manner, the risk of left atrial appendage thrombus.17 Similarly, the CHADS2 (congestive heart failure, hypertension, age, diabetes, stroke [doubled]) score is directly proportional to the probability of thrombus presence.18 The need to perform transesophageal echocardiography in patients without risk factors is under debate. In up to 24% of patients with a CHADS2 score of 0, spontaneous contrast was detected in the left atrial appendage: this is indicative of blood stasis and is considered equivalent to an intra-atrial thrombus.18 Therefore, performing transesophageal echocardiography prior to ablation increases the safety of the procedure. The left atrial appendage can also be seen noninvasively using CT with contrast focused on the LA: several studies support the diagnostic accuracy of this method in the detection of thrombi.19 Thus, in patients who cannot tolerate or have a contraindication for transesophageal echocardiography, CT can be a good alternative.
 in the left atrial appendage. LA, left atrium; LAA, left atrial appendage; LV, left ventricle; MV, mitral valve.")
When ablation is indicated, imaging allows the procedure to be planned. In the case of AF ablation, information on the anatomy of the pulmonary veins is of particular interest.20 Although the anatomy can be studied with transesophageal echocardiography, the higher resolution and 3D visualization of CT and CMR mean that these techniques are routinely performed in most centers before the procedure, especially to obtain image fusion with electroanatomical navigation systems. This allows faster and simpler radiofrequency application. In addition, such imaging provides information on the presence of anatomical variants, such as a right middle pulmonary vein or a left common trunk, that could be associated with an increased recurrence of AF.21,22
In some centers, intracardiac echocardiography guidance is used during the procedure,23 serving as a useful guide for transseptal puncture and catheter position, and providing information on the anatomy. However, its use increases the complexity and cost of the procedure.
Despite such guidance, AF ablation is not without risk. Cardiac tamponade, which can occur in up to 5% of interventions,24 can be rapidly diagnosed with echocardiography.
Follow-up (Effect of Treatment)Atrial function shows long-term changes after AF ablation, and reduction of atrial volume can be seen on 3D echocardiography,25 CMR,26 and CT27 studies. In a meta-analysis,28 LA dimensions were found to decrease significantly after ablation only in patients without arrhythmia recurrence; in contrast, atrial function measured as LA ejection fraction or LA active emptying fraction did not change in patients without recurrence, but did decrease in patients with AF recurrence. Various studies summarized in the meta-analysis showed that the scarring and LA volumetric retraction caused by the damage produced during ablation were counteracted by the beneficial effect of restored sinus rhythm. Thus, in patients with or without effective ablation (in terms of restoration of sinus rhythm), even if LA volume is reduced, LA function does not worsen or improves only in patients who remain in sinus rhythm.28
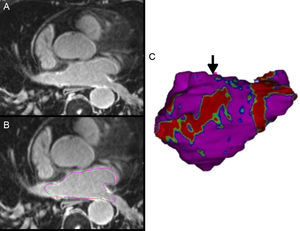
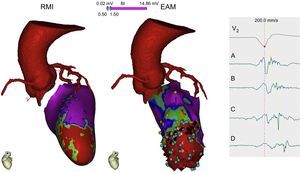
In patients with AF recurrence, gaps in ablation lines are one of the main mechanisms of pulmonary vein reconnection. Delayed-enhancement CMR can locate these gaps and guide the second ablation procedure29 (Figure 3).
, and area of discontinuity, the anatomical gap (arrow) that will act as a guide for catheter ablation.")
A: 3-dimensional delayed-enhancement cardiac magnetic resonance imaging of the left atrium in a patient with previous ablation. B: the epicardial and endocardial borders are traced for left atrial segmentation. In this case, based on the enhancement signal intensity normalized by the blood signal intensity, an image intensity ratio is obtained, and fibrous tissue is detected and quantified. C: 3-dimensional volume rendering image from segmentation of the left atrium in which fibrous tissue is projected onto the surface of the model; area with scar (in red), and area of discontinuity, the anatomical gap (arrow) that will act as a guide for catheter ablation.
In the long term, one of the most significant complications of AF ablation is pulmonary vein stenosis, which can occur in up to one third of cases,30 particularly in the left pulmonary vein (incidence of severe stenosis of up to 1%30,31). To confirm the diagnosis, the technique of choice is CT, although CMR provides the same information without radiation or iodinated contrast. Older patients, those with larger veins, and those with left inferior veins have a higher probability of pulmonary vein stenosis.30
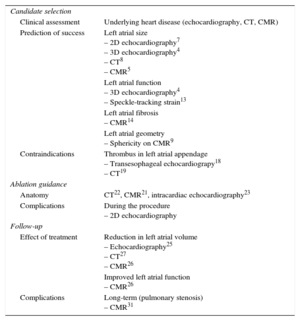
Table 1 summarizes the main uses of cardiac imaging in AF ablation.
Usefulness of Imaging Techniques in Ablation of Atrial Fibrillation
| Candidate selection | |
| Clinical assessment | Underlying heart disease (echocardiography, CT, CMR) |
| Prediction of success | Left atrial size – 2D echocardiography7 – 3D echocardiography4 – CT8 – CMR5 |
| Left atrial function – 3D echocardiography4 – Speckle-tracking strain13 | |
| Left atrial fibrosis – CMR14 | |
| Left atrial geometry – Sphericity on CMR9 | |
| Contraindications | Thrombus in left atrial appendage – Transesophageal echocardiograpy18 – CT19 |
| Ablation guidance | |
| Anatomy | CT22, CMR21, intracardiac echocardiography23 |
| Complications | During the procedure – 2D echocardiography |
| Follow-up | |
| Effect of treatment | Reduction in left atrial volume – Echocardiography25 – CT27 – CMR26 |
| Improved left atrial function – CMR26 | |
| Complications | Long-term (pulmonary stenosis) – CMR31 |
2D, 2-dimensional; 3D, 3-dimensional; CMR, cardiac magnetic resonance; CT, computed tomography.
The lack of coordination of cardiac mechanics secondary to the presence of electrical dyssynchrony has a deleterious effect on cardiac function. This is due to reduced filling and ejection times, with inefficient ventricular and atrial contraction, the development of mitral regurgitation, and increased left ventricle (LV) filling pressures.32 Cardiac resynchronization therapy aims to correct these mechanisms (correction of mechanical dyssynchrony) by electrical stimulation that stops and can even reverse the adverse remodeling caused by them. As a consequence, a significant improvement has been demonstrated in quality of life, number of hospital admissions, and mortality in patients with heart failure and left ventricular dysfunction treated with CRT.33 Response to CRT is determined by multiple factors, which can be summarized as the presence of an electrically-correctable mechanical discoordination along with a myocardium that is able to respond (with contractile reserve).34
Selection of CandidatesElectrically-correctable mechanical dyssynchrony includes various clinical situations that can be identified using echocardiography. Of interatrial,35 atrioventricular,36 interventricular, and intraventricular32 dyssynchrony, the last 3 can be improved by CRT with the implantation of a triple-chamber pacemaker, and there is already some initial experience with biatrial pacing for correction of interatrial dyssynchrony.37
According to the latest European guidelines,38 CRT is indicated for patients who, despite optimal medical treatment, remain in at least New York Heart Association functional class II, with left bundle branch block and QRS > 120 ms on electrocardiogram, and left ventricular ejection fraction ≤ 35%.39 Therefore, as a basic prerequisite for implantation, imaging is needed to determine left ventricular ejection fraction: this is usually 2D echocardiography. Although the indication for CRT is based on these criteria, up to 30% to 45% of patients do not respond to this therapy.40 Therefore, the aim has been to select patients with a more favorable profile for CRT by using imaging techniques, particularly echocardiography.
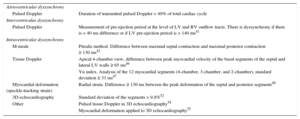
Atrioventricular dyssynchrony can be studied using transmitral pulsed Doppler duration (LV filling time) compared with the total duration of the cardiac cycle: if<40%, it is considered atrioventricular dyssynchrony. For interventricular dyssynchrony, pulsed Doppler of the ventricular outflow tracts allows measurement of the pre-ejection period (time from the start of the QRS to the onset of ventricular ejection). A difference of > 40 ms between the right and left ventricular times or an LV pre-ejection period of > 140 ms is considered indicative of interventricular dyssynchrony.41
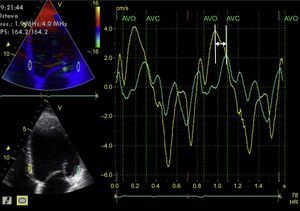
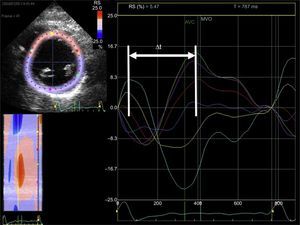
Left intraventricular dyssynchrony is the most widely-studied type of dyssynchrony, and a multitude of factors have been proposed for its evaluation. M-mode echocardiography of the LV (parasternal long axis view)42 is the simplest way to analyze it (Pitzalis method). A difference of ≥ 130 ms between the maximal septal wall contraction and maximal posterior wall contraction is a predictor of reduced end-diastolic diameter following CRT.43 However, this is of limited use in the presence of segmental wall motion abnormalities (eg, in ischemic heart disease), and there is a high degree of variability in its interpretation.44 Tissue Doppler allows determination of the peak myocardial velocity of contralateral segments during the ejection phase (between the opening and closing of the aortic valve).45 This requires correct alignment with the ultrasound beam (an angle-dependent technique) and good temporal resolution. A difference of ≥ 65 ms between the peak myocardial velocities of the basal segments of the septal and lateral walls of the LV on an apical 4-chamber view (Figure 4) has been associated with response to CRT,46 according to the experience of some authors, although the method is controversial. Similarly, the Yu index47 analyzes the 12 myocardial segments studied from apical 2-chamber, 3-chamber, and 4-chamber views. Lastly, the time difference between the myocardial deformation peaks determined using 2D echocardiography (speckle-tracking strain) has also been shown to be useful in predicting response to CRT. Radial strain appears to be superior to longitudinal or circumferential strain in predicting response48; a difference of ≥ 130 ms between the peak deformation of the LV septal wall and that of the posterior wall is predictive of LV reverse remodeling after CRT49 (Figure 5). The combination of pulsed tissue Doppler with radial strain determined by speckle-tracking could increase the predictive capacity.50 Speckle-tracking strain could also be useful to determine the segment with the most-delayed myocardial activation: this would be the site where LV electrode implantation would have its maximum efficiency.51 Lastly, 3D echocardiography also allows determination of the systolic dyssynchrony index (standard deviation of the time required by the different LV segments to reach the minimum volume at end-systole). This is expressed as a percentage, with a proposed cutoff point of 9.8% for predicted response to CRT.52 A limitation of this method is that it does not differentiate segmental contraction abnormalities or necrotic zones from the zones that are mechanically delayed due to an electrical disturbance and therefore susceptible to CRT.53 Pulsed tissue Doppler can also be used in 3D echocardiography and allows simultaneous comparison of the velocity delays of the different LV segments.54 Speckle-tracking strain from 3D echocardiography allows differentiation between viable myocardium and scar,55 but it has a low temporal resolution and therefore is not suitable for the study of such rapid phenomena as those occurring during a cardiac cycle.
 acquired using color-coded tissue Doppler, the imaging is postprocessed, obtaining curves of myocardial velocity throughout consecutive cardiac cycles of the basolateral segment (green line) and the basal septal segment (yellow line) (large screen). The 2 curves are not superimposed and there is a time difference between the 2 peaks of maximum velocity of each myocardial segment (arrow). AVC, aortic valve closure; AVO, aortic valve opening; HR, heart rate.")
Tissue Doppler study of left intraventricular synchrony. From the apical 4-chamber image of the left ventricle (left screens) acquired using color-coded tissue Doppler, the imaging is postprocessed, obtaining curves of myocardial velocity throughout consecutive cardiac cycles of the basolateral segment (green line) and the basal septal segment (yellow line) (large screen). The 2 curves are not superimposed and there is a time difference between the 2 peaks of maximum velocity of each myocardial segment (arrow). AVC, aortic valve closure; AVO, aortic valve opening; HR, heart rate.
. From the short axis image of the left ventricle at the level of the papillary muscles obtained with 2-dimensional echocardiography (left screen), the endocardium is traced. Using dedicated software, curves of radial myocardial deformation are obtained (positive values) for each segment of the left ventricle (6 segments) throughout the cardiac cycle (large screen). The time difference is calculated between the maximal deformation of the septal segments (turquoise and yellow lines) and the inferolateral segment (green line). The curves are not superimposed and there is a time difference between the peaks of maximal myocardial deformation of each myocardial segment (arrow). Δt: time difference; AVC, aortic valve closure; MVO, mitral valve opening; RS, radial strain.")
Left intraventricular synchrony study using echocardiography of myocardial deformation (strain). From the short axis image of the left ventricle at the level of the papillary muscles obtained with 2-dimensional echocardiography (left screen), the endocardium is traced. Using dedicated software, curves of radial myocardial deformation are obtained (positive values) for each segment of the left ventricle (6 segments) throughout the cardiac cycle (large screen). The time difference is calculated between the maximal deformation of the septal segments (turquoise and yellow lines) and the inferolateral segment (green line). The curves are not superimposed and there is a time difference between the peaks of maximal myocardial deformation of each myocardial segment (arrow). Δt: time difference; AVC, aortic valve closure; MVO, mitral valve opening; RS, radial strain.
Table 2 summarizes the main echocardiographic measurements proposed for the selection of CRT candidates.
Detection of Cardiac Resynchronization Therapy-correctable Cardiac Dyssynchrony on Echocardiography
| Atrioventricular dyssynchrony | |
| Pulsed Doppler | Duration of transmitral pulsed Doppler < 40% of total cardiac cycle |
| Interventricular dyssynchrony | |
| Pulsed Doppler | Measurement of pre-ejection period at the level of LV and RV outflow tracts. There is dyssynchrony if there is > 40 ms difference or if LV pre-ejection period is > 140 ms41 |
| Intraventricular dyssynchrony | |
| M-mode | Pitzalis method. Difference between maximal septal contraction and maximal posterior contraction ≥ 130 ms42 |
| Tissue Doppler | Apical 4-chamber view, difference between peak myocardial velocity of the basal segments of the septal and lateral LV walls ≥ 65 ms46 |
| Yu index. Analysis of the 12 myocardial segments (4-chamber, 3-chamber, and 2-chamber), standard deviation ≥ 33 ms47 | |
| Myocardial deformation (speckle-tracking strain) | Radial strain. Difference ≥ 130 ms between the peak deformation of the septal and posterior segments49 |
| 3D-echocardiography | Standard deviation of the segments > 9.8%52 |
| Other | Pulsed tissue Doppler in 3D echocardiography54 |
| Myocardial deformation applied to 3D echocardiography55 | |
3D, 3-dimensional; LV, left ventricle; RV, right ventricle.
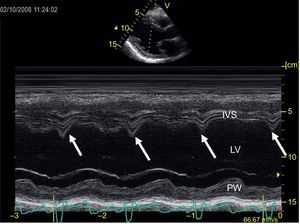
The multicenter PROSPECT56 study aimed to validate these imaging techniques for the prediction of response to CRT, but the results were clearly negative. The parameters that had previously been presented individually and in single centers had demonstrated prognostic value in predicting response to CRT, but this value was not confirmed in a multicenter setting. This generated a great deal of controversy regarding the role of echocardiography in mechanical dyssynchrony prior to CRT implantation. The results of the PROSPECT study were explained in part by the low reproducibility of the measurements and the huge difficulty of precisely defining a positive response to CRT. All the studies that aim to demonstrate the prognostic usefulness of a determined parameter in predicting response to CRT use a dichotomous variable to define the response or lack of response. However, the clinical reality is different, given that response to CRT is variable and ranges from clinical improvement without reverse remodeling to extensive reverse remodeling (super-responders).57 Therefore, the indication for CRT should not be based on a single parameter, as cardiac function is complex, and there are multiple parameters involved in the response to CRT.34 In addition, the methods described above have many technical limitations and do not always show an electrically-correctible mechanical dyssynchrony problem (that is, they do not differentiate necrosis from mechanical delay due to slowed electrical activation). In patients with normal ventricular function, there is a good correlation between the mechanical times and electrical times, but this correlation is lost in patients with ventricular dysfunction. Cardiac resynchronization therapy improves this correlation, but in patients with myocardial scarring, it is not always possible to correct the mechanical abnormalities.58 Therefore, some authors have proposed a multimodal approach59 that includes clinical and echocardiographic parameters. In this regard, identification of a CRT-correctible abnormality on conventional echocardiography has been associated with a response to CRT and improved survival. These abnormalities, in order of predictive value, are as follows: abnormal septal movement during isovolumetric contraction (septal flash), ventricular filling abnormalities such as the presence of a truncated A wave (short atrioventricular interval), fusion of A and E waves (long atrioventricular interval) and, lastly, exaggerated interventricular dependence.60 These parameters are easily identifiable with conventional echocardiography. Septal flash can be identified on 2D or simple M-mode echocardiography (Figure 6) as a rapid movement of the septum towards the ventricular cavity during the isovolumetric contraction phase (during the QRS of the electrocardiogram) and a rapid recoil caused by delayed active contraction of the lateral wall. Filling abnormalities (fusion of E and A waves or early termination of the A wave) are also easily recognizable with pulsed Doppler of LV inflow. Lastly, exaggerated ventricular interaction can be identified by either 2D echocardiography or by a difference in the pre-ejection periods of the right ventricle and the LV. By following an algorithm to determine these parameters, the probability of response to CRT can be determined based on the presence of an electrically-correctable mechanical abnormality. Furthermore, the extent or degree of response will be determined by the baseline status of underlying heart disease and other clinical factors such as kidney disease.60 Although there is increasing evidence that in experienced hands an integrated approach to the patient with a wide QRS and ventricular dysfunction can improve the response rate to CRT, the guidelines38,39 still suggest QRS width alone as the criterion for CRT indication.

Image recording in M-mode transthoracic echocardiography at the level of the left ventricle in long parasternal axis view. The vertical arrows indicate the presence of septal flash, a rapid movement of the septum towards the ventricular cavity during the QRS. IVS, interventricular septum; LV, left ventricle; PW, posterior wall of left ventricle.
Cardiac magnetic resonance imaging provides information on LV size and function and the presence of myocardial scarring in patients who are candidates for CRT. It can also provide information on LV dyssynchrony. Using the cine sequence, and from radial shortening analysis of wall segments, polar maps are created, and the tissue synchronization index can be calculated.61 Cardiac magnetic resonance also allows myocardial deformation analysis by monitoring specific marks in the myocardium (tagging).62 With both techniques, some authors have demonstrated that response to CRT can be predicted.61,62 The use of velocity-encoded CMR has also been described for the study of dyssynchrony, measuring myocardial wall motion throughout the cardiac cycle. This provides velocity-time curves similar to those of tissue Doppler imaging,63 but there are still no data that prove the usefulness of this method in predicting long-term response to CRT. Use of CMR in the study of cardiac synchrony is limited by both the complex processing of the images and the low temporal resolution. However, delayed-enhancement CMR provides important information on the presence, location, and transmurality of scarring, all of which are independent predictors of CRT response. Total scar burden appears to be an independent predictor of response to CRT; although there is no consensus on the cutoff value that would contraindicate this treatment, it ranges between 10% and 15%.64 Regarding the transmurality (presence of late enhancement > 51% of wall thickness), there is a demonstrated inversely proportional relationship with response to CRT.65 Finally, location of the scar on the posterolateral wall, particularly if it is transmural, is associated with a lesser response to CRT.66 The presence, size, and heterogeneity of the scar as evaluated with CMR also predict the incidence of ventricular arrhythmias in patients with CRT, therefore CMR could be useful when deciding whether or not to combine the CRT device with a defibrillator function.67
Computed tomography is a noninvasive alternative to venography that is usually performed at the same time as the procedure to evaluate the anatomy of the cardiac veins with a view to implanting the electrode in the LV. Computed tomography imaging allows the clinician to see if the veins are suitable for electrode implantation and to plan the intervention appropriately.68
Nuclear medicine techniques also allow determination of LV systolic function, the presence of scars, and the degree of mechanical dyssynchrony,69 as well as the most-delayed activation point, to guide the implantation of the LV electrode.70 However, these techniques have low spatial resolution and involve radiation and complex processing; therefore, they are rarely used in clinical practice.
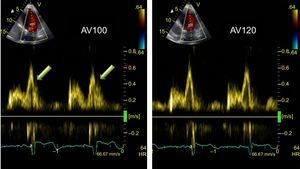
DEVICE OPTIMIZATIONOptimization of the atrioventricular and interventricular intervals can be useful for some patients who do not respond to CRT, although routine optimization is not recommended.38 The most frequently-used method for atrioventricular interval optimization is the iterative method. Using pulsed Doppler of LV filling, the diastolic filling time is calculated, from the start of the E wave until the end of the A wave; a long interval is programmed, which is then gradually reduced until the truncated A wave appears; then the interval is gradually increased until the truncated A wave disappears: this is considered the optimal interval (Figure 7). An empirical method is also used for interventricular interval optimization, which looks for the VV interval providing the greatest LV outflow tract velocity-time integral as an indicator of stroke volume.71 The interval between the 2 ventricles can also be optimized by identifying which produces the greatest synchrony, using tissue Doppler applied to opposite walls of the LV. Both optimization methods correlate well and improve cardiac output.72 The optimization of CRT devices leads to clinical improvement in patients treated with CRT,73 although its impact on survival has not yet been demonstrated.
 is observed at the start of systole. Right: after increasing the atrioventricular interval to 120 ms, the truncated A wave disappears. AV, atrioventricular; HR, heart rate.")
Optimization of atrioventricular interval. Recording of pulsed spectral Doppler of left ventricular filling flow according to atrioventricular interval adjustment. Left: with an atrioventricular interval of 100 ms, a truncated A wave (arrows) is observed at the start of systole. Right: after increasing the atrioventricular interval to 120 ms, the truncated A wave disappears. AV, atrioventricular; HR, heart rate.
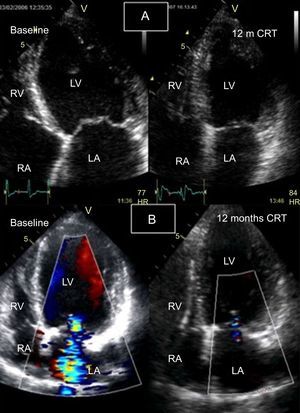
In the follow-up of patients treated with CRT, echocardiography is the most frequently-used imaging technique, since, due to the implantation of the CRT device, CMR use is restricted. The reverse cardiac remodeling that is seen at follow-up in patients who respond to CRT is significantly associated with clinical improvement and fewer clinical events at follow-up.33 On conventional (2D) echocardiography, CRT has been demonstrated to reduce LV volume and improve the systolic74 and diastolic57 function of both ventricles.75 Likewise, CRT can improve mitral regurgitation, due to the acute improvement in synchronous papillary muscle contraction and the long-term improvement of ventricular reverse remodelling76 (Figure 8).
, baseline (left) and follow-up at 12 months (right); a significant reduction is seen in the left ventricular end-systolic volume. B: Apical 4-chamber view during diastole with color Doppler at baseline (left), showing severe mitral regurgitation, and follow-up at 12 months (right), showing resolution of mitral regurgitation and reduction of left ventricular volume. CRT, cardiac resynchronization therapy; HR, heart rate; LA, left atrium; LV, left ventricle; RA, right atrium; RV, right ventricle.")
Follow-up of response to cardiac resynchronization therapy using 2-dimensional echocardiography with color Doppler. A: left ventricle at end-systole (apical 4-chamber view), baseline (left) and follow-up at 12 months (right); a significant reduction is seen in the left ventricular end-systolic volume. B: Apical 4-chamber view during diastole with color Doppler at baseline (left), showing severe mitral regurgitation, and follow-up at 12 months (right), showing resolution of mitral regurgitation and reduction of left ventricular volume. CRT, cardiac resynchronization therapy; HR, heart rate; LA, left atrium; LV, left ventricle; RA, right atrium; RV, right ventricle.
In some patients with recurrent sustained ventricular tachycardia (VT) despite medical treatment, ablation of VT has become a therapeutic option that improves patients’ symptoms and prognosis.77 Cardiac imaging also helps optimize the outcomes of this treatment.
Candidate SelectionIn the assessment of patients with VT, it is important to distinguish between those with a structurally normal heart and those with myocardial disease (to establish if there is scarring or fibrosis), as this is associated with more poorly-tolerated VT and VT leading to ventricular fibrillation. The first approach is with conventional echocardiography, but in recent years, several studies have focused on the use of delayed-enhancement CMR to identify the necrotic/fibrotic zone, stratify VT risk, plan ablation procedures, and guide the procedure.78
It is important to identify the origin of the VT prior to ablation. The presence of an area of necrosis/fibrosis with surrounding areas of viable tissue is the basis for the formation of VT re-entry circuits.79 Delayed-enhancement CMR has become the technique of choice for identifying and characterizing such necrotic/fibrotic tissue. The presence and, above all, the degree of heterogeneity of the scar as studied on delayed-enhancement CMR are associated with an increased incidence of ventricular arrhythmias and poor prognosis both in patients with myocardial infarction and in those with nonischemic cardiomyopathy.67,80 Furthermore, the distribution of delayed-enhancement on CMR images differentiates between VT of endocardial origin and VT of epicardial origin, which helps in the planning and approach (epicardial, endocardial, or both) of the ablation.81
Intraprocedural GuidanceAs in ablation of AF, postprocessed delayed-enhancement CMR images can be integrated into navigation systems to guide VT ablation and have been shown to correlate well with electroanatomic maps.82 Using 3D-enhanced CMR, it has been possible to identify conduction channels between viable cells of the scar, to help guide ablation procedures83 (Figure 9). However, there are still some technical limitations (low spatial resolution) and a lack of standardization of signal postprocessing algorithms that define the peri-infarct zone (border zone) and the fibrosis/necrosis zone. It should be added that many of these patients already have implantable cardioverter-defibrillators at the time that VT ablation is being considered, which, despite constant technological improvements,84 restricts CMR use. Another alternative is to perform cardiac CT, which allows visualization of the scar and fusion of the 3D images with the mapping system to guide ablation.85
 with an area of viable tissue within (green). The endocardial EAM shows an area of dense apical scarring, with some points (blue) that create a slow conduction channel from A to D with progressive delay on the electrogram. This channel will be the substrate and the target for ablation. MRI: magnetic resonance imaging; EAM, electroanatomical mapping.")
Multimodal imaging with cardiac computed tomography to demarcate the course of the coronary arteries when planning an epicardial approach to ablation and with cardiac magnetic resonance showing an apical anteroseptal scar (red) with an area of viable tissue within (green). The endocardial EAM shows an area of dense apical scarring, with some points (blue) that create a slow conduction channel from A to D with progressive delay on the electrogram. This channel will be the substrate and the target for ablation. MRI: magnetic resonance imaging; EAM, electroanatomical mapping.
Regarding the follow-up of these patients, the role of imaging may be relegated to the detection of intraprocedural complications, such as cardiac tamponade, which can be diagnosed using transthoracic echocardiography. After ablation, CMR could be performed to detect any uncommon complications, such as steam pop (myocardial damage caused by excessive heating secondary to the radiofrequency) or the degree of damage after ablation (transmurality), although there is little literature on this matter.
Regarding future directions in this field, real-time CMR could be an alternative for guiding electrophysiological studies, with no radiation exposure and with direct monitoring of the damage being caused, unlike standard fluoroscopy procedures.86
CONFLICTS OF INTERESTNone declared.