Thoracic aorta calcium detection is known to improve cardiovascular risk prediction for cardiac and noncardiac events beyond traditional risk factors. We investigated the influence of thoracic aorta morphometry on the presence and extent of aortic calcifications.
MethodsNonenhanced computed tomography heart scans were performed in 970 asymptomatic participants at increased cardiovascular risk. An automated algorithm estimated the geometry of the entire thoracic aorta and quantified the aortic calcium Agatston score. A nonparametric model was used to analyze the percentiles of calcium score by age. Logistic regression models were calculated to identify anatomical associations with calcium levels.
ResultsCalcifications were concentrated in the aortic arch and descending portions. Higher amounts of calcium were associated with an enlarged, unfolded, less tapered and more tortuous aorta. The size of the ascending aorta was not correlated with aortic calcium score, whereas enlargement of the descending aorta had the strongest association: the risk of having a global calcium score > 90th percentile was 3.62 times higher (confidence interval, 2.30-5.91; P < .001) for each 2.5-mm increase in descending aorta diameter. Vessel taper, tortuosity, unfolding and aortic arch and descending volumes were also correlated with higher amounts of calcium.
ConclusionsThoracic aorta calcium was predominantly found at the arch and descending aorta and was positively associated with the size of the descending aorta and the aortic arch, but not with the size of the ascending aorta. These findings suggest that aortic dilatation may have different mechanisms and may consequently require different preventive strategies according to the considered segments.
Keywords
It is important to determine the size of the thoracic aorta (TA) because its early increase may predict future aortic aneurysms whose frequency shows a continuous increase.1 Estimating aortic size (ie, diameter, volume, tortuosity, tapering) is challenging because the anatomy of the TA is complex, particularly in the aortic arch region, which has several branches and a curvilinear nonplanar path that bends and twists.2,3 We have recently shown that noncontrast low dose computed tomography for coronary artery calcium scoring allows reconstruction of the global morphology of the TA and simultaneously detection of thoracic aorta calcium (TAC).4–7
The Agatston TAC score is an indicator of atherosclerotic disease8 and the opportunity to assess TA size and TAC simultaneously may allow analysis of the participation of atherosclerotic disease in the early dilatation of the TA according to the considered segment. Moreover, a detailed assessment of the association between aortic calcium and TA geometry could help to elucidate the heterogeneous distribution of calcium deposits along the length of the TA and help to detect vulnerable regions.9
In this study, we investigated the association of TA size with TAC in a cohort of 970 asymptomatic participants at increased cardiovascular risk. A detailed 3-dimensional geometric description of the TA and the position and size of TAC were simultaneously analyzed with customized software using nonenhanced extended multislice computed tomography (MSCT) scans. Logistic models adjusted for traditional risk factors were calculated to assess the specific role of the TA geometric variables on the presence of TAC and its extent and spatial distribution.
METHODSStudy ParticipantsStudy participants (n = 970) were recruited over 2 years from September 2009.4 We included all consecutive patients at risk for cardiovascular disease who underwent a noncontrast MSCT scan as part of a cardiovascular risk stratification program. This scan was performed as part of dual screening: a) estimation of calcified coronary atherosclerosis burden, and b) detection of early aortic dilatation in all TA sites including the ascending aorta, aortic arch and descending aorta. Informed consent was obtained from all individual participants included in the study. The participants had at least 1 traditional risk factor (hypercholesterolemia in 82%, hypertension in 49%, current smoking in 20% and diabetes in 9%). None of the participants had present or a past history of cardiovascular disease. The Framingham risk score calculated in all participants after recalibration for the French population was less than 20% at 10 years.10 In accordance with the current guidelines,11 we stratified the participants’ risk of atherosclerotic cardiovascular disease by means of noncontrast low-dose MSCT for coronary artery calcium measurement. An extended scan was used to cover the entire TA for TAC assessment.4 Brachial blood pressure was determined as the mean of 3 measurements using a sphygmomanometer with the patient in the supine position following a 10-min rest. Hypertension was defined as blood pressure of 140/90mmHg or above, or use of antihypertensive medication. Total and high-density lipoprotein blood cholesterol and triglyceride concentrations were measured after a 14-hour fast, and low-density lipoprotein concentrations were calculated with the Friedewald formula or, when this formula could not be used, were measured directly. Hypercholesterolemia was determined by fasting low-density lipoprotein cholesterol above 3.3 mmol/L or by the presence of low-density lipoprotein-lowering drug therapy. Blood glucose was measured after an overnight fast and diabetes was determined by fasting blood glucose of 7 mmol/L or above, or by the presence of antidiabetic medication.
The retrospective analysis of personal health data of study participants was authorized by the CNIL (Commission nationale de l’informatique et des libertés) and was in accordance with the Declaration of Helsinki.
Image AcquisitionAortic imaging was obtained with noncontrast cardiac 64-slice MSCT (Light-speed VCT, GE Health care; Milwaukee, Wisconsin, United States) during the acquisition done to quantify coronary artery calcium as reported elsewhere.4 The measurements were done with 2.5-mm axial slices, 120 kVp, 250-mA tube current, 250-ms exposure time, and a 250-mm field of view. Images were acquired with prospective-electrocardiogram gating at 60% of the R-R interval in the craniocaudal direction from the top of the aortic arch to the level of the diaphragm. The effective radiation dose assessed in a representative subgroup of 200 participants using this extended scan length was 1.23 ± 0.14 mSv.6 Scans were exported as DICOM (Digital Imaging and Communication in Medicine) files and were analyzed using a customized software designed in our laboratory that estimated the TA geometry in 3 dimensions6 and calculated the size and position of the TA calcifications.4 Thoracic aortic size and calcium were measured by the same expert, blinded to clinical parameters. Further details can be found in previous reports.4–6
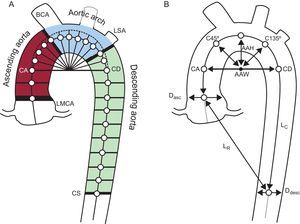
Aortic Size and Shape MeasurementsThe user started with a manual selection of 2 seed points in the axial slices at the center of the ascending and descending aorta at the pulmonary bifurcation level (see points CA and CD in Figure 1A). Then, an automatic algorithm extracted the central skeleton and estimated the vessel diameter at that point, dynamically expanding and centering circles to inscribe them inside the vessel cross-section area.6 This circle-fitting algorithm was sequentially applied over the axial computed tomography slices for the descending portion of the aorta and over the oblique planes for the curvilinear part (Figure 1A). These oblique planes were reconstructed in steps of 2° angles following a semitoroidal path. The center point of each circle was used as a seed point for the next estimation. A postprocessing correction was performed to ensure that reconstructed planes remained perpendicular to the true aortic centerline. The result of this process in each patient was a list of ≈150 centerline points with the corresponding diameters that approximated the cross section of the aorta in each position.
, aortic taper calculated as the percentage of descending to ascending diameter narrowing (Ddesc/Dasc-1) × 100. Aortic tortuosity was defined as the length of the thoracic aorta centerline divided by the linear distance between extreme points. AAH, aortic arch height; AAW, aortic arch width; BCA, brachiocephalic artery; CA, coronary ascending; CD, coronary descending; CS, coronary sinus; Dasc, ascending diameter; Ddesc, descending diameter; LMCA, left main coronary artery; LSA, left subclavian artery; LC, length of the thoracic aorta centerline; LR, linear distance between extreme points.")
Measurements of aortic size and shape. A: 2 seed points in the ascending and descending thoracic aorta were used for the automated segmentation algorithm that calculated the vessel centerline. The ascending, arch and descending segments were separated by 4 oblique planes at the left main coronary artery, brachiocephalic artery, left subclavian artery, and at the coronary sinus level. B: Right: geometric measurements used to describe the aortic shape. Aortic arch width and height, distances from the arch center to diagonal vectors (C45° and C135°), aortic taper calculated as the percentage of descending to ascending diameter narrowing (Ddesc/Dasc-1) × 100. Aortic tortuosity was defined as the length of the thoracic aorta centerline divided by the linear distance between extreme points.
AAH, aortic arch height; AAW, aortic arch width; BCA, brachiocephalic artery; CA, coronary ascending; CD, coronary descending; CS, coronary sinus; Dasc, ascending diameter; Ddesc, descending diameter; LMCA, left main coronary artery; LSA, left subclavian artery; LC, length of the thoracic aorta centerline; LR, linear distance between extreme points.
The vessel was finally divided into ascending, arch and descending portions delimited by 4 planes at the left main coronary artery, the brachiocephalic and left subclavian arteries and the coronary sinus level (Figure 1).
Twelve geometric variables were chosen to describe the TA morphology in 3 dimensions. These variables were selected because they properly summarized the modifications of TA size and shape due to aging in recent reports.6,12,13
The size of the TA was assessed by measuring the mean diameter and the volume of the ascending, arch and descending TA segments. The description of TA shape included another 6 variables: the aortic arch width and height, aortic tortuosity (calculated as the TA curve length divided by the straight line distance between endpoints), aortic tapering (defined as the difference between the mean ascending and mean descending diameters normalized to ascending diameter) and 2 distances (from arch center to centerline points at 45° and 135°) as shown in Figure 1B.
Calcification AssessmentLesions were quantified with a semi-automatic algorithm using the Agatston score method.8 For each axial image, the algorithm highlighted all candidate lesions of area > 1mm2 and > 130HU. Subsequently, the user reviewed each axial plane to validate the automated selection. The Agatston score was calculated for each lesion using a weighted value assigned to the highest density of calcification multiplied by the area. Each calcification was assigned to the nearest aortic segment. Finally, the calcium scores were accumulated for each segment. Global and segmental raw and log-transformed scores were reported for each participant.
Statistical AnalysisNormally distributed continuous variables are described as means ± standard deviation (SD) and categorical variables as frequencies (%). Thoracic arch calcium was expressed as raw values and log-transformed values (calculated as log [score + 1]). Participants with and without TAC were compared with chi-square tests for categorical variables and student t-tests for variables with normal distribution. The patients were divided by age and TAC percentiles into 4 groups using nonparametric techniques.14 We followed the article by O’Brien and Dyck15 when setting normal values in skewed distributions. Accordingly, a model was constructed by using the log-transformed TAC distribution as a function of age and sex. Taking the exponential of the 50th and 90th percentiles (P50 and P90) curves of the TAC as a function of age, participants were separated into 4 groups of TAC level: TAC = 0, TAC > 0 and TAC < P50, TAC > P50 and TAC < P90 and TAC > P90. The trend of the TA geometric characteristic across TAC categories was compared using ANOVA (analysis of variance) adjusted for age, sex, body-size area, and incidence of hypertension and hypercholesterolemia. The association of TAC level with geometric variables taken separately was examined with a logistic regression adjusted for age, sex, body-size area, and incidence of hypertension and hypercholesterolemia. The odds of having increasing levels of TAC with respect to the TAC = 0 group per 1 SD increase in each geometric variable were calculated. The association of the local TAC presence in the ascending, arch and descending segments with the local geometric variables was also determined with separate logistic regressions. Odds ratios per 1 SD increase of each parameter were calculated adjusted for age, sex, body-size area, and incidence of hypertension and hypercholesterolemia. All analyses were performed with JMP 8 software (SAS Institute; Cary, North Carolina, United States).
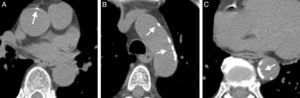
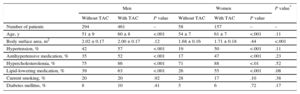
RESULTSThe clinical characteristics of the study population, separated by the presence and absence of TAC, are shown in Table 1. Images of a representative patient with TAC are shown in Figure 2. Participants with TAC were older than those without (P < .001). Hypertension, antihypertensive therapy, hypercholesterolemia and lipid lowering therapy were more frequent in participants with TAC than in those without (P < .001 in all cases, except for hypercholesterolemia in women: P < .01). Body surface area and the frequency of diabetic and current smoking did not differ with the presence of TAC. Risk factors did not differ between men and women with TAC.
Baseline Cohort Characteristics of 970 Participants
| Men | Women | P value* | |||||
|---|---|---|---|---|---|---|---|
| Without TAC | With TAC | P value | Without TAC | With TAC | P value | ||
| Number of patients | 294 | 461 | – | 58 | 157 | – | – |
| Age, y | 51 ± 9 | 60 ± 8 | <.001 | 54 ± 7 | 61 ± 7 | <.001 | .11 |
| Body surface area, m2 | 2.02 ± 0.17 | 2.00 ± 0.17 | .12 | 1.68 ± 0.16 | 1.71 ± 0.18 | .44 | <.001 |
| Hypertension, % | 42 | 57 | <.001 | 19 | 50 | <.001 | .11 |
| Antihypertensive medication, % | 35 | 52 | <.001 | 17 | 47 | <.001 | .23 |
| Hypercholesterolemia, % | 75 | 86 | <.001 | 71 | 88 | <.01 | .52 |
| Lipid-lowering medication, % | 39 | 63 | <.001 | 26 | 55 | <.001 | .08 |
| Current smoking, % | 20 | 20 | .92 | 28 | 17 | .10 | .38 |
| Diabetes mellitus, % | 8 | 10 | .41 | 5 | 6 | .72 | .17 |
TAC, thoracic aorta calcium.
, arch (B) and descending (C) thoracic aorta portions in a representative patient with aortic calcifications (arrows).")
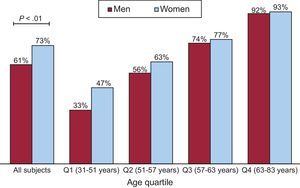
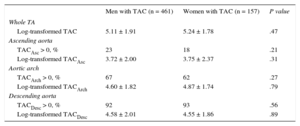
Differences in the presence and extent of TAC by gender are shown in Table 2 and Figure 3. The log-transformed TAC value did not differ between men and women in any segment, even after adjustment for age and body surface area (Table 2). The prevalence and log-transformed TAC score values in the ascending arch and descending segments were globally 21%, 66% and 91% and 3.72 ± 2.08, 4.66 ± 1.80, and 4.57 ± 1.98, respectively. The prevalence of TAC was higher in women than in men (P < .01) but this difference disappeared when adjusted for age and body surface area (Figure 3). When analyzed by quartiles of age, we found a higher percentage of younger women with TAC than men, but this difference did not reach statistical significance.
Extent and Distribution of Calcium in Patients With Thoracic Aorta Calcium
| Men with TAC (n = 461) | Women with TAC (n = 157) | P value | |
|---|---|---|---|
| Whole TA | |||
| Log-transformed TAC | 5.11 ± 1.91 | 5.24 ± 1.78 | .47 |
| Ascending aorta | |||
| TACAsc > 0, % | 23 | 18 | .21 |
| Log-transformed TACAsc | 3.72 ± 2.00 | 3.75 ± 2.37 | .31 |
| Aortic arch | |||
| TACArch > 0, % | 67 | 62 | .27 |
| Log-transformed TACArch | 4.60 ± 1.82 | 4.87 ± 1.74 | .79 |
| Descending aorta | |||
| TACDesc > 0, % | 92 | 93 | .56 |
| Log-transformed TACDesc | 4.58 ± 2.01 | 4.55 ± 1.86 | .89 |
Arch, aortic arch; Asc, ascending; Desc, descending; TA, thoracic aorta; TAC, thoracic aorta calcium.

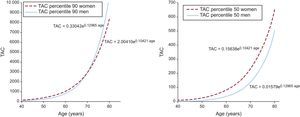
The P90 and P50 curves of the TAC by age and sex are shown in Figure 4. Thoracic aorta calcium exponentially increased with age and P90 curve were similar between men and women while the P50 curve of women was moved upwards compared with the curve of men.

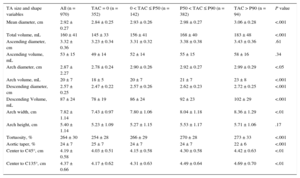
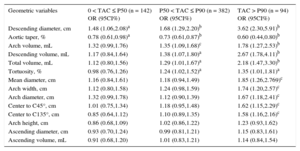
To evaluate the association between TAC and aortic morphology, the cohort was stratified by TAC level and age, and the trend across TAC levels are shown in Table 3. Globally, TA mean diameter and volume increased with TAC level (P < .001). The size of the ascending aorta did not change with TAC, whereas both the arch and the descending segments were larger (P < .001, except for the arch diameter: P < .05). The aortic shape also differed by TAC level. In participants with more TAC, the arch was wider (P < .01), distances to C45° and C135° points were longer (P < .01), the whole TA was more tortuous (P < .001) and showed less taper (P < .001). Table 4 shows the risk of having a global calcium score < P50, between P50 and P90 and > P90 for 1 SD increase in each geometric variable. Odds ratios were calculated with respect to participants with TAC= 0, independently of traditional risk factors. Geometric variables were sorted by decreasing odds of having TAC and by TAC levels. The only 2 geometric variables associated with greater odds of belonging to the less calcified group (0 < TAC < P50) were descending diameter (P < .05) and aortic taper (P < .05). Another 4 variables increased the odds of belonging to the P50 < TAC < P90 group: arch and descending volume (P < .001 and P < .05, respectively), total TA volume (P < .05) and tortuosity (P < .05). Finally, 5 additional geometric variables were associated with greater odds of belonging to the most calcified group (TAC > P90): mean diameter, arch diameter, arch width, and distance to C45° and C135° (P < .01 in all cases). Descending mean diameter and aortic taper were strongly associated with TAC in the 3 groups, ie, the odds of belonging to the TAC > P90 group increased 3.62-fold for 1 SD increase of the descending diameter, whereas a 1 SD increase of taper reduced the odds by 0.60.
Comparison of Thoracic Aorta Geometric Characteristics Across Different Levels of Thoracic Aorta Calcium
| TA size and shape variables | All (n = 970) | TAC = 0 (n = 352) | 0 < TAC ≤ P50 (n = 142) | P50 < TAC ≤ P90 (n = 382) | TAC > P90 (n = 94) | P value |
|---|---|---|---|---|---|---|
| Mean diameter, cm | 2.92 ± 0.27 | 2.84 ± 0.25 | 2.93 ± 0.26 | 2.98 ± 0.27 | 3.06 ± 0.28 | <.001 |
| Total volume, mL | 160 ± 41 | 145 ± 33 | 156 ± 41 | 168 ± 40 | 183 ± 48 | <.001 |
| Ascending diameter, cm | 3.32 ± 0.36 | 3.23 ± 0.34 | 3.31 ± 0.32 | 3.38 ± 0.38 | 3.43 ± 0.36 | .61 |
| Ascending volume, mL | 53 ± 15 | 49 ± 14 | 52 ± 14 | 55 ± 15 | 58 ± 16 | .34 |
| Arch diameter, cm | 2.87 ± 2.27 | 2.78 ± 0.24 | 2.90 ± 0.26 | 2.92 ± 0.27 | 2.99 ± 0.29 | <.05 |
| Arch volume, mL | 20 ± 7 | 18 ± 5 | 20 ± 7 | 21 ± 7 | 23 ± 8 | <.001 |
| Descending diameter, cm | 2.57 ± 0.25 | 2.47 ± 0.22 | 2.57 ± 0.26 | 2.62 ± 0.23 | 2.72 ± 0.25 | <.001 |
| Descending Volume, mL | 87 ± 24 | 78 ± 19 | 86 ± 24 | 92 ± 23 | 102 ± 29 | <.001 |
| Arch width, cm | 7.82 ± 1.14 | 7.43 ± 0.97 | 7.80 ± 1.06 | 8.04 ± 1.18 | 8.36 ± 1.29 | <.01 |
| Arch height, cm | 5.40 ± 1.14 | 5.23 ± 1.09 | 5.27 ± 1.15 | 5.53 ± 1.17 | 5.71 ± 1.06 | .17 |
| Tortuosity, % | 264 ± 30 | 254 ± 28 | 266 ± 29 | 270 ± 28 | 273 ± 33 | <.001 |
| Aortic taper, % | 24 ± 7 | 25 ± 7 | 24 ± 7 | 24 ± 7 | 22 ± 6 | <.001 |
| Center to C45°, cm | 4.19 ± 0.58 | 4.03 ± 0.51 | 4.15 ± 0.58 | 4.30 ± 0.58 | 4.42 ± 0.63 | <.01 |
| Center to C135°, cm | 4.37 ± 0.66 | 4.17 ± 0.62 | 4.31 ± 0.63 | 4.49 ± 0.64 | 4.69 ± 0.70 | <.01 |
P50, 50th percentil; P90, 90th percentil; TA, thoracic aorta; TAC, thoracic aorta calcium.
Adjusted for age, sex, body surface area, hypertension, and hypercholesterolemia.
Probability of Having Increasing Levels of Thoracic Aorta Calcium per 1 Standard Deviation Increase in the Values of Geometric Variables
| Geometric variables | 0 < TAC ≤ P50 (n = 142) OR (95CI%) | P50 < TAC ≤ P90 (n = 382) OR (95CI%) | TAC > P90 (n = 94) OR (95CI%) |
|---|---|---|---|
| Descending diameter, cm | 1.48 (1.06,2.08)a | 1.68 (1.29,2.20)b | 3.62 (2.30,5.91)b |
| Aortic taper, % | 0.78 (0.61,0.98)a | 0.73 (0.61,0.87)b | 0.60 (0.44,0.80)b |
| Arch volume, mL | 1.32 (0.99,1.76) | 1.35 (1.09,1.68)c | 1.78 (1.27,2.53)b |
| Descending volume, mL | 1.17 (0.84,1.64) | 1.38 (1.07,1.80)a | 2.67 (1.78,4.11)b |
| Total volume, mL | 1.12 (0.80,1.56) | 1.29 (1.01,1.67)a | 2.18 (1.47,3.30)b |
| Tortuosity, % | 0.98 (0.76,1.26) | 1.24 (1.02,1.52)a | 1.35 (1.01,1.81)a |
| Mean diameter, cm | 1.16 (0.84,1.61) | 1.18 (0.94,1.49) | 1.85 (1.26,2.769)c |
| Arch width, cm | 1.12 (0.80,1.58) | 1.24 (0.98,1.59) | 1.74 (1.20,2.57)c |
| Arch diameter, cm | 1.32 (0.99,1.78) | 1.12 (0.90,1.39) | 1.67 (1.18,2.41)c |
| Center to C45°, cm | 1.01 (0.75,1.34) | 1.18 (0.95,1.48) | 1.62 (1.15,2.29)c |
| Center to C135°, cm | 0.85 (0.64,1.12) | 1.10 (0.89,1.35) | 1.58 (1.16,2.16)c |
| Arch height, cm | 0.86 (0.68,1.09) | 1.02 (0.86,1.22) | 1.23 (0.93,1.62) |
| Ascending diameter, cm | 0.93 (0.70,1.24) | 0.99 (0.81,1.21) | 1.15 (0.83,1.61) |
| Ascending volume, mL | 0.91 (0.68,1.20) | 1.01 (0.83,1.21) | 1.14 (0.84,1.54) |
95%CI, 95% confidence interval; OR, odds ratio; P50, 50th percentil; P90, 90th percentil; TAC, thoracic aorta calcium.
The logistic regression was adjusted for age, sex, body-size area, and the presence of hypertension and hypercholesterolemia.
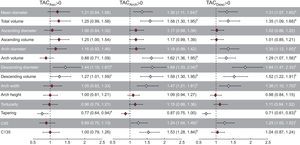
The odds of having TAC for each TA segment is shown in Figure 5. Greater odds of having TAC in all segments was associated with a larger descending TA mean diameter and volume. Additionally, the odds of having TAC in the ascending segment increased with less aortic taper. The TAC in the aortic arch was associated with mean diameter and total volume, arch volume, arch width, and distances to C45° and C135°. Similar associations were found for descending segments, adding arch diameter and tapering but excluding distance to C135°. The ascending TA size, the arch height and TA tortuosity were not associated with the presence of TAC in any segment.
![Probability (odds ratio [95% confidence interval]) of having calcifications in the ascending, arch and descending thoracic aorta segments for 1 standard deviation increase in each geometric variable. Arch, aortic arch; Asc, ascending; Arch, aortic arch; Desc, descending; TAC, thoracic aorta calcium. aP < .01. bP < .001. cP < .05.](https://static.elsevier.es/multimedia/18855857/0000006900000009/v3_201609140056/S1885585716300081/v3_201609140056/en/main.assets/gr5.jpeg?xkr=eyJpdiI6IjRFc1dlM0s4b0loSUtMN1YxTTJ3SGc9PSIsInZhbHVlIjoicERqczBoUHQvMC94aEtTekRZTmw4WENxc2R3SExEaHV0cDZYZWM5bTZLb3JkZTBoVFNUeTBiU25yc0NIT0Fqdk9oSjBocGxBZ1VhSEV4NnQ4Y2wwRmpWYjVWSWh1MUFuZHNnTHUyaDdyVnVyWXI4Q0dNTnRuZ1FPVjNxcjZrMDlDcHpuUWIyRngrRUl5SjJpSkc5U3Z6Y2dEWkQrenNxZnR6b2tFTU5nS0RvMjFRemx3OUFMR1pKbFE4WHlhV29hc01RbFZKaEFwMmN1WjQ1dGdPSnIybFpEclE1NndKeE9QU0tnczZYRTNybk53ODFjUHFRc0FacnhPbmJPZHJDd1YwcXhQWlFacmhLbncvbE1xMFdPVFFIMGpoZlY5RHg5UHl1di8relhCT1E9IiwibWFjIjoiMzU1ZjdjM2NjMjllMTVhMTM5NDkyNmQwOTdhYWMwZTc1ZjZlMmEwMDI2NTgwYWE5NTk1YThmMDM5MDE1YmU5NiIsInRhZyI6IiJ9 "Probability (odds ratio [95% confidence interval]) of having calcifications in the ascending, arch and descending thoracic aorta segments for 1 standard deviation increase in each geometric variable. Arch, aortic arch; Asc, ascending; Arch, aortic arch; Desc, descending; TAC, thoracic aorta calcium. aP < .01. bP < .001. cP < .05.")
Probability (odds ratio [95% confidence interval]) of having calcifications in the ascending, arch and descending thoracic aorta segments for 1 standard deviation increase in each geometric variable. Arch, aortic arch; Asc, ascending; Arch, aortic arch; Desc, descending; TAC, thoracic aorta calcium. aP < .01. bP < .001. cP < .05.
To the best of our knowledge, this is the first study that has analyzed the calcifications and the geometry of the TA simultaneously to investigate the association of vessel morphology with the presence and extent of TAC. Both calcification and geometry were accurately assessed in 3 dimensions and in the entire TA in a cohort of 970 participants at increased cardiovascular risk using MSCT images. Several TA geometric variables were associated with the presence, extent, and location of TA calcifications, independently of age, sex, and traditional risk factors. The main finding of our study with clinical implications is that dilatation of the descending aorta-with a consequent reduction in aortic taper was strongly associated with higher odds of finding TAC, whereas the size of the ascending portion was not related to TAC.
It is difficult to determine if the loss of aortic taper is the cause or the consequence of higher levels of TAC. Generally, calcifications were mostly concentrated in the arch and descending aortic segments4,16,17 and geometry might help to explain this heterogeneous distribution. While nonoscillatory shear stress is thought to facilitate the formation of fatty infiltrations and cholesterol-rich plaques, calcifications are formed in locations where low shear stress but rapid stress fluctuations are observed.18,19 Aortic narrowing stabilizes blood flow and delays the attenuation of the helical flow,3 whereas aortic taper accelerates the flow velocity into the descending region, avoiding flow stagnation and plaque formation.9 In addition, the influence of the helical flow pattern was suggested to suppress areas of flow stagnation so as to prevent the accumulation of lipids, in particular along the ascending and arch segments.3 On the other hand, as the atherosclerotic process begins earlier in the descending aorta,20 the enlargement of the descending TA may be interpreted as a compensatory mechanism to counteract vessel stiffening and progression of lumen stenosis.21,22 From one perspective, the TA geometry has a direct influence on blood flow velocity profiles, producing predisposed sites for calcification. However, TAC can also be seen as the expression of an arteriosclerotic disorder that actually produces a geometric deformation. Unfortunately, the nonenhanced MSCT technique cannot differentiate between vascular calcification within the intima (in the context of atherosclerotic plaques) and/or within the media (associated with arteriosclerosis21), although both seem involved in TAC detection.23 Medial calcifications are an indicator of aortic wall disease that may weaken the resistance of the aortic wall to tensile stresses and mechanical forces, promoting a chronic aortic dilatation. As the size increases, a vicious enlargement circle might be triggered. Although it was suggested that atherosclerosis may play a minor role in aortic dilatation with respect to aging and other risk factors,20 its influence should not be neglected because the effects are concentrated in the distal portion of the TA where: a) half of all TA aneurysms occur, and b) endovascular stent grafting is quickly becoming the preferred choice of treatment.24 Briefly, aortic geometry probably influences the location of intimal calcifications whereas medial calcifications could be more associated with aortic stiffening and might be responsible for descending TA dilatation as a compensatory mechanism. The cross-sectional nature of our study does not permit conclusions to be drawn on the cause-effect relationship.
When the TA geometry was analyzed as a function of increasing levels of TAC, several geometric variables were progressively involved in calcium accumulation, independently of age, sex, and traditional risk factors (Table 4). Interestingly, the descending aorta dilatation and loss of tapering were the first anatomic variables that changed in patients with small amounts of calcium, and could indicate the first steps in aortic atherosclerotic disease. Morphological and functional analyses should be complemented to improve the prediction of acute cardiovascular diseases.25 Vascular calcifications were found to correlate to artery wall forces for different vascular beds26 and to increased TA stiffness.27 These encouraging results indicate that the strategy of identifying geometrical and functional risk factors to better understand the mechanisms of atherosclerosis should persist.
Sex differences in the presence and extent of calcification in the aorta are not entirely clear.28 We did not find significant differences in TAC between men and women when adjusted for age and body-size area, although higher scores were seen in women (Table 2, Figures 3 and 4). Allison et al29 identified the proximal TA as the only vascular bed where the prevalence of calcification was higher in younger women (< 50 years) compared with men. Other studies found a higher prevalence of TAC in women for all ages28,30 but contradictory results were also reported.31 The aortic arch was reported as a vulnerable site for calcification among women4,32 and might explain the global tendency reported in our study. There is good evidence that the development of osteoporosis in women, as a metabolic bone calcium process, can also help to explain this higher prevalence.33
LimitationsOur study had some limitations. First, as previously mentioned, discerning between TAC and TA morphology as the exposure or the outcome could not be elucidated from this cross-sectional study. Second, the participants were at risk for cardiovascular disease and therefore the results cannot be extrapolated to the general population. Third, the radiation dose required by our enlarged field of measurement in order to incorporate the aortic arch was slightly greater than the radiation dose when measuring TAC during traditional coronary artery calcium detection.
Finally, our findings have some clinical implications. At first, the mechanisms of early dilatation of the TA may be different between descending aorta and aortic arch and ascending aorta. Indeed, assuming that TAC is an indicator of atherosclerotic disease, the association of TAC with dilatation of the descending aorta and aortic arch is in favor of mechanisms of atherosclerosis-related aortic dilatation. Our analysis confirms the concept that TA disease is divided into 2 entities: the ascending segment is nonarteriosclerotic in contrast with the descending segment where atherosclerosis is abundant.1 On the other hand, the absence of an association of TAC with dilatation of the ascending aorta suggests that the latter may be not be mainly linked to atherosclerosis and might depend on other mechanisms. Among them, genetic diseases of the ascending aortic wall with respect to valve malformation play a major role in the development of aneurysms of the ascending TA. Secondly, our findings also have implications about therapeutic interventions to slow or prevent aortic dilatation toward future aneurysms. The atherosclerotic nature of descending aorta dilatation suggests that conventional antiatherosclerotic interventions based on aggressive correction of traditional risk factors are important. The therapeutic prevention of ascending aorta dilatation is unclear due to its lack of direct association with atherosclerotic disease. The current recommendations suggest the use of beta-blocking medication to prevent progression toward aneurysms, probably because this type of drug may modify the blood flow velocity patterns involved in this aortic segment and attenuate the systolic impact on the aortic wall. All of these clinical implications, however, need to be confirmed by further studies.
CONCLUSIONSIn this study, we showed that TA calcification was associated with TA geometry, independently of age, sex, body surface area, and traditional risk factors. Possible relationships between TA geometry and vascular calcification should be analyzed in terms of blood flow patterns and compensatory biomechanical mechanisms within the artery wall. Thoracic aorta calcium was positively correlated to the size of the descending aorta and of the aortic arch, but not to the size of the ascending aorta. This suggests that TA dilatation may have different mechanisms and consequently different preventive strategies according to the observed segments.
CONFLICTS OF INTERESTNone declared.
- -
Calcium deposits in arteries are a sign of atherosclerosis and have been associated with a higher risk of mortality and cardiovascular events.
- -
Calcifications in the coronary arteries and TA can be accurately assessed using cardiac computed tomography scans, but the aortic arch is usually excluded.
- -
The TAC and measurement has been recognized to improve cardiovascular risk prediction beyond traditional risk factors.
- -
The TAC has been associated with coronary, cerebral and peripheral vascular disease but the role of geometry on the presence and the extent of calcifications is less well known.
- -
The TAC and detailed aortic 3-dimensional geometry were simultaneously assessed using low-dose nonenhanced computed tomography images and including the aortic arch.
- -
Several aortic geometrical variables were associated with the presence, extent and location of calcifications, independently of age, sex, and traditional risk factors.
- -
The TAC was positively related to the size of the descending aorta and aortic arch, but not to the size of the ascending aorta.
- -
The TA dilatation may have different mechanisms and consequently different preventive strategies according to the segments considered.
We thank Sandra Wray for her valuable help in the revision of this manuscript.