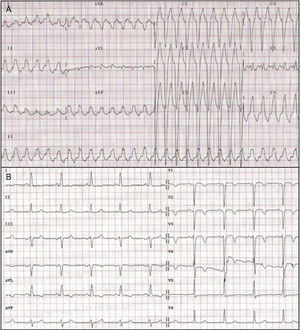
The electrocardiogram of the tachycardia (Figure 1A) shows left bundle branch block morphology and an inferior axis, with a QRS width > 160 ms. It also shows a Q wave in the aVR lead > 40 ms. These observations point to ventricular tachycardia (VT). The RS interval of 95 ms is at the limit of normal. Figure 1B shows an intraventricular conduction disorder (IVCD) in sinus rhythm.

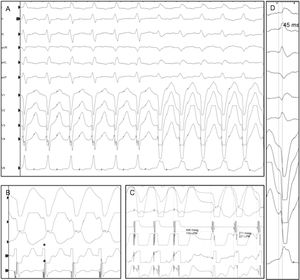
As can be seen in Figure 2A, the morphology of tachycardia is reproduced with change in the QRS morphology during an atrial pacing train, indicating aberrantly conducted supraventricular tachycardia (response 2, correct). With the extrastimuli test, nodular re-entry tachycardia was induced (simultaneous VA, indicated with an asterisk in Figure 2B), with a return cycle from the apex to the right ventricle of 177ms (Figure 2C).

Datino et al.1 showed by atrial pacing that the specificity of classic VT criteria decreases considerably in the case of IVCD (consequently answers 1 and 3 are incorrect). In these cases, the R wave peak time in lead II ≥ 50 ms (45 ms in this case; Figure 2D) and the absence of RS complexes in precordial leads have high specificity and sensitivity for diagnosis of VT (0.97 and 0.88, respectively).
.