The reported incidences of stenosis after radiofrequency ablation of pulmonary veins are highly variable. Moreover, most studies have focused on severe stenosis and have overlooked mild stenosis. Our aims were to study postablation morphological changes in the pulmonary veins and to evaluate preablation magnetic resonance imaging predictors for stenosis.
MethodsEighty consecutive patients with atrial fibrillation underwent cardiac magnetic resonance imaging before undergoing radiofrequency ablation. Magnetic resonance imaging was repeated a median of 95 days after ablation. Ostium area/ellipticity and atrial volume were blindly assessed. We evaluated the presence of stenosis and classified it as mild (< 50% area reduction), moderate (50%-70%), and severe (> 70%).
ResultsPostablation stenosis was identified in 78 of 322 veins (24.2%). The stenosis was mild in 66 (84.6%), moderate in 11 (14.1%), and severe in 1 (1.3%). All of them were asymptomatic. The left inferior pulmonary vein showed the highest frequency of stenosis, which was detected in 26% of them (P < .001). A multiple regression analysis revealed that left inferior pulmonary vein (odds ratio = 3.089; P = .02) and a greater preablation ostium area (odds ratio = 1.009; P < .001) were independent predictors for postablation stenosis. Age (odds ratio = 1.033) showed a strong trend to statistical significance (P = .06).
ConclusionsAfter ablation, vein ostia size is reduced and stenosis is detected in less than one third of patients. Most cases are mild, and severe stenosis is rare. Postablation stenosis is more likely to develop in older patients, those with larger vein ostia, and in the left inferior pulmonary veins.
Keywords
Atrial fibrillation (AF) is the most common arrhythmia. The incidence of AF is likely to rise because of the increasing age of the population.1 The left atrium and proximal pulmonary veins (PVs) play key roles in the initiation and maintenance of AF.2 This disorder can be initiated by rapid ectopic beats originating in sleeves of left atrium myocardium extending into the PVs.3 Over the past decade, PV isolation by means of multiple consecutive radiofrequency energy applications around PV ostia has emerged as an effective and increasingly important therapeutic option for the treatment of AF.3–6
Stenosis of the PV has been identified as a complication of this procedure.7–9 Its risk may be minimized by reducing the radiofrequency energy delivered and by avoiding applications inside the PVs.6,10,11 Consequently, detailed knowledge of the PV anatomy in each patient may be essential to optimize PV isolation.12
Several studies have evaluated the incidence of severe PV stenosis after ablation, reporting percentages ranging widely from 0.0% to 42.4%.9,13–16 However, little is known about minor degrees of luminal loss after ablation.
The aims of this study were: a) to accurately assess PV anatomical remodelling after ablation, and b) to look for potential predictors of risk of PV stenosis based on analysis of magnetic resonance imaging (MRI) studies performed before and after radiofrequency ablation of AF.
METHODSPatients and Ablation ProcedureWe studied 80 consecutive patients with symptomatic recurrent AF (either paroxysmal or persistent) refractory to antiarrhythmic drugs who were referred for AF radiofrequency ablation, in whom contrast-enhanced MRI was obtained before and approximately 3 months after the procedure (median of 95 days [interquartile range, 90-104 days]).
The ablation approach was ostial PV isolation using irrigated tip catheters (Navistar and Navistar Thermo-cool; Biosense Webster) and circular decapolar catheters (Lasso; Biosense Webster) with simultaneous use of an electro-anatomical mapping system (CARTO; Biosense-Webster) integrated with 3-dimensional MRI. The end point of ablation was to achieve bidirectional PV conduction block in all PVs.
The study protocol was approved by the local ethics committee and study patients gave written informed consent for the MRI and the ablation procedure.
Image AcquisitionThe cardiac MRI was performed with a 1-T (Signa LX; GE Medical Systems) or a 1.5-T system (Sigma Excite; GE Medical Systems). Gadolinium contrast injection timing for the angiographic sequence was performed either with a bolus tracking technique or a previous bolus timing acquisition (2mL gadolinium contrast at a rate of 2mL/s followed by a bolus of 20-30mL of physiological solution at 2mL/s), followed by a gadolinium-enhanced, breath-hold, 3-dimensional angiography in the coronal plane covering the left atrium and PVs (20mL of gadopentetate dimeglumine at a rate of 2mL/s followed by a bolus of 20 mL to 30mL of physiological solution at 2mL/s).
Electrocardiography-gated cine imaging was done to measure left atrium volumes using spoiled gradient echo sequences (1-T system) or steady-state free precession sequences (1.5-T system) acquired in adjacent axial planes covering the left atrium and proximal PVs during breath holding.
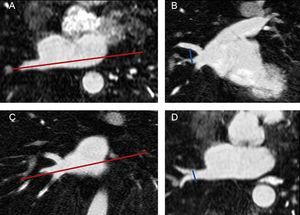
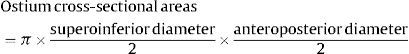
Pulmonary Vein and Left Atrium Morphometry MeasurementsImages from all studies were assessed by a reader who was blinded to whether the study had been performed before or after ablation. As shown in Figure 1, the superoinferior and anteroposterior diameters of each PV were assessed in 8 mm to 10 mm-thick slices of 2 long-axis MIP (maximum intensity projection) PV images (oblique coronal and oblique axial images) based on the long axis of the PV. The PV ostium was defined as the point of inflection between the left atrium wall and the PV wall. The ostium cross-sectional area was estimated by the formula:
. The superoinferior diameter of each pulmonary vein was measured in an oblique coronal image reconstruction (B) based on the plane showed in A. Long axis of the pulmonary vein in a coronal plane (C). The anteroposterior diameter was measured in an oblique axial image (D) based on the plane showed in C. The pulmonary vein ostium was defined as the point of inflection between the left atrium wall and the pulmonary vein wall.")
Measurement of pulmonary vein diameters. Long-axis of the pulmonary vein in an axial plane (A). The superoinferior diameter of each pulmonary vein was measured in an oblique coronal image reconstruction (B) based on the plane showed in A. Long axis of the pulmonary vein in a coronal plane (C). The anteroposterior diameter was measured in an oblique axial image (D) based on the plane showed in C. The pulmonary vein ostium was defined as the point of inflection between the left atrium wall and the pulmonary vein wall.
Baseline and postablation PV cross-sectional areas were assessed at the PV ostium, at 3-mm intervals and at the point of maximal narrowing.
The ostium elipticity was calculated as follows:

This formula results in a value between 0 (circumference) and 1 (straight line). The distance from PV ostium to the first branching and PV angles in reference to the axial and coronal planes of the body were also assessed.
Left atrium diameters (anteroposterior, transversal and longitudinal) and volumes (end-systolic and end-diastolic) were measured.
The MIP and the MPVR (multiprojection volume reconstruction) reformations were performed with the aid of commercial volume-visualization software (Advantage Workstation 4.2; GE Medical Systems).
For determination of interobserver agreement, PV measurements were independently carried out by an MRI reader with 15 years’ experience. For determination of intraobserver agreement, each study was reread by the initial reader in a blinded fashion after 1 year.
Pulmonary Vein StenosisPulmonary vein stenosis was defined as a PV diameter narrowing greater than twice the standard deviation of the intraobserver differences. Pulmonary vein stenoses were categorized into concentric (narrowing of both superoinferior and anteroposterior diameters) or excentric (narrowing of one diameter). Depending of the degree of reduction in the PV cross-sectional area, PV stenoses were categorized as mild (< 50%), moderate (50% to 70%), or severe (> 70%).
Statistical AnalysisContinuous variables did not follow a normal distribution according to the Shapiro-Wilk's test, and thus they are presented as median [interquartile range] and were compared with the Mann-Whitney U test. Categorical variables were compared using the chi-square test. Generalized estimating equations analysis was performed to identify clinical and anatomical predictors of PV postablation stenosis. Unlike conventional logistic regression, which uses the assumption of independent cases, the method used here (generalized estimating equations) takes into account that cases are correlated (measurements of several veins within each patient), which yields more reliable odds ratio estimations. Clinically relevant variables (age, sex, hypertension, structural heart disease, and type of AF) and morphometric variables potentially associated with luminal loss after ablation (left atrium volumes, type of PV, PV ostial area, PV ostial ellipticity, PV angulation, and distance to the first branching) were tested in the multivariate analysis. All variables were initially included in the model and then a stepwise backward selection of variables was done with the P value set at .25 for entering and .10 for exclusion. Intraclass correlation coefficient analysis was carried out to assess the inter- and intraobserver reproducibility of measurements. The Fleiss categories describe the strength of agreement: > 0.75 = high agreement; 0.41-0.75 = moderate agreement; < 0.40 = poor agreement. Data analyses were performed using JMP software (7.0) and SPSS (19.0) with a 2-sided significance level of 0.05.
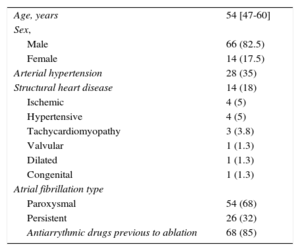
RESULTSThe baseline characteristics of the study population are included in Table 1. A total of 304 PVs were targeted in 80 patients. We achieved PV bidirectional block in all targeted PVs. There were complications associated with the ablation in 5 of 80 patients (6.3%) (femoral arteriovenous fistula in 2 patients, femoral hematoma in 1 patient, air embolism with normal coronariography in 1 patient and mitral tendinous cord lesion in 1 patient).
Characteristics of the Study Population
| Age, years | 54 [47-60] |
| Sex, | |
| Male | 66 (82.5) |
| Female | 14 (17.5) |
| Arterial hypertension | 28 (35) |
| Structural heart disease | 14 (18) |
| Ischemic | 4 (5) |
| Hypertensive | 4 (5) |
| Tachycardiomyopathy | 3 (3.8) |
| Valvular | 1 (1.3) |
| Dilated | 1 (1.3) |
| Congenital | 1 (1.3) |
| Atrial fibrillation type | |
| Paroxysmal | 54 (68) |
| Persistent | 26 (32) |
| Antiarrythmic drugs previous to ablation | 68 (85) |
Data are expressed as No. (%), or median [interquartile range].
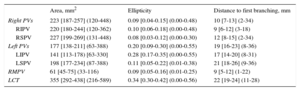
The classical pattern of 4 single PVs was present in 51 of 80 patients (64%); 15 of 80 (19%) had a left common trunk, 17 of 80 (21%) had an independent right middle PV and 3 of 80 (4%) had a left common trunk and an independent right middle PV simultaneously. As shown in Table 2, right-sided PV ostia were larger and rounder than left-sided PV ostia (P < .001 for both comparisons). Inferior PVs were smaller than superior PVs (inferior PVs ostia area: 182 [141-227] mm2 vs superior: 215 [188-247] mm2; P < .001) and were more oval (inferior PVs ellipticity: 0.16 [0.07-0.28], vs superior PVs ellipticity: 0.09 [0.04-0.17]; P < .001]. The most elliptical and smallest ostia of the 4 PVs were seen in the left inferior PV (P < .001 for both comparisons). The right superior PV showed the roundest and largest ostia but this difference was not statistically significant. The longest distance between the PV ostium and the first branching was found at the left superior PV (P < .001) and the shortest at the right inferior PV (P < .001). This distance was greater at the left-sided veins than at the right-sided veins (media of the difference, 8.7mm; 95% confidence interval, 7.5-9.9; P < .001).
Pulmonary Vein Morphometrics
| Area, mm2 | Ellipticity | Distance to first branching, mm | |
|---|---|---|---|
| Right PVs | 223 [187-257] (120-448) | 0.09 [0.04-0.15] (0.00-0.48) | 10 [7-13] (2-34) |
| RIPV | 220 [180-244] (120-362) | 0.10 [0.06-0.18] (0.00-0.48) | 9 [6-12] (3-18) |
| RSPV | 227 [199-269] (131-448) | 0.08 [0.03-0.12] (0.00-0.30) | 12 [8-15] (2-34) |
| Left PVs | 177 [138-211] (63-388) | 0.20 [0.09-0.30] (0.00-0.55) | 19 [16-23] (8-36) |
| LIPV | 141 [113-178) [63-330] | 0.28 [0.17-0.35] (0.00-0.55) | 17 [14-20] (8-31) |
| LSPV | 198 [177-234] (87-388) | 0.11 [0.05-0.22] (0.01-0.38) | 21 [18-26] (9-36) |
| RMPV | 61 [45-75] (33-116) | 0.09 [0.05-0.16] (0.01-0.25) | 9 [5-12] (1-22) |
| LCT | 355 [292-438] (216-589) | 0.34 [0.30-0.42] (0.00-0.56) | 22 [19-24] (11-28) |
LCT, left common trunk; LIPV, left inferior pulmonary vein; LSPV, left superior pulmonary vein; PVs, pulmonary veins; RIPV, right inferior pulmonary vein; RSPV, right superior pulmonary vein; RMPV, right middle pulmonary vein.
Data are expressed as [interquartile range] (range).
Univariate analysis showed larger ostia in men (men: 209 [173-241] mm2 vs women: 185 [143-216] mm2; P = .002), in patients with hypertension (214 [173-246] mm2 vs 198 [161-233] mm2; P = .05), structural cardiomiopathy (P = .03), persistent AF (222 [180-258] mm2 vs 194 [161-230] mm2; P < .001), and larger left atrium size. Multiple regression analysis revealed that only left atrium size was an independent predictor of PV size.
Pulmonary Vein StenosisThe intraclass correlation coefficient was 0.96 for intraobserver reproducibility and 0.85 for interobserver variability in PV diameter measurement (high agreement according to Fleiss’ categories). The standard deviation of the intraobserver and interobserver differences was 1.625mm, without differences in superoinferior and anteroposterior diameters. Thus, PV stenosis was defined as narrowing of any PV diameter (superoinferior or anteroposterior) > 3.25mm.
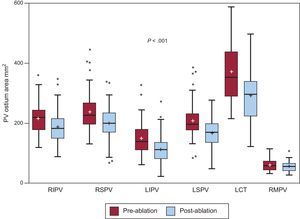
Overall, there was a median reduction of 32mm2 [7.7–57.7mm2] in PV ostial area after ablation (Figure 2).This reduction was not associated with changes in left atrium volume.
![Pre- and postablation pulmonary vein ostium area. Box-plot graphs showing the difference between pulmonary vein cross-sectional areas before and after ablation. LCT, left common trunk; LIPV, left inferior pulmonary vein; LSPV, left superior pulmonary vein; PV, pulmonary vein; RIPV, right inferior pulmonary vein; RMPV, right middle pulmonary vein; RSPV, right superior pulmonary vein. Boxes represent the median [interquartile range]. Whiskers show the minimum and maximum values, except when an outlier value is found, which is depicted as a point. Mean is displayed as “+”.](https://static.elsevier.es/multimedia/18855857/0000006800000012/v2_201608210100/S1885585715000808/v2_201608210100/en/main.assets/gr2.jpeg?xkr=eyJpdiI6IkJGdG1MdmlsemtMVWtCMm5KblNwcHc9PSIsInZhbHVlIjoieFdBQ1VZTEhqRUlXZ09xeDlZdEx4UjFwV2lleGtkZk5ob0RqRmx6RjZ3c29qVC9uU0drN2tKV3lTblNYV1VXTlFYMzFKNUQ1TVRnbmVYU25FWWMwek5CbXdldERUUkYyS25EcEFWTzFoUTFSbVZpa2FVQ3ovcGhRTHl4Q0NEdmZNeWx1YjUyaThTblNxMHk0QlhHdWt5eVRTOGtJUlhpZUFUMVV1aTJmQ3dHLzNlR2hmZDhVcXBTVmcxZXR6WnY2amg2MmJ3WlAwUnYzZDlybkJLNEIyYkg2OE9SWGpPcUN5NDNQdU1EN3FOU0M2THpvcXNnell5ZkhqZFhOZFQ1WjF4NFdVM29lQVRLMGJCZ25KejUrNnpQbG0rOWVFWUx2VEVnb0JkME85TG89IiwibWFjIjoiYzJjNmMxZWY0YmEwNzhkZWQwYzI2YzM5NDc3M2ZmNzIzYjE2NTRlNWVkZDFjYTg2YzkzMzVjODExMDE5MTZiMiIsInRhZyI6IiJ9 "Pre- and postablation pulmonary vein ostium area. Box-plot graphs showing the difference between pulmonary vein cross-sectional areas before and after ablation. LCT, left common trunk; LIPV, left inferior pulmonary vein; LSPV, left superior pulmonary vein; PV, pulmonary vein; RIPV, right inferior pulmonary vein; RMPV, right middle pulmonary vein; RSPV, right superior pulmonary vein. Boxes represent the median [interquartile range]. Whiskers show the minimum and maximum values, except when an outlier value is found, which is depicted as a point. Mean is displayed as “+”.")
Pre- and postablation pulmonary vein ostium area. Box-plot graphs showing the difference between pulmonary vein cross-sectional areas before and after ablation. LCT, left common trunk; LIPV, left inferior pulmonary vein; LSPV, left superior pulmonary vein; PV, pulmonary vein; RIPV, right inferior pulmonary vein; RMPV, right middle pulmonary vein; RSPV, right superior pulmonary vein. Boxes represent the median [interquartile range]. Whiskers show the minimum and maximum values, except when an outlier value is found, which is depicted as a point. Mean is displayed as “+”.
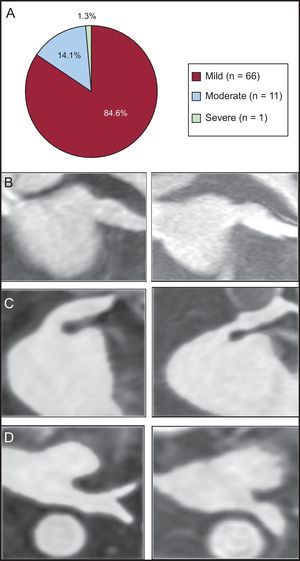
A PV stenosis was observed in 78 out of the 322 analyzed veins (24.2%). The stenosis was mild in 66 of 78 PVs (84.6%), moderate in 11 of 78 veins (14.1%), and severe in 1 of 78 veins (1.3%) (Figure 3A). All patients with PV stenosis were asymptomatic and none required treatment. The greatest rate of stenosis was seen in the left inferior PV (24 of 65). Indeed, the only severe stenosis was identified in a left inferior PV (cross-sectional area reduction percentage of 78%), as shown in Figures 3B-D.
. B-D: gadolinium enhanced 3-dimensional magnetic resonance imaging sequence reformations. B: mild stenosis of a left superior pulmonary vein, oblique coronal plane. C: moderate stenosis of a left superior pulmonary vein, oblique coronal plane. D: severe stenosis of a left inferior pulmonary vein, axial plane.")
Pulmonary vein stenosis. A: frequency of stenosis according to the cross sectional area reduction percentage (mild < 50%; moderate: 50-70%; severe: > 70%). B-D: gadolinium enhanced 3-dimensional magnetic resonance imaging sequence reformations. B: mild stenosis of a left superior pulmonary vein, oblique coronal plane. C: moderate stenosis of a left superior pulmonary vein, oblique coronal plane. D: severe stenosis of a left inferior pulmonary vein, axial plane.
The PV stenosis was excentric in 58 PVs (74%) and concentric in 20 (26%). No difference was found in the frequency of reduction of superoinferior or anteroposterior diameters. The ratio excentric to concentric PV stenosis was similar in all PVs. Most of the moderate stenosis (8 of 78, 73%) and the single case of severe stenosis were concentric while most of the mild cases of stenosis (55 of 66, 83%) were excentric (P < .001).
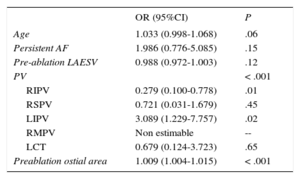
A multiple regression model including clinical factors and morphometric characteristics of PVs and left atrium revealed that a left inferior PV type of PV (odds ratio = 3.089, 95% confidence interval, 1.229-7.757; P = .02) and greater preablation ostia cross-sectional area (odds ratio = 1.009, 95% confidence interval, 1.004-1.015 per 1mm2 increase; P < .001) were independent predictors of PV stenosis (Table 3). Older age (odds ratio = 1.033, 95% confidence interval, 0.998-1.068 per 1 year older) showed a very strong trend to statistical significance (P = .06).
Predictors of Postablation Stenosis
| OR (95%CI) | P | |
|---|---|---|
| Age | 1.033 (0.998-1.068) | .06 |
| Persistent AF | 1.986 (0.776-5.085) | .15 |
| Pre-ablation LAESV | 0.988 (0.972-1.003) | .12 |
| PV | < .001 | |
| RIPV | 0.279 (0.100-0.778) | .01 |
| RSPV | 0.721 (0.031-1.679) | .45 |
| LIPV | 3.089 (1.229-7.757) | .02 |
| RMPV | Non estimable | -- |
| LCT | 0.679 (0.124-3.723) | .65 |
| Preablation ostial area | 1.009 (1.004-1.015) | < .001 |
95%CI, confidence interval; AF, atrial fibrillation; LAESV, left atrial end-systolic volume; LCT, left common trunk; LIPV, left inferior pulmonary vein; OR, odds ratio; PV, pulmonary vein; RIPV, right inferior pulmonary vein; RMPV, right middle pulmonary vein; RSPV, right superior pulmonary vein.
Our results show that MRI performed before catheter ablation of the PVs in patients with AF can be useful not only for the assessment of the number, position, and size of the venous ostia but also to predict the risk of postradiofrequency ablation stenosis.
Computed tomography and MRI are good techniques to assess PV anatomy.2,8,17,18 Information provided by preablation MRI is very helpful for interventional cardiologists as it allows them not only to select an appropriate catheter but also to ascertain that all PV ostia are evaluated during the procedure. Assessment of these features at conventional angiography may be suboptimal, as only the superior and inferior borders of the PV ostia are displayed.
Morphometric Characterization of Pulmonary Veins and AtriaOur findings regarding anatomical pattern, size and shape of PVs are in agreement with most previous studies using computed tomography or MRI.17,19–23 However, our diameter measurements in patients from south-western Europe are slightly below those reported in patients from North America and central Europe.
Consistent with a recent large study,19 PV ostia were larger in our patients with persistent AF. Other studies found no differences between the 2 groups.2,8,22 However, in our study this association lost statistical significance when adjusted by left atrium volume, suggesting that the enlargement of PV is a process linked to the enlargement of the left atrium as a consequence of the atrial remodelling that occurs in these patients.
Incidence of StenosisThe true incidence of postablation PV stenosis remains uncertain as percentages from 0% to 42.4% have been reported.15,16,24–26 We found mild stenosis in 66 out of the 322 analyzed veins (20.5%), moderate stenosis in 11 of 322 veins (3.4%), and severe stenosis in 1 of 322 veins. Among the possible causes of these differences are the criteria for definition of stenosis (eg, measurement of 1 diameter vs only cross-sectional area or considering stenosis only when reduction > 50%), different diagnostic methods and diverse ablation techniques.
Preablation Predictors for StenosisOlder patients, those with larger PV ostia and the left inferior PVs had a higher risk of postablation PV stenosis. Although technical ablation factors such as number, time, temperature, and power of applications in the PVs are involved in stenosis,7,27,28 little is known about morphometric predictors of stenosis.
Regarding age, a higher frequency of discontinuity and hypertrophy and a higher degree of fibrosis of the atrial myocardium have been reported in the PVs of patients with AF29 and in older patients.30 We believe that the additional fibrosis induced by radiofrequency applications in these potentially pathological PVs in aged patients could further contribute to stenosis.
Additionally, large preablation PV ostia were found to be a predictor for stenosis in this study. Several factors may be involved in this seemingly surprising result: a) enlarged PVs usually need more applications to be isolated, and b) the operator, consciously or not, may have been less conservative when ablating enlarged PVs. Consistent with our data, PV size (larger) has been described as a predictor of stenosis.14
Finally, as shown by previous studies,27,31 most stenoses occurred at the left inferior PV. However, as far as we know, this has not previously been reported to be an MRI predictor of stenosis. The oval shape of most left inferior PV ostia may contribute to prolonged contact of the ablation catheter with the anterior and posterior walls of the PV, which can lead to a more extense ablation than intended. In fact, most of the moderate and severe stenosis observed in left inferior PVs showed a greater reduction in the anteroposterior diameter.
LimitationsThe main limitation of our study was that postablation MRI was obtained after a median of 95 days; therefore, measurements might vary in a longer-term evaluation. Also, cardiac MRIs were performed with 1 T or 1.5 T systems, which is not state-of-the-art technology. However, these are the systems used in the clinical practice in most hospitals worldwide. Additionally, these systems allow 1.5 mm × 1.25 mm x 1.78mm voxel resolutions to be achieved, which is more than enough to accomplish the aims of this study. Note that we have only considered as stenosis reductions over 3.25mm (twice the standard deviation of intraobserver variability), which is around twice the resolution of the technique at any dimension, so it is not an important limiting factor. Finally, computed tomography imaging techniques would have provided better resolutions but at an added cost of radiating the patient twice (pre- and postablation).
CONCLUSIONSAfter ablation, PV luminal loss is seen, but stenosis is detected in less than one third of patients. Most cases of stenosis are mild, with severe stenosis being rare. Older patients, those with larger PV ostia and left inferior PVs are more likely to develop postablation stenosis.
FUNDINGJorge G. Quintanilla was supported by ERDF (European Regional Development Fund) and Instituto de Salud Carlos III: RD06/0003/0009 (REDINSCOR [Red Española de Insuficiencia Cardiaca]) and RD12/0042/0036 (RIC [Red de Investigación Cardiovascular]).
CONFLICTS OF INTERESTNone declared.