The prevalence of childhood obesity has increased in recent decades. The aim was to determine whether a 3-month intervention on daily physical activity at school could affect body weight and cardiovascular risk factors associated with childhood obesity.
MethodsA total of 137 children (12[1] years old) volunteered to participate in an observational cross-sectional study. Children were allowed to join one of the following groups: a) sedentary group (2h/week of physical education at school); b) active group (2h/week of physical education at school plus 3h/week extra physical activity), and c) sports group (2h/week of physical education at school plus 5h/week extra physical activity). Anthropometric characteristics, blood pressure, physical condition (estimated by the Course-Navette test), and biochemical parameters related with cardiovascular risk factors were determined.
ResultsBody weight, body mass index, waist circumference, sum of skinfold thickness, body fat percentage, and fat mass index of children were decreased with high physical activity level, whereas body water content significantly increased with activity. Parameters related with cardiovascular risk —triglycerides, insulin, systolic blood pressure, and homeostatic model assessment index— presented lower values in the sports group. Maximal oxygen uptake and maximum heart rate (Course Navette test) progressively increased with activity. Children participating in a total of 7h/week of physical activity presented significantly lower oddsratio of having high levels of the following cardiovascular risk factors: waist circumference, fat mass index, and homeostatic model assessment index.
ConclusionsPhysical activity is important for metabolic health in children. Children with higher levels of physical activity presented better anthropometric and biochemical profiles.
Keywords
.
IntroductionPhysical inactivity is a major risk factor for developing coronary artery disease. It also increases the risk of stroke and other major cardiovascular risk factors such as obesity, high blood pressure, low high-density lipoprotein cholesterol (HDL-C) and diabetes. These parameters together with hypertension, hypertriglyceridemia, elevated fasting blood glucose, and insulin resistance are used to define the metabolic syndrome in adults.1, 2.
In children, excess body weight and excess body fat are directly associated with increased levels of plasma insulin, lipids, lipoproteins, and blood pressure.3, 4 Physical activity in children is a preventive and therapeutic measure to reduce the risk of future cardiovascular diseases.5, 6 The global increase of obesity in children and adolescents could be attributed to decreased physical activity in addition to unhealthy lifestyle habits.5, 7 Physical activity can improve several risk factors, reducing low-density lipoprotein cholesterol (LDL-C) and triglyceride levels, raising HDL-C, improving insulin sensitivity, and lowering blood pressure.8, 9 However, it is not fully known what intensity of activity is useful for preventing cardiovascular risk factors and whether both moderate and vigorous activity are beneficial or deleterious..
Childhood obesity is associated with elevated blood pressure, cholesterol, and body mass index (BMI) that could progress to adult premature cardiovascular diseases.10 Indeed, several studies have found significant differences in systolic blood pressure (SBP) and diastolic blood pressure (DBP) between obese and nonobese children (aged 12–17 years), and children with high blood pressure presented greater risk of becoming hypertensive in their adult life.11, 12, 13 Current reports suggest that school-based physical activity interventions may be useful in the improvement of health parameters and lifestyle behaviors in children and adolescents, which could lead to reduced cardiovascular disease risk in adulthood.14.
Regular physical activity plays a significant role in enhancing and maintaining human health. However, the contribution of school-based physical education remains unacceptably low, and the time spent in free play is becoming increasingly scarce. The aim of this study was to determine whether a daily physical activity intervention at school would be associated with lower overweight and risk factors related to obesity in children..
MethodsA total of 330 students from 3 schools of Leon (Spain) with similar sociodemographic characteristics and with cafeteria service at school were interested in participating in the study. None of the participating schools had implemented a default program of physical activity. After the inclusion/exclusion criteria were applied, 137 students (82 boys and 55 girls, aged 11 to 13 years) took part in the study. All participants have the same level of maturity and similar habits. In order to be accepted for study participation, the children had to meet requirements for stage 3 of Tanner's Scale, which describes pubertal development).15, 16 This assessment of level of maturity was a critical point for comparisons because a difference of 1 or 2 years of chronological age affects physical condition, adiposity levels, body composition, HOMA (homeostatic model assessment), and lipid profile given the typical physiological hyperinsulinemia of pubertal status.17, 18 All these students were admitted to a group characterized by a specific number of hours of physical activity at school and extracurricular and weekly sports. Rather than being pre-assigned to a group, the children were divided into 3 groups based on their parents’ decision to enroll them in additional school sports programs over time: a) sedentary group (SE), completing 2h per week of physical education at school, according to Spanish Ministry of Education rules (n=45); b) active group (AC), also 2h per week of physical education at school plus 3h extra physical activity (n=61), and c) sports group (SP), adding 5h per week of physical activity to the 2h of weekly activity at school (n=31). The SE was considered the control group. The 3 groups were in the same academic year, and length of participation in the physical activity program was the same for all participants. The first interview with children and parents was during September (beginning of the classes at school) to decide their inclusion/exclusion. Parents completed a general questionnaire incorporating the following questions: parental education level (years and type of education: low, <6 years at school; medium, 6-12 years; high, >12 years of education) and socioeconomic level (based on their occupation and classified as low, medium, and high according to the methodology described by the Spanish Society of Epidemiology).19 Participant data—anthropometric characteristics, physical condition, and biochemical parameters related with cardiovascular risk factors—were obtained from students during the last 2 weeks of November, ensuring 3 months of participation in physical activity program (programs began with the school classes)..
Informed consent was obtained from parents or guardians and a complete medical report was required. No children had personal or family history of diabetes. Students completed a survey about lifestyle, dietary habits, and sport activity. Exclusion criteria included disinterest in the program, diagnosis of diabetes, and treatment with glucocorticoids, insulin sensitizers, psychotropics, and in general drugs that affect appetite control, along with not eating in the school dining room and not maintaining a good lifestyle..
The study protocol was approved by the Ethics Committee of the University of Leon and the board of governors from each school. Finally, the parents provided signed informed consent..
At the beginning of the study period, dietary assessment was completed. Four-day food records (including a weekend) were collected from all participating children with the help of their parents. Dietary records for total caloric and macronutrient intake were analyzed with the “diet and health” software (Alimentación y salud v2.0) according to standard food tables for Spanish populations. This software calculates dietary composition and, in particular, the percentage of fatty acids..
Weight was measured with a calibrated scale (Seca 703®, Germany). Height was obtained with a stadiometer (Detecto D52®, United States). The BMI was calculated using the traditional formula based on weight and height (BMI; kg/m2). The percentage of body fat and body water were measured by bioelectrical impedance analysis (Biodynamics 310®, United States)20. The percentage of body fat and height were used to calculate fat mass index (FMI; kg/m2). Normal weight and overweight were determined using sex-specific cut-offs for adolescents: 4.58kg/m2 in boys and 7.76kg/m2 in girls.21 Skinfold thickness was measured to the nearest 0.1cm with a Harpenden® calliper at biceps, triceps, subscapular, suprailiac, abdominal, front thigh (quadriceps), calf, and armpit on the left side of the body with the participant's arm relaxed. Skinfold measurements were taken 3 times and the mean was then used for analyses. To measure waist circumference, the subjects were asked to stand erect in a relaxed position with both feet together on a flat surface. Waist circumference, measured by a measuring tape, was defined as the smallest horizontal girth between the costal margins and the iliac crests at the end of a normal expiration..
The SBP and DBP were measured 3 times in the morning (8 AM) before breakfast. To determine the physical conditioning of children, cardiorespiratory fitness was estimated using the Course-Navette test during the physical education class.22 Heart rate was recorded each 5s (Polar Electro Oy®, Finland) during the Course-Navette test to determine the maximum heart rate achieved..
To determine the biochemical parameters related to health and cardiovascular risk factors, fasting blood samples were obtained in the morning by venopuncture of antecubital vein. After sample processing, serum concentrations of total cholesterol, triglycerides, HDL-C, LDL-C and glucose were measured by spectrophotometric methods in an autoanalyzer (Roche/Hitachi 917®, Japan). Atherogenic index was calculated from the LDL/HDL ratio. Insulin levels were determined by radioimmunoassay (Linco Research, St. Charles, Missouri, United States) at the laboratory of the Hospital Central de León. The homeostasis model assessment (HOMA) was calculated from fasting insulin in μUI/mL (IF) and glucose in mmol/L (GF): HOMA=(IF×GF)/22.5. The HOMA has been previously validated against the euglycemic clamp.23.
Statistical AnalysesKolmogorov-Smirnov test was applied to ensure a Gaussian distribution of the results. Significant differences between parameters were determined using a one-way analysis of variance. Newman-Keuls post-hoc analysis was used to adjust the P-value for the differences between groups due to multiple comparisons. Values were expressed as mean (standard deviation) and P<.05 was considered statistically significant. A multiple logistic regression analysis was used to evaluate the association between levels of physical activity and cardiovascular risk factors and percent overweight. Estimates are presented as odds ratio and 95% confidence interval. All statistical analyses were adjusted for sex, age, school type, school grade, and socioeconomic status. Multiple logistic regression models with polynomial contrast were used to generate P for trend. The cut-points chosen to dichotomize the cardiovascular risk factor were: overweight, including obesity (BMI>25kg/m2 for age and sex), waist circumference (>75th percentile for age and sex), FMI (boys, >4.58kg/m2; girls, >7.76kg/m2), fasting glucose level (>110mg/dL), triglyceride level (>110mg/dL), HDL-C level (<40mg/dL) and SBP or DBP (>90th percentile).21, 24 The percentages of overweight and obesity were calculated based on pooled international BMI data.25 The software used for statistical analysis was Statistica v. 5.0 (StatSoft Inc., Tulsa, Oklahoma, United States)..
ResultsNutritional habits were similar in the 3 groups studied (data not shown). No significant differences in the total energy intake and the percentage of carbohydrates, fats, and proteins were found. Children from all groups consumed a high protein and fat caloric diet, but with low carbohydrate intake..
Table 1 shows the differences in weight, height, BMI, percent of body fat, fat-free mass, FMI, and body water measured at the end of the 3 months in the 3 groups studied. Weight was significantly lower in active groups (AC and SP) when compared to SE (5% less AC vs SE, and 10% less SP vs SE), whereas no significant differences were evidenced in height. The BMI and waist circumference decreased with activity level, being significant in the SP with respect to SE for BMI and with SE and AC groups for waist circumference. The

Table 1. Anthropometric Data of 11- to 13-Year-old Children (N=137) From 3 Different Schools
| Sedentary group (n=45) | Active group (n=31) | Sports group (n=61) | P value | |
| Weight, kg | 51.5 (6.7) | 48.6 (6.2) a | 46.3 (7) a | .001 |
| Height, cm | 157 (7) | 156 (5.6) | 158 (7.8) | 0.471 |
| BMI, kg/m2 | 22.8 (12.1) | 19.9 (2.2) | 18.5 (6.3) a | .037 |
| Waist circumference, cm | 73.2 (6) | 71.2 (5.7) | 68.5 (6.2) a,b | .001 |

| 78.9 (22.1) | 67.3 (18.9) a | 54.2 (22.6) a,b | <.001 |
| FFM, % | 77.4 (4.7) | 79.2 (6.7) | 82.2 (4.7) | .128 |
| Body fat, % | 22.7 (4.6) | 19.8 (4.5) | 17.5 (5.5) a | .030 |
| FMI, kg/m2 | 4.74 (0.40) | 3.95 (0.34) a | 3.25 (0.40) a,b | <.001 |
| H2O, % | 57 (4.7) | 59.8 (6.7) | 62.9 (7.1) a | .012 |
BMI, body mass index; FFM, fat free mass; FMI, fat mass index.
a Represents significant differences when compared with sedentary children, (P<.05).
b Represents significant differences when compared with active children (P<.05).Different anthropometric measures in 3 groups of children according to physical activity adjusted for sex, age, school type, school grade, and socioeconomic status from both parents. Data are expressed as mean (standard deviation).
Table 2 summarizes the biochemical parameters related to health and cardiovascular risk factors. Total cholesterol and its fractions (HDL-C and LDL-C), the atherogenic index, and glucose concentration did not show significant differences..
Table 2. Biochemical Parameters Related With Health and Cardiovascular Risk Factors of 11- to 13-Year-old Children (N=137) From 3 Different Schools
| Sedentary group (n=45) | Active group (n=31) | Sports group (n=61) | P value | |
| Total cholesterol, mg/dL | 167 (21) | 173 (17) | 172 (31) | .380 |
| HDL, mg/dL | 61 (9.4) | 63.3 (9.5) | 65.5 (13.3) | .191 |
| LDL, mg/dL | 92.3 (14.8) | 96.6 (13.9) | 94.9 (21.1) | .241 |
| Atherogenic Index | 2.86 (0.54) | 2.78 (0.34) | 2.72 (0.47) | .653 |
| Triglycerides, mg/dL | 69.6 (18.2) | 65.2 (17.1) | 58.7 (17.2) a | .010 |
| Glucose, mg/dL | 86.8 (8.1) | 86.4 (4.4) | 85.8 (6.2) | .390 |
| Insulin, μUI/mL | 15.5 (9.5) | 11.4 (2.8) a | 9.1 (3.1) a,b | <.001 |
| HOMA-IR | 3.5 (2.7) | 2.4 (0.5) a | 1.9 (0.8) a,b | <.001 |
HDL, high-density lipoproteins; LDL, low-density lipoproteins; HOMA-IR: homeostatic model assessment of insulin resistance.
a Represents significant differences when compared with sedentary children, (P<.05).
b Represents significant differences when compared with active children (P<.05).Biochemical parameters studied in 3 groups of children according to physical activity adjusted for sex, age, school type, school grade and socioeconomic status from both parents. Data are expressed as mean (standard deviation).
For triglycerides, the parameter most related to diet, the SP presented 15% lower values than the SE..
In relation to insulin, a significant decrease was observed in both active groups with respect to SE (26% in AC and 41% in SP). These data are related to the HOMA index, which decreased 31% in AC and 45% in SP..
Physical activity parameters and blood pressure data are presented in Table 3. Maximal oxygen uptake (VO2max) and maximum heart rate in Course-Navette test were increased in the AC and SP groups. The SBP presented similar values in the SE and AC group, but it was lower in the SP than in the SE and AC groups. No significant differences were evidenced in DBP..
Table 3. Cardiorespiratory Fitness and Blood Pressure Data of 11- to 13-Year-old Children (N=137) From 3 Different Schools
| Sedentary group (n=45) | Active group (n=31) | Sports group (n=61) | P value | |
| VO2max, mL/kg/min | 31.4 (4.1) | 34.9 (3.4) a | 42.7 (4.8) a,b | <.001 |
| HRmax in Course-Navette, bpm | 194 (28) | 201 (7) a | 202 (9) a | .043 |
| Systolic blood pressure, mmHg | 114 (15) | 113 (7) | 108 (17) a,b | .031 |
| Diastolic blood pressure, mmHg | 65.1 (7.4) | 66.3 (7.4) | 63.2 (7.1) | .667 |
HRmax, maximum heart rate; VO2max, maximal oxygen uptake.
a Represents significant differences when compared with sedentary children, (P<.05).
b Represents significant differences when compared with active children (P<.05).Cardiorespiratory fitness and blood pressure data in 3 groups of children according to physical activity adjusted for sex, age, school type, school grade and socioeconomic status from both parents. Data are expressed as mean (standard deviation).
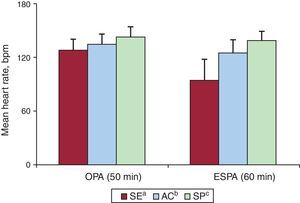
Figure presents the mean heart rate during physical activity in the 3 studied groups during at-school and extracurricular activity. When the heart rate during both programmed mandatory physical activity and extracurricular physical activity were considered, a significant increase occurred in AC and SP groups. Sedentary children presented low heart rate during extracurricular physical activity compared with the obligatory physical activity at the school..

Figure. Mean heart rate in 11- to 13-year-old children (N=137) from 3 different schools during physical activity: obligatory physical activity (50min) and during extra school physical activity (60min) in the 3 groups studied (sedentary group, active group, sports group). Data are expressed as mean (standard deviation). AC, active group; bpm, beats per minute; ESPA, extra school physical activity; OPA, obligatory physical activity; SE, sedentary group; SP, sports group. aRepresents significant differences between obligatory physical activity and extra school physical activity. bRepresents significant differences when compared with sedentary children, (P<.05). cRepresents significant differences when compared with active children (P<.05).
Table 4 shows the prevalence of overweight and obesity and the relationship between cardiovascular risk factors and the levels of physical activity. Higher physical activity was associated with a significantly lower prevalence of high waist circumference, FMI, and HOMA-IR (homeostatic model assessment of insulin resistance). Although there is a lower prevalence of high SBP, overweight, and obesity related to exercise, the P trend was not statistically significant. No association between, triglycerides, glucose, HDL-C and DBP was evidenced..
Table 4. Prevalence of Overweight and Obesity and Cardiovascular Risk Factors Related to Physical Activity of 11- to 13-Year-old Children (N=137) From 3 Different Schools
| Sedentary group (n=45) | Active group (n=31) | Sports group (n=61) | P for trend | |
| Prevalence of overweight, % | 21.2 | 20.4 | 9.8 | .291 |
| Prevalence of obesity, % | 11.5 | 7.4 | 2.4 | .254 |
| Cardiovascular risk criteria | ||||
| Overweight (including obesity; BMI, >25 kg/m2 for age and sex) | 1 | 0.82 (0.31-2.15) | 0.32 (0.10-1.11) | .173 |
| Waist circumference (>75th percentile for age and sex) | 1 | 0.96 (0.65-2.23) | 0.39 (0.15-1.02) | .042 |
| FMI (boys, >4.58 kg/m2; girls, >7.76 kg/m2) | 1 | 0.49 (0.18-1.06) | 0.28 (0.10-0.83) | .037 |
| Fasting glucose levels (>110 mg/dL) | 1 | 0.98 (0.77-1.37) | 0.97 (0.75-1.43) | .998 |
| Triglycerides (>110 mg/dL) | 1 | 0.99 (0.57-1.76) | 0.96 (0.49-1.68) | .958 |
| HDL (< 40 mg/dL) | 1 | 0.97 (0.57-3.37) | 0.49 (0.03-2.14) | .793 |
| HOMA-IR (>2.5) | 1 | 0.74 (0.29-1.86) | 0.07 (0.02-0.25) | .001 |
| SBP (>90th percentile for age, sex and height) | 1 | 0.97 (0.38-2.30) | 0.29 (0.08-1.04) | .114 |
| DBP (>90th percentile for age, sex and height) | 1 | 0.54 (0.27-3.08) | 0.56 (0.30-3.60) | .564 |
BMI, body mass index; DBP, diastolic blood pressure; FMI, fat mass index; HDL: high-density lipoproteins; HOMA-IR: homeostatic model assessment of insulin resistance; SBP, systolic blood pressure.
The prevalence of overweight and obesity and the multivariate logistic regression were adjusted for sex, age, school type, school grade and socioeconomic status from both parents. Figures in parentheses show 95% confidence intervals. Multiple logistic regression models with polynomial contrast were used to generate P for trend.
The role of the family and the environment in physical activity level is well described,26 as well as demographic and contextual factors such as socioenvironmental and physical-environmental, among others.27 The sociodemographic characteristics of the selected schools were similar (autonomous community of Castille and León, Spain), as well as the opportunities for extracurricular physical activity and sports. To minimize the influence of nutrition, this study only included students who consumed standard daily school menus, supervised by Concierge of Health..
There are strong evidences that physical activity is beneficial to health, reducing cardiovascular risk factors and cardiovascular disease and improving body composition. Previous studies reported that school interventions are able to improve cardiovascular risk factors and to reduce obesity in children.28, 29, 30 The present results evidenced that the physical activity performed by sedentary and active children does not reach a healthy heart rate. Moderate physical activity is considered when it is comprised between 3 METs and 6 METs (> 6 is strong) or upon reaching 50% to 60% of theoretical maximum heart rate (which in the present study would be around 125bpm). Only the SP significantly accumulated minutes of moderate physical activity.31 It has been well established that increasing the number of hours practicing physical activity, especially moderate-intense physical activity, results in health benefits (lower risk factors, less fat, better lipid profile, and more VO2 or more fitness).31, 32 The low levels of VO2max achieved by SE and AC groups are below the cutoff value for the VO2max considered minimally healthy for European and American children. Moreover, it was reported that the children performing less physical activity had problems to reach the theoretical maximum heart rate (220–age) as an indicator of the effort they can perform. Athletes are the only ones guaranteed to have a VO2max above the cutoff and, consequently, to have better health. In fact, a higher VO2max at this age is directly related to better physical condition in adulthood.22, 32 Athletes also have a significantly lower resting heart rate, typical of their best physical condition, which guarantees a better heart rate reserve for effort, reducing the possibility of cardiovascular stress associated with exercise..
Regarding body composition, BMI values were significantly lower in the SP. The BMI values of athletes averaged 18, which was similar to the 80s and 90s (before the obesity epidemic and fast food in Spain). Although the BMI values of the SE (BMI=22) were not indicative of overweight, this was associated with higher fat percentages, lower physical condition, and worse cardiovascular risk factors (blood pressure, lipid profile, HOMA). The SE also presented higher levels of central and peripheral adiposity, which is directly related to disease risk, chronic cardiovascular disease, diabetes, and obesity in adults.18, 33 The FMI values decreased progressively with physical activity. It was recently reported that FMI had higher accuracy for overweight screening than BMI.21 The FMI is a useful measure to evaluate body composition parameters by effectively eliminating differences in body fat associated with height.34.
The percentage of body water content and fat-free mass were significantly greater in accordance with the highest number of hours of physical activity, whereas the fat mass decreased. Because fat mass accumulates almost no water, its reduction results in a higher percentage of body water. Our results are similar to previous studies that examined the relationship between physical activity, overweight and obesity, and increased energy expenditure and movement.35, 36 Increased muscle mass implies more muscle to perform higher energy expenditure during and after exercise (increased resting energy expenditure), which was associated with lower adiposity and improved VO2max, physical condition, and strength. Five risk factors are involved in the genesis of the metabolic syndrome: abdominal adiposity, triglycerides, HDL/LDL, blood pressure, and sedentary behavior (h/min of at least moderate physical activity). In Spanish adolescents, significant associations have been reported between cardiorespiratory fitness and plasma lipid profile (cholesterol and triglycerides), inflammatory state, abdominal adiposity, body fat, insulin resistance, metabolic syndrome, and hypertension.37, 38, 39 Each increase of 1 MET increases life expectancy 12% in men and 17% in women. The low VO2max is associated with insulin resistance40 whereas values between 37.0 and 42.1mL/kg/min in children are considered a low metabolic risk. In the present study only the SP presented values of VO2max in the safety range. Nowadays, the sedentary lifestyle is advancing tobacco as the main cause of preventable death.41 Increased cardiovascular fitness in childhood is essential for adherence to regular physical activity in adulthood.42.
The practice of high physical activity resulted in lower values of SBP and DBP, which would reduce the probability to suffer from hypertension.33 It has been suggested that the hypertension and an altered lipid profile (low HDL/high LDL) are associated with early atherogenesis in the intimae of the arteries of children.33 Many reports have shown that the increase of physical activity practice and its intensity is associated with a better lipid profile.33, 37 However, the present data did not reflect significant differences in cholesterol and lipoproteins, although the SP tended to have higher HDL and lower LDL and significantly lower triglycerides..
These results evidenced that, although sedentary and active children presented indicators of obesity and blood glucose in the normal range, they presented increased insulin concentration. Furthermore, the homeostatic indicator HOMA-IR, an indicator of insulin resistance directly related with overweight and obesity and diabetes, was significantly increased in the less active children. Tresaco et al. have established a cut-off value of HOMA in children (HOMA of 3.0 or 3.2) with which early development of metabolic syndrome is related.43 The SE showed a HOMA value of 3.5, whereas the AC with double the hours of physical activity presents values of 2.4. The SP significantly presented reduced HOMA values, to 1.8, which are far from any metabolic risk factor associated with insulin resistance. It is important to emphasize that in both adults and children hyperinsulinemia is present years before the change occurs in insulin secretion. Therefore, the American Heart Association recommends the determination of fasting insulin and glucose to assess the risk of insulin resistance in children, especially in girls with early menarche, due to the tendency to overweight and, consequently, increased cardiovascular risk.44 In addition, different prospective studies have established a clear correlation between hyperinsulinemia and elevated HOMA index and increased risk of hypertension and diabetes in adults.45, 46 In accordance with previous studies, our results show a strong relationship between insulin resistance and factors involved in the risk of developing a metabolic syndrome..
As mentioned, the metabolic syndrome in children can be diagnosed with abdominal obesity and the presence of 2 or more clinical features. However, regarding lipid profile, the results did not report differences in the total cholesterol or atherogenic index values, mainly because their presence would indicate a developed pathology. However, more active status produced low concentration of triglycerides. This fact is important since it is directly associated with insulin resistance and it may be an easily measured value and a predictor of risk. This association is attributed to the action of the insulin on the lipoprotein metabolism. The resistance to insulin decreases the activity of lipoprotein lipase, causing a reduction in triglyceride metabolism, together with increased lipolysis in adipose tissue and increased synthesis of very low density lipoproteins in the liver.47.
Physical inactivity, a recognized determinant of health, is the result of a progressive shift of lifestyle towards more sedentary patterns in developed countries. The present results reported an association between the practice of physical activity with a reduction of cardiovascular factors – waist circumference, FMI, SBP and HOMA-IR, indicating the importance of exercise in children to prevent overweight and obesity. These results are in accordance with other studies that reported increased odds ratio of metabolic syndrome in association with inactivity.24, 48.
ConclusionsThe present results show that children with higher levels of physical activity presented better anthropometric and biochemical profiles related with cardiovascular risk, indicating that physical activity is important for metabolic health in children. increasing physical activity outside of school may be an effective mechanism for increasing physical activity and improving cardiovascular health factors and body composition in children..
Conflicts of interestNone declared..
Received 11 July 2011
Accepted 27 January 2012
Corresponding author: Departamento de Bioquímica, Biología Molecular y Fisiología, E.U. Fisioterapia, Universidad de Valladolid, Campus Universitario Duques de Soria s/n, 42004 Soria, Spain. a.cordova@bio.uva.es