The childhood obesity epidemic is a worldwide public health problem which starts at very early ages. The aim of this study was to determine the persistence of and variation in overweight and obesity among a cohort of children followed up from 4 to 6 years of age.
MethodsThe data were drawn from the ELOIN (Longitudinal Childhood Obesity Study), a population-based cohort in the Community of Madrid, Spain. A total of 2435 children were involved. Weight and height were objectively measured and standardised at 4 (2012-2013) and 6 years of age (2014-2015) by 31 purpose-trained pediatricians. Three reference criteria were used: the World Health Organization (WHO-2006), International Obesity Task Force (IOTF-2000), and Spanish tables of the Orbegozo Foundation 2004, were used to define “absence of excess weight”, overweight and obesity.
ResultsAccording to the above three classification criteria, between the ages of 4 and 6 years the prevalence of overweight increased from 5.7%-16.5% (range of the 3 criteria) to 8.9%-17.0%, and obesity increased from 3.0%-5.4% to 6.1%-10.1%. Three out of every 4 obese children at age 4 years persisted with obesity at age 6 years, whereas 20.6%-29.3% who were overweight became obese. A total of 8.0% to 16.1% of children maintained “excess weight” (overweight/obesity), 7.9% to 11% were new cases, and 2.2% to 5.9% showed remission.
ConclusionsExcess weight increased between the ages of 4 and 6 years. Important variations were observed in weight status susceptible to intervention during well-child visits.
Keywords
Childhood obesity has become a priority worldwide public health problem in developed and developing countries.1 According to the World Health Organization (WHO), in the first decade of the 21st century around 20% of European children and adolescents were overweight and one-third were obese.2 Spain and other Mediterranean countries, such as Italy and Cyprus, were among the European countries with the highest prevalence.3
Recent international studies show that the prevalence of overweight/obesity may have stabilized in recent years.4 Based on published data provided by the Spanish National Health Survey, the magnitude of “excess weight“(overweight/obesity) in children in Spain between 2001 and 2010 remained constant.5 Other sources, such as the ALADINO study (Food, Physical Activity, Child Development, and Obesity), which was conducted nationwide in 2011 in a population of 6- to 9-year-old children using objective measurements weight and height, showed high prevalences of overweight (26.2%) and obesity (18.3%).6 The study was repeated in 2015. Its estimates showed a slightly lower prevalence of overweight (23.2%), although there was little change in the prevalence of obesity (18.1%).7
Obesity in adults is associated with severe noncommunicable diseases, such as diabetes, cardiovascular disease, and various types of cancer, as well as premature mortality.8,9 Childhood obesity, although a relatively silent condition, leads to numerous comorbidities in childhood,10 but its relevance lies in its persistence in adolescence and adult life.11 It is estimated that around 55% of obese children and 70% of obese adolescents will experience adult obesity,12 which increases their risk of having greater premature morbidity and mortality.13
With the exception of the studies by Begolusa,14 Fiuano-Italia,15 and IDEFICS (Identification and prevention of Dietary- and lifestyle-induced health EFfects in Children and infantS,16 most cohort studies have been conducted in Anglo-Saxon or northern European countries.17,18 There is little information available from Mediterranean regions, where the prevalence of obesity is higher.1 In Spain, information is available from 2 longitudinal local studies: one was conducted in school children aged from 9 to 12 years in the city of Cuenca with 6 years of follow-up19; the other was conducted in the provinces of Cuenca and Ciudad Real in children aged from 4 to 6 years with 2 years of follow-up.20
In 2012, the Longitudinal Childhood Obesity Study (ELOIN) was launched in the Community of Madrid. The baseline cohort comprised children aged 4 years who will be followed up until the age of 14 years. The study aim is to estimate variations in excess weight, its association with risk factors, and its effects on health. The ELOIN study uses a representative sample from the region, and is being conducted by professionals from the Primary Care Physicians Sentinel Network. In addition to objective anthropometric characteristics, the study is: investigating the main factors known to be associated with excess weight, such as diet, breastfeeding, physical activity, sleep, and sedentary lifestyle; assessing cardiometabolic risk using blood samples at 9 years and 14 years; and estimating the effects on health status, quality of life, and health demand.
The objective of this study was to determine the variation of weight status, particularly changes in overweight and obesity, in a cohort of children from the Community of Madrid followed up from 4 to 6 years of age.
METHODSDesign and Study PopulationThe ELOIN study is a prospective population cohort study. Its design has already been described in the literature.21 The study started in 2012. The target population is children 4 years of age living in the Community of Madrid, and follow-up measurements are being recorded at ages 6, 9, 12, and 14 years.
Study participants were selected using 2-stage conglomerate sampling within the framework of the Primary Care Physicians Sentinel Network.22 To ensure proportional distribution by socioeconomic level, 14 strata were defined according to sociodemographic variables that characterized the health areas (first-stage units). Children served by the 31 sentinel pediatricians were then selected from the Community of Madrid health card database.
Inclusion criteria were being born between January 2008 and November 2009 and belonging to the quota of sentinel pediatricians. Children who reached the age of 4 years between 2012 and 2013 were included (baseline study). The first follow-up measurements were made between 2014 and 2015.
Information was collected in 2 consecutive stages: a) a physical examination in the health center; and b) a structured questionnaire administered via a computer-assisted telephone interview, which was answered by the person in charge of feeding the child.
The sample included children who participated in the baseline study and were included in the 2 years of follow-up.
A letter was sent to the families to explain the objectives of the study and to obtain their written informed consent. The protocol was approved by the Ethics Committee of the Ramón y Cajal Hospital in Madrid.
MeasuresAnthropometric MeasurementsFully trained pediatricians took standardized measurements of weight and height.21 Weight was measured using a digital scale (SECA model 220, precision, 0.1kg) and height was measured using a telescopic stadiometer (SECA model 220, precision, 1mm). Two measurements were taken of each participant, and the mean of the measurements was used.
Body mass index (BMI) was calculated using the mean values of weight and height with the formula: weight (in kilograms)/height2 (in meters).
Reference Criteria to Classify the Weight Status of ChildrenObesity and overweight in adults are defined by a BMI ≥ 30 and a BMI ≥ 2529.9, respectively. However, in children, the age- and sex-specific BMI is compared with typical values using growth charts and reference cutoff points. Due to the use of different international and national criteria, this approach makes it more difficult to quantify and compare estimates.23 This study used the WHO growth charts for 2006, the cutoff points of the International Obesity Task Force (IOTF) for 2000, and the Spanish charts of the Fundación Orbegozo (OF) for 2004. Based on the children's weight and height, the weight categories of the BMI were calculated by sex and age in months. Using the WHO24 criteria, the BMI z-scores were calculated according to child growth standards for those aged 60 months or younger and between 5 and 19 years of age. Participants were classified into 4 categories by BMI z-score: obese (> +2 standard deviations [SD]); overweight (> +1 and ≤ +2 SD); normal weight (BMI z-score ≥ -2 and ≤ +1 SD); and low weight (< -2 SD). The extended international (IOTF) BMI cutoffs proposed by Cole et al.25,26 were used to classify children aged from 2 to 18 years, with the interpolated bi-yearly values. Finally, the OF27 Spanish growth charts with the interpolated monthly values were used to classify: obesity, percentile ≥ 97; overweight, percentile ≥ 85 and < 97; normal weight, percentiles > 3 and < 85; and low weight, percentile ≤ 3.
Because the number of children classified as underweight was very small (< 3% of the population), children with normal weight were classified in a new category called “without excess weight”.
Data AnalysisThe prevalence rates and statistical significance of weight status, classified as “without excess weight”, overweight, and obesity between 4 and 6 years of age, were calculated using generalized estimating equation models with the binomial distribution.28 We assessed the stability of the weight status classified as “without excess weight”, overweight, and obesity between 4 and 6 years of age, and agreement was estimated using the quadratic weighted kappa test. To represent the population distributions of BMI at 4 and 6 years, we calculated density functions using Kernel estimates (Epanechnikov function).29 To assess general changes between 4 and 6 years, overweight and obesity were grouped into an “excess weight” category, and persistence was estimated in the “without excess weight” and “excess weight” categories, incidence in the “excess weight” category, and remission in the “without excess weight” category.
The data were analyzed using the Stata v14.1 software package.
RESULTSThe baseline study included 3186 4-year-old children. At 2 years of follow-up, the number of children had decreased to 2435 (76.4%). The main reasons for nonparticipation were lack of time or motivation by the parents (32%), a change of pediatrician (16%), and transfer to another autonomous community or country of origin (9.4%).
In total, 50.7% of the children were boys and the mean ± SD of age at 4 and 6 years were 48.6 ± 1.7 and 73.6 ± 3.3 months, respectively.
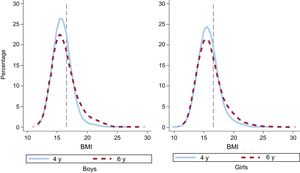
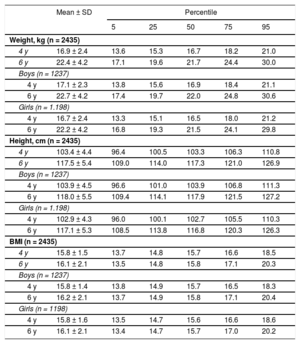
Table 1 shows the averages of weight, height, and BMI by sex and age. Mean weight and height increased in the 2 years of follow-up (P < .001), and the estimated average BMI at 4 and 6 years was 15.8 ± 1.5 and 16.1 ± 2.1 (P < .001), respectively. In both sexes, the average values of these parameters were very similar. At 4 and 6 years, the BMI values in the 5th, 25th, and 50th percentiles were similar; however, from the 75th percentile onward, the BMI values in both sexes at 6 years were higher and progressively moved away from each other in the right tail of the distribution (Table 1 and Figure).
Distribution of Weight, Height, and BMI at 4 and 6 Years. ELOIN Study. Community of Madrid, 2012 to 2015
| Mean ± SD | Percentile | |||||
|---|---|---|---|---|---|---|
| 5 | 25 | 50 | 75 | 95 | ||
| Weight, kg (n = 2435) | ||||||
| 4 y | 16.9 ± 2.4 | 13.6 | 15.3 | 16.7 | 18.2 | 21.0 |
| 6 y | 22.4 ± 4.2 | 17.1 | 19.6 | 21.7 | 24.4 | 30.0 |
| Boys (n = 1237) | ||||||
| 4 y | 17.1 ± 2.3 | 13.8 | 15.6 | 16.9 | 18.4 | 21.1 |
| 6 y | 22.7 ± 4.2 | 17.4 | 19.7 | 22.0 | 24.8 | 30.6 |
| Girls (n = 1.198) | ||||||
| 4 y | 16.7 ± 2.4 | 13.3 | 15.1 | 16.5 | 18.0 | 21.2 |
| 6 y | 22.2 ± 4.2 | 16.8 | 19.3 | 21.5 | 24.1 | 29.8 |
| Height, cm (n = 2435) | ||||||
| 4 y | 103.4 ± 4.4 | 96.4 | 100.5 | 103.3 | 106.3 | 110.8 |
| 6 y | 117.5 ± 5.4 | 109.0 | 114.0 | 117.3 | 121.0 | 126.9 |
| Boys (n = 1237) | ||||||
| 4 y | 103.9 ± 4.5 | 96.6 | 101.0 | 103.9 | 106.8 | 111.3 |
| 6 y | 118.0 ± 5.5 | 109.4 | 114.1 | 117.9 | 121.5 | 127.2 |
| Girls (n = 1.198) | ||||||
| 4 y | 102.9 ± 4.3 | 96.0 | 100.1 | 102.7 | 105.5 | 110.3 |
| 6 y | 117.1 ± 5.3 | 108.5 | 113.8 | 116.8 | 120.3 | 126.3 |
| BMI (n = 2435) | ||||||
| 4 y | 15.8 ± 1.5 | 13.7 | 14.8 | 15.7 | 16.6 | 18.5 |
| 6 y | 16.1 ± 2.1 | 13.5 | 14.8 | 15.8 | 17.1 | 20.3 |
| Boys (n = 1237) | ||||||
| 4 y | 15.8 ± 1.4 | 13.8 | 14.9 | 15.7 | 16.5 | 18.3 |
| 6 y | 16.2 ± 2.1 | 13.7 | 14.9 | 15.8 | 17.1 | 20.4 |
| Girls (n = 1198) | ||||||
| 4 y | 15.8 ± 1.6 | 13.5 | 14.7 | 15.6 | 16.6 | 18.6 |
| 6 y | 16.1 ± 2.1 | 13.4 | 14.7 | 15.7 | 17.0 | 20.2 |
BMI, body mass index; SD, standard deviation.

There was a significant increase in the prevalence of obesity (Table 2) according to the 3 reference criteria: WHO (from 5.4% to 10.1%), IOTF (from 3.0% to 6.1%), and OF (from 4.5% to 7.1%). There was a significant increase in overweight according to the IOTF and OF criteria (from 8.6% to 13.8%, and from 5.7% to 8.9%, respectively), but not according to the WHO criteria. There was a greater increase in obesity in boys than in girls.
Distribution of Weight Status at 4 and 6 Years According to WHO, IOTF, and OF Classifications. ELOIN Study. Community of Madrid, 2012 to 2015
| WHO | IOTF | OF | |||||||||||||
|---|---|---|---|---|---|---|---|---|---|---|---|---|---|---|---|
| 4 y | 6 y | 4 y | 6 y | 4 y | 6 y | ||||||||||
| % | (95%CI) | % | (95%CI) | PR | % | (95%CI) | % | (95%CI) | PR | % | (95%CI) | % | (95%CI) | PR | |
| Total (n = 2435) | |||||||||||||||
| Without excess weight | 78.0 | (76.3-79.6) | 72.9 | (71.1-74.6) | 0.934a | 88.3 | (86.9-89.6) | 80.1 | (78.8-81.7) | 0.907a | 89.8 | (88.5-90.9) | 84.0 | (82.5-85.4) | 0.948a |
| Overweight | 16.5 | (15.1-18.0) | 17.0 | (15.8-19.1) | 1.029 | 8.6 | (7.6-9.8) | 13.8 | (12.4-15.1) | 1.590a | 5.7 | (4.9-5.4) | 8.9 | (7.8-10.1) | 1.519a |
| Obesity | 5.4 | (4.6-6.4) | 10.1 | (8.9-11.4) | 1.849a | 3.0 | (2.4-3.8) | 6.1 | (5.2-7.1) | 2.013a | 4.5 | (3.7-5.4) | 7.1 | (6.2-8.2) | 1.827a |
| Boys (n = 1,237) | |||||||||||||||
| Without excess weight | 77.7 | (75.4-80.0) | 70.2 | (67.6-72.7) | 0.902a | 90.6 | (88.9-92.1) | 80.5 | (78.2-82.6) | 0.888a | 92.2 | (90.6-93.6) | 84.8 | (82.7-86.8) | 0.924a |
| Overweight | 16.8 | (14.8-19.1) | 17.9 | (15.9-20.2) | 1.067 | 7.0 | (5.7-8.5) | 13.0 | (11.3-15.0) | 1.872a | 4.4 | (3.3-5.6) | 7.8 | (6.5-9.5) | 1.828a |
| Obesity | 5.4 | (4.3-6.8) | 11.9 | (10.2-13.8) | 2.194a | 2.4 | (1.7-3.5) | 6.5 | (5.2-7.9) | 2.666a | 3.4 | (2.5-4.5) | 7.3 | (5.9-8.9) | 2.160a |
| Girls (n = 1198) | |||||||||||||||
| Without excess weight | 78.3 | (75.9-80.5) | 75.7 | (73.2-78.1) | 0.966b | 85.9 | (83.9-87.8) | 79.8 | (77.4-81.9) | 0.928a | 87.2 | (85.2-89.0) | 83.1 | (80.8-85.1) | 0.973a |
| Overweight | 16.2 | (14.2-18.4) | 16.0 | (14.1-18.2) | 0.989 | 10.3 | (8.7-12.2) | 14.4 | (12.6-16.6) | 1.395a | 7.2 | (5.8-8.8) | 9.9 | (8.4-11.8) | 1.261 |
| Obesity | 5.5 | (4.3-6.9) | 8.3 | (6.8-9.9) | 1.500a | 3.7 | (2.7-4.9) | 5.7 | (4.6-7.2) | 1.568a | 5.6 | (4.4-7.0) | 7.0 | (5.7-8.6) | 1.441a |
95%CI, 95% confidence interval; OF, Orbegozo Foundation; IOTF, International Obesity Task Force; PR, prevalence rate; WHO, World Health Organization.
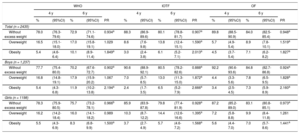
Table 3 shows that approximately 75% of obese children at 4 years remained obese at 6 years, and around 20% returned to overweight. Greater changes were observed in overweight, in that about 1 in 4 children progressed to obesity (WHO, 20.6%, IOTF, 28.1%, OF-2004, 29.3%), others remained overweight (WHO, 44.5%, IOTF, 51.4%, OF-2004, 38.6%), and the rest returned to “without excess weight”. The kappa coefficients showed moderate to good agreement under the 3 criteria. Agreement between the criteria was greater in girls than in boys, and statistically significant P values were obtained when the kappa coefficients were compared under the WHO, IOTF, and OF criteria.
Persistence of Obesity and Overweight From 4 to 6 Years of Age According to WHO, IOTF, and OF Classifications. ELOIN Study. Community of Madrid, 2012 to 2015
| Weight status at 4 y | Weight status at 6 y | Weighted Kappa (95%CI) | |||||
|---|---|---|---|---|---|---|---|
| Obesity | Overweight | Without excess weight | |||||
| no. | % | no. | % | no. | % | ||
| Both sexes (n = 2435) | |||||||
| WHO | 0.613 (0.575-0.651) | ||||||
| Obesity (n = 133) | 103 | 77.4 | 27 | 20.3 | 3 | 2.3 | |
| Overweight (n = 402) | 83 | 20.6 | 179 | 44.5 | 140 | 34.8 | |
| Without excess weight (n = 1900) | 60 | 3.2 | 208 | 10.9 | 1632 | 85.9 | |
| IOTF | 0.562 (0.515-0.609) | ||||||
| Obesity (n = 74) | 57 | 77.0 | 14 | 19.0 | 3 | 4.0 | |
| Overweight (n = 210) | 59 | 28.1 | 108 | 51.4 | 43 | 20.5 | |
| Without excess weight (n = 2151) | 33 | 1.5 | 212 | 9.9 | 1906 | 88.6 | |
| OF | 0.628 (0.580-0.676) | ||||||
| Obesity (n = 109) | 80 | 73.4 | 21 | 19.3 | 8 | 7.3 | |
| Overweight (n = 140) | 41 | 29.3 | 54 | 38.6 | 45 | 32.1 | |
| Without excess weight (n = 2186) | 53 | 2.4 | 141 | 6.5 | 1992 | 91.1 | |
| Boys (n = 1237) | |||||||
| WHO | 0.536 (0.481-0.592) | ||||||
| Obesity (n = 67) | 52 | 77.6 | 12 | 17.9 | 3 | 4.5 | |
| Overweight (n = 208) | 48 | 23.0 | 83 | 40.0 | 77 | 37.0 | |
| Without excess weight (n = 962) | 47 | 52.0 | 127 | 13.2 | 788 | 81.9 | |
| IOTF | 0.537 (0.469-0.605) | ||||||
| Obesity (n = 30) | 23 | 76.6 | 5 | 16.7 | 2 | 6.7 | |
| Overweight (n = 86) | 33 | 38.4 | 34 | 39.5 | 19 | 22.1 | |
| Without excess weight (n = 1121) | 24 | 2.1 | 122 | 10.9 | 975 | 87.0 | |
| OF | 0.551 (0.473-0.630) | ||||||
| Obesity (n = 42) | 34 | 81.0 | 4 | 9.5 | 4 | 9.5 | |
| Overweight (n = 54) | 18 | 33.3 | 21 | 38.9 | 15 | 27.8 | |
| Without excess weight (n = 1141) | 38 | 3.3 | 72 | 6.3 | 1031 | 90.4 | |
| Girls (n = 1198) | |||||||
| WHO | 0.704 (0.659-0.751) | ||||||
| Obesity (n = 66) | 51 | 77.3 | 15 | 22.7 | 0 | 0.0 | |
| Overweight (n = 194) | 35 | 18.0 | 96 | 49.5 | 63 | 32.5 | |
| Without excess weight (n = 938) | 13 | 1.4 | 81 | 8.6 | 844 | 90.0 | |
| IOTF | 0.704 (0.652-0.757) | ||||||
| Obesity (n = 44) | 34 | 77.3 | 9 | 20.4 | 1 | 2.3 | |
| Overweight (n = 124) | 26 | 20.9 | 74 | 59.7 | 24 | 19.4 | |
| Without excess weight (n = 1030) | 9 | 0.9 | 90 | 8.7 | 931 | 90.4 | |
| OF | 0.694 (0.638-0.751) | ||||||
| Obesity (n = 67) | 46 | 68.7 | 17 | 25.4 | 4 | 6.0 | |
| Overweight (n = 86) | 23 | 26.7 | 33 | 38.3 | 30 | 34.9 | |
| Without excess weight (n = 1045) | 15 | 1.4 | 69 | 6.6 | 961 | 92.0 | |
95%CI, 95% confidence interval; IOTF, International Obesity Task Force; OF, Orbegozo Foundation; WHO, World Health Organization.
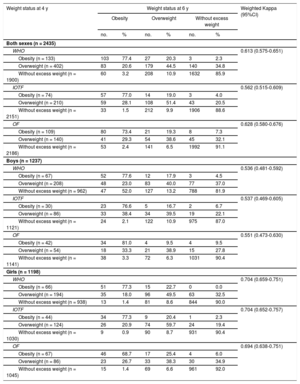
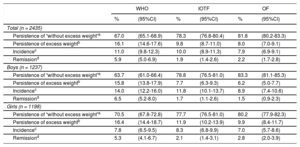
Regarding variations in weight status (Table 4), at 6 years more than 80% of the children remained in the category of “excess weight” or “without excess weight”. Incidental cases of excess weight varied from 7.9% (OF) to 11.0% (WHO), and the percentage of those who returned to “without excess weight” varied between 1.9% (IOTF) and 5.9% (WHO).
Variation in Weight Status From 4 to 6 Years of Age According to the WHO, IOTF, and OF Classifications. ELOIN Study. Community of Madrid, 2012 to 2015
| WHO | IOTF | OF | ||||
|---|---|---|---|---|---|---|
| % | (95%CI) | % | (95%CI) | % | (95%CI) | |
| Total (n = 2435) | ||||||
| Persistence of “without excess weight”a | 67.0 | (65.1-68.9) | 78.3 | (76.8-80.4) | 81.8 | (80.2-83.3) |
| Persistence of excess weightb | 16.1 | (14.6-17.6) | 9.8 | (8.7-11.0) | 8.0 | (7.0-9.1) |
| Incidencec | 11.0 | (9.8-12.3) | 10.0 | (8.9-11.3) | 7.9 | (6.9-9.1) |
| Remissiond | 5.9 | (5.0-6.9) | 1.9 | (1.4-2.6) | 2.2 | (1.7-2.8) |
| Boys (n = 1237) | ||||||
| Persistence of “without excess weight”a | 63.7 | (61.0-66.4) | 78.8 | (76.5-81.0) | 83.3 | (81.1-85.3) |
| Persistence of excess weightb | 15.8 | (13.8-17.9) | 7.7 | (6.3-9.3) | 6.2 | (5.0-7.7) |
| Incidencec | 14.0 | (12.2-16.0) | 11.8 | (10.1-13.7) | 8.9 | (7.4-10.6) |
| Remissiond | 6.5 | (5.2-8.0) | 1.7 | (1.1-2.6) | 1.5 | (0.9-2.3) |
| Girls (n = 1198) | ||||||
| Persistence of “without excess weight”a | 70.5 | (67.8-72.8) | 77.7 | (76.5-81.0) | 80.2 | (77.9-82.3) |
| Persistence of excess weightb | 16.4 | (14.4-18.7) | 11.9 | (10.2-13.9) | 9.9 | (8.4-11.7) |
| Incidencec | 7.8 | (6.5-9.5) | 8.3 | (6.8-9.9) | 7.0 | (5.7-8.6) |
| Remissiond | 5.3 | (4.1-6.7) | 2.1 | (1.4-3.1) | 2.8 | (2.0-3.9) |
95%CI, 95% confidence interval; IOTF, International Obesity Task Force; OF, Orbegozo Foundation; WHO, World Health Organization.
The main results of this population-based longitudinal study show a significant increase in the prevalence of overweight and obesity between 4 and 6 years of age: according to the WHO and IOTF criteria, the prevalence rate doubled. This increase was due to the prevalence rate of obesity remaining stable (3 out of 4 obese children at 4 years remained obese at 6 years) and overweight progressing to obesity (about 1 in every 4 overweight children).
Other Spanish studies6,30,31 have found higher prevalences of “excess weight” in the child population. Although these differences in prevalence are related to disparities in social determinants and lifestyles, they can also be due to methodological differences related to the selected age groups, study period, definition of obesity, or other criteria that hamper comparisons.32 The Spanish National Health Survey of 201133 estimated that the prevalence of “excess weight” at 2 to 5 years of age was 29.8% (27.8% of boys and 31.9% of girls). The ALADINO study6 also found a higher prevalence of overweight in the 6-year-old population. According to the classifications used, the prevalence of overweight ranged between 11.1% and 24.5%, and that of obesity ranged between 10.4% and 15.0%. Based on data from the Child and Adolescent Care Program, in the Region of Murcia,34 prevalences of overweight and obesity were 19.6% and 13.7%, respectively, at 6 years according to the IOTF criteria. In Castile-La Mancha in 2013,35 the prevalence of overweight and obesity in the 4- to 6-year-old population was 12% and 8.2%, respectively, according to the IOTF criteria. These percentages are similar to those of the present study. These lower prevalence rates, which were observed in the central area of Spain, are consistent with national estimates that place the Community of Madrid and Castile-La Mancha among the regions with the lowest prevalence rates.36
These longitudinal estimates showed a constant increase in “excess weight” from 4 to 6 years under all the criteria used. However, there was no significant increase in the prevalence of overweight between 4 and 6 years according to the WHO criteria. This result was due to the BMI cutoff points used to define overweight at 4 years being lower than those used under the other criteria; thus, the prevalences of overweight at 4 years were higher and the relative changes from 4 to 6 years were lower.
Spain and 7 other countries participated in the European longitudinal IDEFICS study,16 which was conducted with children younger than 10 years. This study found prevalences similar to those of the present study; according to the IOTF criteria, the prevalences of excess weight in boys and girls were 11% and 13% at 4 years, respectively, increasing to 19% and 21% at 6 years.
The results were also in line with those of other studies, which found a risk of overweight and obesity at a very young age, with a higher probability of being overweight in childhood and adolescence in those in whom an excess of weight began early.17,18,37,38 Similar results were found in an Italian longitudinal study with 3- to 8-year-old children and a follow-up of 2 years15: 83% of children with”excess weight“remained in this category, and the incidence of new cases (8.4%) was almost double that of those who returned to a normal weight (5%). In the Castile-La Mancha study,20 similar results were observed: In total, 3 out of 4 obese children remained in this category, whereas 10% of overweight children became obese. This percentage was lower than that found in the present study (28%). These present findings are relevant in terms of public health, because the highest risk of becoming obese at 6 years was found in those who were overweight at 4 years (according to the density curves, those who had a percentile > 75). As this population systematically comes into contact with the health system for pediatric check ups, this would be an obvious opportunity to implement intervention strategies.
It should be borne in mind that the step from overweight to obesity in these children is probably related to the appearance of the”fat rebound“between 4 and 6 years, which would explain part of the increase in prevalence. Although the”fat rebound” period includes the ages of 5 to 6 years, which is a critical period for the development of obesity in childhood and adolescence, many children will return to a normal weight status at later ages.39 Hence, it is important to monitor the evolution of BMI at these ages and to assess whether the “fat rebound” is related to the appearance of excess weight in adolescence and adult life.
The ELOIN study is the first population-based longitudinal study conducted in Spain to describe weight status in pre-school children using objective standardized measurements. It includes children from different socioeconomic backgrounds and territorial scopes and origins. It was developed within the framework of the Primary Care Physicians Sentinel Network of the Regional Health Service of the Community of Madrid.
LimitationsA limitation of the study is the short follow-up period of 2 years. However, pre-school children undergo substantial physiological changes in growth at this age, and their study can provide new knowledge to inform public health policies for the prevention of obesity. The previously mentioned study21 was limited by the representativeness of the sample: children from families with a low educational attainment and those from families with foreign parents with language difficulties had a low level of representation, whereas children with mothers with a high educational attainment were overrepresented. This aspect could have led to the underestimation of prevalences in this study because “excess weight” has a negative sociodemographic slope (higher prevalence in lower socioeconomic groups). Therefore, this should be taken into consideration when making comparisons with other studies.
In addition, BMI, which was used classify weight categories, can erroneously classify some children, especially those situated at the low “without excess weight” level or those with BMI values close to the cutoff values of the weight categories.40
CONCLUSIONSThe prevalences of overweight and obesity significantly increased between 4 and 6 years of age, and the prevalence rate of obese children doubled according to the WHO and IOTF criteria. Although the absolute change was moderate, given that the prevalence of excess weight at 4 years was relatively low, this increase was mainly due to the persistence of obesity and the progression from overweight to obesity.
Even if the “fat rebound” is a transient situation that can affect variations in overweight and obesity, the higher risk of overweight children becoming obese, as well as the increase in the BMI of obese children, should lead to the development of public health strategies involving high-risk intervention and primary prevention aimed at the preschool population. Based on the 9 years of follow-up of the ELOIN study, it will be of interest to assess the effect and relevance of the “fat rebound” in the evolution of weight status.
FUNDINGThe study was partially funded by a research grant from the Community of Madrid (No. RS_AP10-13).
CONFLICTS OF INTERESTNone declared.
- -
There is a high prevalence of childhood overweight and obesity, which begins at an early age. Their persistence during childhood, adolescence, and adult life is of relevance given their association with severe health problems. Although their control is one of the most important public health challenges, early preventative and treatment interventions show little effect.
- -
This study provides longitudinal data on the evolution of weight status in a representative population sample of children followed up from 4 to 6 years of age. There was a significant increase in the prevalence of overweight and, in particular, obesity, their persistence remained high, and their variations over the follow-up period characterize them as a childhood health phenomenon that must be monitored and controlled. The results suggest the need to develop intervention strategies in the pre-school population.
.
We would like to thank the participating families, the Primary Care Physicians Sentinel Network, and the companies Demométrica and Sondaxe for conducting the family interviews.