Childhood obesity continues to be one of the most important public health problems, in both developed countries and in middle- and low-income ones. In the last few years, several institutions and organizations have provided interesting data related to monitoring this phenomenon. The World Health Organization (WHO) has devoted considerable effort in this line since the end of the 1990s, particularly in Europe, with launching of the Childhood Obesity Surveillance Initiative (COSI)1 to monitor the problem. The document published by the Organization for Economic Cooperation and Development (OECD) in 2010 analyzed the global panorama in detail, emphasizing the economic burden of overweight and the need for active efforts to tackle it.2 In the last few years, projects based on collaborative initiatives, such as the NCD Risk Factor Collaboration (NCD-RisC) with participation of the WHO,3 and the Global Burden of Disease (GBD)4 led by the University of Washington in Seattle, have investigated obesity by systematically compiling and analyzing data from 5 continents, which has enabled estimates and analyses of trends based on observations in millions of individuals.
In the profile for Spain in the 2015 GBD report from the Institute for Health Metrics and Evaluation on the disease burden attributable to the 17 main risk factors, expressed as the percentage of disability adjusted life years (DALY), the risk related to diet and high body mass index (BMI) values is positioned in second and fourth place, respectively.
Although Spain has been making efforts to control this emerging problem through several initiatives from the central administration, autonomous communities, and private sources, the problem currently persists, with slight variations manifesting according to age, sex, geographic location, education attainment, and the socioeconomic charactistics of the family and surroundings.
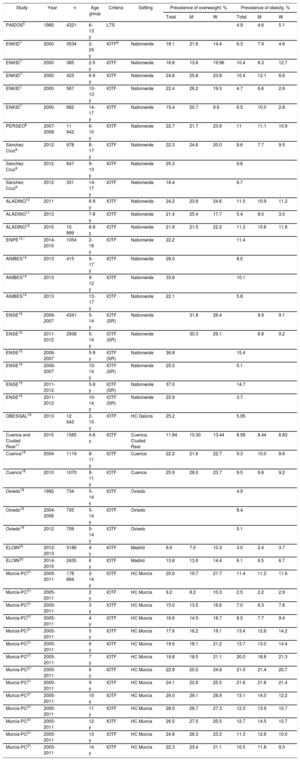
The PAIDOS study, directed by Bueno in 1984,5 with the participation of a number of pediatricians located throughout Spain, provided the first data on the prevalence of childhood obesity in our country. To have a panoramic vision of the situation and its chronology, the Table describes the main epidemiologic studies in this line carried out in Spain, which have largely served as the basis for initiating institutional interventions and surveillance of the problem. The prevalence estimates for overweight and obesity are presented according to the IOTF-2000 (International Obesity Task Force)6 criteria whenever possible.
Prevalence of Overweight and Obesity in Children and Adolescents in Spain According to Several Studies
| Study | Year | n | Age group | Criteria | Setting | Prevalence of overweight, % | Prevalence of obesity, % | ||||
|---|---|---|---|---|---|---|---|---|---|---|---|
| Total | M | W | Total | M | W | ||||||
| PAIDOS5 | 1985 | 4321 | 6-13 y | LTS | 4.9 | 4.6 | 5.1 | ||||
| ENKID7 | 2000 | 3534 | 2-24 y | IOTF6 | Nationwide | 18.1 | 21.6 | 14.4 | 6.3 | 7.9 | 4.6 |
| ENKID7 | 2000 | 385 | 2-5 y | IOTF | Nationwide | 16.8 | 13.6 | 19.96 | 10.4 | 8.3 | 12.7 |
| ENKID7 | 2000 | 423 | 6-9 y | IOTF | Nationwide | 24.8 | 25.8 | 23.8 | 10.4 | 12.1 | 8.6 |
| ENKID7 | 2000 | 567 | 10-13 y | IOTF | Nationwide | 22.4 | 26.2 | 19.3 | 4.7 | 6.6 | 2.6 |
| ENKID7 | 2000 | 682 | 14-17 y | IOTF | Nationwide | 15.4 | 20.7 | 9.9 | 6.5 | 10.0 | 2.8 |
| PERSEO8 | 2007-2008 | 11 642 | 6-10 y | IOTF | Nationwide | 22.7 | 21.7 | 23.9 | 11 | 11.1 | 10.9 |
| Sánchez Cruz9 | 2012 | 978 | 8-17 y | IOTF | Nationwide | 22.3 | 24.6 | 20.0 | 8.6 | 7.7 | 9.5 |
| Sánchez Cruz9 | 2012 | 647 | 8-13 y | IOTF | Nationwide | 25.3 | 9.6 | ||||
| Sánchez Cruz9 | 2012 | 331 | 14-17 y | IOTF | Nationwide | 16.4 | 6.7 | ||||
| ALADINO10 | 2011 | 6-9 y | IOTF | Nationwide | 24.2 | 23.8 | 24.6 | 11.0 | 10.9 | 11.2 | |
| ALADINO11 | 2013 | 7-8 y | IOTF | Nationwide | 21.4 | 25.4 | 17.7 | 5.4 | 8.0 | 3.0 | |
| ALADINO12 | 2015 | 10 899 | 6-9 y | IOTF | Nationwide | 21.8 | 21.5 | 22.2 | 11.2 | 10.6 | 11.8 |
| ENPE13,* | 2014-2015 | 1054 | 2-18 y | IOTF | Nationwide | 22.2 | 11.4 | ||||
| ANIBES14 | 2013 | 415 | 9-17 y | IOTF | Nationwide | 28.0 | 8.0 | ||||
| ANIBES14 | 2013 | 9-12 y | IOTF | Nationwide | 33.8 | 10.1 | |||||
| ANIBES14 | 2013 | 13-17 y | IOTF | Nationwide | 22.1 | 5.8 | |||||
| ENSE15 | 2006-2007 | 4341 | 5-14 y | IOTF (SR) | Nationwide | 31.8 | 28.4 | 9.9 | 9.1 | ||
| ENSE15 | 2011-2012 | 2938 | 5-14 y | IOTF (SR) | Nationwide | 30.3 | 29.1 | 8.8 | 9.2 | ||
| ENSE15 | 2006-2007 | 5-9 y | IOTF (SR) | Nationwide | 36.8 | 15.4 | |||||
| ENSE15 | 2006-2007 | 10-14 y | IOTF (SR) | Nationwide | 25.0 | 5.1 | |||||
| ENSE15 | 2011-2012 | 5-9 y | IOTF (SR) | Nationwide | 37.0 | 14.7 | |||||
| ENSE15 | 2011-2012 | 10-14 y | IOTF (SR) | Nationwide | 22.9 | 3.7 | |||||
| OBESGAL16 | 2013 | 12 643 | 2-15 y | IOTF | HC Galicia | 25.2 | 5.95 | ||||
| Cuenca and Ciudad Real17 | 2015 | 1585 | 4-6 y | IOTF | Cuenca, Ciudad Real | 11.84 | 10.30 | 13.44 | 8.58 | 8.44 | 8.83 |
| Cuenca18 | 2004 | 1119 | 8-11 y | IOTF | Cuenca | 22.2 | 21.6 | 22.7 | 9.3 | 10.0 | 8.6 |
| Cuenca18 | 2010 | 1070 | 8-11 y | IOTF | Cuenca | 25.9 | 28.0 | 23.7 | 9.5 | 9.8 | 9.2 |
| Oviedo19 | 1992 | 734 | 5-14 y | IOTF | Oviedo | 4.9 | |||||
| Oviedo19 | 2004-2006 | 735 | 5-14 y | IOTF | Oviedo | 8.4 | |||||
| Oviedo19 | 2012 | 709 | 5-14 y | IOTF | Oviedo | 5.1 | |||||
| ELOIN20 | 2012-2013 | 3186 | 4 y | IOTF | Madrid | 8.6 | 7.0 | 10.3 | 3.0 | 2.4 | 3.7 |
| ELOIN20 | 2014-2015 | 2435 | 6 y | IOTF | Madrid | 13.8 | 13.0 | 14.4 | 6.1 | 6.5 | 6.7 |
| Murcia-PC21 | 2005-2011 | 178 894 | 2-14 y | IOTF | HC Murcia | 20.6 | 19.7 | 21.7 | 11.4 | 11.2 | 11.6 |
| Murcia-PC21 | 2005-2011 | 2 y | IOTF | HC Murcia | 9.2 | 8.2 | 10.3 | 2.5 | 2.2 | 2.9 | |
| Murcia-PC21 | 2005-2011 | 3 y | IOTF | HC Murcia | 15.0 | 13.5 | 16.6 | 7.0 | 6.3 | 7.8 | |
| Murcia-PC21 | 2005-2011 | 4 y | IOTF | HC Murcia | 16.6 | 14.5 | 18.7 | 8.5 | 7.7 | 9.4 | |
| Murcia-PC21 | 2005-2011 | 5 y | IOTF | HC Murcia | 17.6 | 16.2 | 19.1 | 13.4 | 12.6 | 14.2 | |
| Murcia-PC21 | 2005-2011 | 6 y | IOTF | HC Murcia | 19.6 | 18.1 | 21.2 | 13.7 | 13.0 | 14.4 | |
| Murcia-PC21 | 2005-2011 | 7 y | IOTF | HC Murcia | 19.8 | 18.5 | 21.1 | 20.0 | 18.8 | 21.3 | |
| Murcia-PC21 | 2005-2011 | 8 y | IOTF | HC Murcia | 22.8 | 20.5 | 24.8 | 21.0 | 21.4 | 20.7 | |
| Murcia-PC21 | 2005-2011 | 9 y | IOTF | HC Murcia | 24.1 | 22.6 | 25.5 | 21.6 | 21.8 | 21.4 | |
| Murcia-PC21 | 2005-2011 | 10 y | IOTF | HC Murcia | 29.0 | 29.1 | 28.9 | 13.1 | 14.0 | 12.2 | |
| Murcia-PC21 | 2005-2011 | 11 y | IOTF | HC Murcia | 28.0 | 28.7 | 27.3 | 12.3 | 13.9 | 10.7 | |
| Murcia-PC21 | 2005-2011 | 12 y | IOTF | HC Murcia | 26.5 | 27.5 | 25.5 | 12.7 | 14.5 | 10.7 | |
| Murcia-PC21 | 2005-2011 | 13 y | IOTF | HC Murcia | 24.8 | 26.3 | 23.3 | 11.3 | 12.6 | 10.0 | |
| Murcia-PC21 | 2005-2011 | 14 y | IOTF | HC Murcia | 22.3 | 23.4 | 21.1 | 10.5 | 11.8 | 9.3 | |
HC, health center; IOTF, International Obesity Task Force; IOTF (SR), IOTF criteria, self-reported; LTS, left triceps skinfold; M, men; PC, primary care; W, women
Provisional data from the ENPE study, unpublished, collected according to the protocol and sampling described in the publication on obesity in the adult population (Aranceta-Bartrina et al.13).
The enKid7 study provided data on individual weight and height measurements in a probabilistic country-wide sample of the population aged 2 to 24 years. The results obtained in the evaluation study of the PERSEO8 project in the geographical reference setting (2008-2010) pointed to an increase in the magnitude of the problem in some autonomous communities, whereas in others with higher prevalence rates, the situation held steady. In their country-wide study published in 2012 focusing on the 8- to 17-year-old age group, Sánchez Cruz et al. concluded that, with respect to the estimates in the enKid study, the prevalence of obesity seems to have stabilized, although at high levels.9
Closer in time, the ALADINO studies from 2011,10 2013,11 and 2015,12 promoted by the Spanish Agency for Consumer Affairs, Food Safety, and Nutrition (AECOSAN, Agencia Española de Consumo, Seguridad Alimentaria y Nutrición) in the framework of the COSI initiative, represent an important contribution in surveillance and follow-up of the problem. These studies used a protocol and method shared with other countries and take as the starting point schoolchildren aged 6 to 9 years. The data confirm that the prevalence of childhood obesity in Spain is among the highest in Europe. Nonetheless, more recent findings indicate a slight decrease in overweight in this age group, in keeping with the estimates for children in the ENPE study.13
Analyses based on the weight and height data recorded in the Spanish National Health Survey (ENSE, Encuesta Nacional de Salud en España)15 and the Health Behavior in School-aged Children study (HBSC),1,12 conducted in 44 European countries (among others) in adolescents 11 to 15 years of age, also reflect a trend to stability. In this context, de Ruiter et al.22 draw attention to the prevalence of children with low weight, in particular small children, aged 2 to 5 years.
In recent years, initiatives have been implemented to analyze and follow-up excess weight in several autonomous regions in Spain,16,19,21 using data compiled within the program of care and check-ups for healthy children. Other regional studies, such as that in Cuenca,18 have provided valuable follow-up information corroborating the same trend.
Therefore, according to the available data on the magnitude, distribution, and trends related to childhood obesity in Spain, we can say that the problem is tending to stabilize. However, this assertion cannot be a generalized. In some cases, such as in the first 2 years of life and during the preschool age, the data are too limited to assess trends. In other groups, such as school-age children and adolescents, the problem is different, mainly depending on sex and the socioeconomic conditions.
The ELOIN study cohort in the Community of Madrid, with a 2-year follow-up, has shown an increase in the magnitude of excess weight in children aged 4 to 6 years.20 This study, conducted by Ortiz-Marrón et al. and recently published in Revista Española de Cardiología, provides an overview of the current prevalence of obesity in Spain, and valuable contributions on the factors that should be addressed in the coming years.
The ELOIN cohort is an initiative of considerable interest, as it provides population-based information compiled in an effective manner about a segment we need to know better. It would be interesting to continue building on the experience provided by ELOIN to gain information from other autonomous regions and expand the population data. One potential limitation of this type of strategy is ensuring the quality of the information collected from widely dispersed sites. A robust, unified protocol is needed, with continuous training of the professionals involved in data collection in each of the observation points, throughout the study. In addition, the measurement instruments should be checked and calibrated. Furthermore, as the authors of the study pointed out, the less well-favored groups are often under-represented because it is more difficult for them to accept to participate. Design strategies such as that proposed in ELOIN also offer opportunities to improve this weak point in the future.
Preventive activity is the key to controlling a disease that is difficult to resolve once established. Childhood obesity can be associated with greater morbidity in the affected person, which can lead to a considerable economic burden, loss of quality of life, fewer life opportunities, and potentially, a premature death.23
Based on the current scientific evidence, the fight against obesity requires a socially-based institutional plan that involves institutions and the community as a whole. The strategy should start with educational activity directed toward young women of childbearing age and their partners before they have children. This phase is key to enhancing responsible parenthood with measures to ensure that both parents will have good nutritional status and will eliminate substances and practices that pose a health risk.
The phases of pregnancy and lactation require special protection and dietary advice. Social support measures should facilitate shared, responsible care of the future new citizen.
The educational framework has a large responsibility related to programming teaching on food and nutrition within the school curriculum and in extracurricular activities, such as cooking and tasting workshops, shopping cart practices, and critical evaluation of vending machine products. One issue that is still pending concerns the role of school and university canteens. These are places that provide food in an institutional framework to a vulnerable population that often has no possibility to choose. One wonders why we have still not guaranteed a food source for the general school-age population that meets the requisites of safety, education, and health. The menu offer should be created, monitored, or supervised by registered dietitians-nutritionists. We are interested in the sequence of menus provided, but we are even more concerned about the quality and portions of the ingredients, the cooking techniques used, and the characteristics of the most problematic components, such as oil, bread, salt, and others. The food safety services also have an important collaborative task in all institutional catering establishments.
The other major variable related to the development of excess weight is the amount of physical activity. Our young people have one of the highest sedentary lifestyle rates in Europe. Schools should be the motor that promotes and stimulates the practice of physical activity. Schools should incorporate 1 hour daily of supervised activity within the framework of physical education, as well as complementary activities such as proactive recesses. School sports and recreational activities linked to the family should enable children to achieve an adequate level of physical activity throughout their entire growth and development stage.
In line with the strategies and action plans undertaken by the WHO and the European Union, the Spanish Ministry of Health, Social Services, and Equality through AECOSAN has launched the collaboration plan for improving the composition of food and beverages, and other related measures (2017-2020).24 The strategy of voluntary reductions in salt, sugar, and fats promoted by AECOSAN deserves special mention for its timeliness and good management. This initiative is in harmony with the PASFEC program, formerly promoted by the Spanish Heart Foundation, which, in recent years, has favored reformulation of many processed products to improve their nutritional profile. We also need to intensify cooperative control of commercial advertising aimed at the younger population, so that the food and beverages advertised in the social media, in all its formats, follow the same path of good informative praxis and a collaborative effort to promote health.
In our experience, the key points mentioned regarding food and physical activity require personalized treatment and a specific protocol for schoolchildren with special needs. Inclusive menus and mobility resources should be available for young people who are overweight or obese, and those with metabolic diseases, functional disability, and any other decline in their capabilities. If we have a plan and the group is a part of the solution, the support measures can advance with better results.
In summary, we can affirm that we are on the right track regarding some points, but nonetheless, childhood obesity and poor eating habits continue to require our attention and commitment at all levels. This is the only way to ensure that the current favorable trend will persist in the future.
CONFLICTS OF INTERESTNone declared.
.