European Society of Cardiology heart failure guidelines include a new patient category with mid-range (40%-49%) left ventricular ejection fraction (HFmrEF). HFmrEF patient characteristics and prognosis are poorly defined. The aim of this study was to analyze the HFmrEF category in a cohort of hospitalized heart failure patients (REDINSCOR II Registry).
MethodsA prospective observational study was conducted with 1420 patients classified according to ejection fraction as follows: HFrEF, < 40%; HFmrEF, 40%-49%; and HFpEF, ≥ 50%. Baseline patient characteristics were examined, and outcome measures were mortality and readmission for heart failure at 1-, 6-, and 12-month follow-up. Propensity score matching was used to compare the HFmrEF group with the other ejection fraction groups.
ResultsAmong the study participants, 583 (41%) had HFrEF, 227 (16%) HFmrEF, and 610 (43%) HFpEF. HFmrEF patients had a clinical profile similar to that of HFpEF patients in terms of age, blood pressure, and atrial fibrillation prevalence, but shared with HFrEF patients a higher proportion of male participants and ischemic etiology, and use of class I drugs targeting HFrEF. All other features were intermediate, and comorbidities were similar among the 3 groups. There were no significant differences in all-cause mortality, cause of death, or heart failure readmission. The similar outcomes were confirmed in the propensity score matched cohorts.
ConclusionsThe HFmrEF patient group has characteristics between the HFrEF and HFpEF groups, with more similarities to the HFpEF group. No between-group differences were observed in total mortality, cause of death, or heart failure readmission.
Keywords
Heart disease (HF) is frequently categorized according to left ventricular ejection fraction (LVEF). Heart failure patients show a wide range of LVEF values, from normal (≥ 50%), classically termed HF with preserved ejection fraction (HFpEF), to reduced LVEF (< 50%), called HF with with reduced ejection fraction (HFrEF).
Differentiation of HF according to ejection fraction is important both because of its prognostic value and because most clinical trials use this parameter for patient selection. The major trials targeting HFrEF have included patients with LVEF ≤ 35% to 40%, and so far therapeutic benefit has been limited to this group.1,2 However, trials targeting HFpEF have used varied cutoffs (LVEF > 40%, LVEF > 45%, and LVEF > 50%). For this reason, LVEF between 40% and 49% is considered a “gray area” in need of better characterization. In light of these concerns, the new European Society of Cardiology (ESC) guidelines have established a new category of HF patients with LVEF values between 40% and 49%, termed HF with mid-range ejection fraction (HFmrEF).1 The new guidelines highlight the need for new clinical research into the treatment of this particular patient group.
The Red de Investigación Cardiovascular del Instituto de Salud Carlos III (RIC) [Carlos III Institute of Health Cardiovascular Research Network] has built a database of patients hospitalized with acute HF (the REDINSCOR II registry), which includes clinical-epidemiological and prognostic data. The goal of our study was to analyze and compare the clinical, therapeutic, and prognostic characteristics of patients with HFpEF, HFmrEF, and HFrEF included in the REDINSCOR II registry.
METHODSStudy PopulationData were retrieved from a national multicenter, prospective registry (REDINSCOR II), which includes input from as many as 20 Spanish hospitals of varying complexity. Patients in the registry were older than 18 years and were hospitalized in the cardiology unit for at least 24hours; the main reason for admission was presentation of symptoms compatible with acute HF, both de novo and decompensated, and a chest X-ray indicating pulmonary congestion. The REDINSCOR II registry did not include any participants from the previous REDINSCOR study, which examined patients with chronic HF recruited during cardiology consultations.3
Exclusion criteria included ST-elevation acute coronary syndrome, end-stage disease with a life expectancy < 1 year, and any condition likely to preclude follow-up. HF was diagnosed by the patient's cardiologist in accordance with current HF guidelines.
The registry was compiled consecutively between October 2013 and December 2014 and included a total of 1831 patients admitted with acute HF. Patients were included in the analysis only if they had undergone an echocardiography exam to determine LVEF on admission (1084 patients) or in the preceding 6 months (336), resulting in a study population of 1420 patients (77.6% of the total).
The baseline characteristics of patients excluded due to lack of echocardiography-determined LVEF (411 patients; 22%) are shown in Table 1 of the Supplementary Material.
Follow-up consisted of vital-status and events assessment by telephone interview at 3 months, 6 months, and 1 year after inclusion in the registry. There was minimal loss of follow-up (30 patients; 1.6%), and patients lost to follow-up were not included in the statistical analysis. The study was approved by the ethics committees at the participating hospitals, and all patients gave written informed consent.
Participants were assigned to 1 of 3 groups according to LVEF: HF with reduced EF (HFrEF) for LVEF < 40%; HFmrEF for LVEF between 40% and 49%; and HF with preserved EF (HFpEF) for LVEF ≥ 50%.
The objective of this study was to analyze the REDINSCOR II registry for the clinical, therapeutic, and prognostic characteristics of patients with HFmrEF and compare them with the 2 classic HF categories (HFrEF and HFpEF).
Statistical AnalysisQuantitive variables are expressed as mean ± standard deviation (SD) and qualitative variables are expressed as frequency (percentage). Qualitative variables were compared using the chi-square test or the Fisher exact test, and quantitative variables were compared by ANOVA or the Student t test.
Propensity-score matching was used to balance groups and minimize the bias arising from an observational study of the effect of LVEF category. Propensity-score matching balances the baseline group characteristics for a set of defined variables, allowing analysis of the effect of an intervention or factor. Here, we used 1:1 nearest-neighbor matching without replacement, with a caliper width of 0.2 standard deviations in the propensity score. Between-group balance was assessed by comparing the means of continuous and binary variables using “standardized difference”,4 which is not influenced by sample size and allows comparison of relative balance between variables with different units. In our case, we expected standardized differences < 0.2.
Propensity scores were matched using the MatchIt statistical package in R. The following independent variables were evaluated: age, sex, HF history, diabetes mellitus, hypertension, chronic obstructive pulmonary disease, obstructive sleep apnea hypopnea syndrome, stroke, peripheral vascular disease, cardiac frequency, systolic blood pressure, ischemic etiology, hemoglobin, glomerular filtration rate (CKD-EPI),5 N-terminal pro-brain natriuretic peptide > 1500 ng/L, Charlson age-comorbidity index,6 Barthel frailty index,7 Pfeiffer cognitive impairment test,8 and pharmacological treatment (angiotensin-converting enzyme inhibitors, angiotensin receptor blockers, beta-blockers, and aldosterone antagonists). This analysis generated 2 matched groups: 212 patients with LVEF 40% to 49% matched against 212 with LVEF <40%, and 208 patients with LVEF 40% to 49% matched against 208 with LVEF ≥ 50%.
Kaplan-Meier survival plots were first generated for the full cohort, with comparison by the log-rank test. Survival was then analyzed in the matched cohorts. A Cox regression model was constructed for all-cause death, with LVEF group as the explanatory variable (%). The incidence of readmission for HF was analyzed by drawing the accumulated incidence curves, and between-group differences were analyzed by Gray's test9; the risk effect was determined using a regression model devised by Fine and Gray for competing risks.10,11
The proportional hazard assumption was evaluated by the Shoenfeld residuals test.
Missing data were imputed using the MICE package in R (Multivariate Imputation by Chained Equations). Only 1 imputation was carried out because the percentage of missing data was < 5%. The only exception was plasma N-terminal pro-brain natriuretic peptide, which was classified into 3 categories: < 1500 ng/L, ≥ 1500 ng/L, and “data unavailable” if there were missing data. This was done because the occurrence of missing data for this variable could be related to the event.
Data were analyzed with the statistical packages SPSS 22 and R 3.2. Differences were considered statistically significant at P < .05.
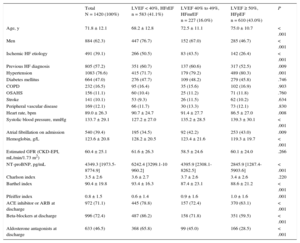
RESULTSBaseline Characteristics of the Study PopulationBaseline characteristics on admission of the 1420 patients in the study population are summarized in Table 1.
Baseline Characteristics on Admission and Treatment at Discharge Among Heart Failure Patients Grouped According to Left Ventricular Ejection Fraction
| Total N = 1420 (100%) | LVEF < 40%, HFrEF n = 583 (41.1%) | LVEF 40% to 49%, HFmrEF n = 227 (16.0%) | LVEF ≥ 50%, HFpEF n = 610 (43.0%) | P | |
|---|---|---|---|---|---|
| Age, y | 71.8 ± 12.1 | 68.2 ± 12.8 | 72.5 ± 11.1 | 75.0 ± 10.7 | < .001 |
| Men | 884 (62.3) | 447 (76.7) | 152 (67.0) | 285 (46.7) | < .001 |
| Ischemic HF etiology | 491 (39.1) | 266 (50.5) | 83 (43.5) | 142 (26.4) | < .001 |
| Previous HF diagnosis | 805 (57.2) | 351 (60.7) | 137 (60.6) | 317 (52.5) | .009 |
| Hypertension | 1083 (76.6) | 415 (71.7) | 179 (79.2) | 489 (80.3) | .001 |
| Diabetes mellitus | 664 (47.0) | 276 (47.7) | 109 (48.2) | 279 (45.8) | .746 |
| COPD | 232 (16.5) | 95 (16.4) | 35 (15.6) | 102 (16.9) | .903 |
| OSAHS | 156 (11.1) | 60 (10.4) | 25 (11.2) | 71 (11.8) | .760 |
| Stroke | 141 (10.1) | 53 (9.3) | 26 (11.5) | 62 (10.2) | .634 |
| Peripheral vascular disease | 169 (12.1) | 66 (11.7) | 30 (13.3) | 73 (12.1) | .830 |
| Heart rate, bpm | 89.0 ± 26.3 | 90.7 ± 24.7 | 91.4 ± 27.7 | 86.5 ± 27.0 | .008 |
| Systolic blood pressure, mmHg | 133.7 ± 29.1 | 127.2 ± 27.0 | 135.2 ± 28.5 | 139.3 ± 30.1 | < .001 |
| Atrial fibrillation on admission | 540 (39.4) | 195 (34.5) | 92 (42.2) | 253 (43.0) | .009 |
| Hemoglobin, g/L | 123.6 ± 20.8 | 128.2 ± 20.5 | 123.4 ± 21.6 | 119.3 ± 19.7 | < .001 |
| Estimated GFR (CKD-EPI, mL/min/1.73 m2) | 60.4 ± 25.1 | 61.6 ± 26.3 | 58.5 ± 24.6 | 60.1 ± 24.0 | .266 |
| NT-proBNP, pg/mL | 4349.3 [1973.5-8774.9] | 6242.4 [3299.1-10 960.2] | 4395.9 [2308.1-8262.5] | 2845.9 [1287.4-5903.6] | < .001 |
| Charlson index | 3.5 ± 2.6 | 3.6 ± 2.7 | 3.7 ± 2.6 | 3.4 ± 2.6 | .220 |
| Barthel index | 90.4 ± 19.8 | 93.4 ± 16.3 | 87.4 ± 23.1 | 88.6 ± 21.2 | < .001 |
| Pfeiffer index | 0.8 ± 1.5 | 0.6 ± 1.4 | 0.9 ± 1.6 | 1.0 ± 1.6 | .001 |
| ACE inhibitor or ARB at discharge | 972 (71.1) | 445 (78.8) | 157 (72.4) | 370 (63.1) | < .001 |
| Beta-blockers at discharge | 996 (72.4) | 487 (86.2) | 158 (71.8) | 351 (59.5) | < .001 |
| Aldosterone antagonists at discharge | 633 (46.5) | 368 (65.8) | 99 (45.0) | 166 (28.5) | < .001 |
ACE, angiotensin-converting enzyme; ARB, angiotensin receptor blockers; CKD-EPI, Chronic Kidney Disease Epidemiology Collaboration; COPD, chronic obstructive pulmonary disease; GFR, glomerular filtration rate; HF, heart failure; HFmrEF, heart failure with mid-range ejection fraction; HFpEF, heart failure with preserved ejection fraction; HFrEF, heart failure with reduced ejection fraction; LVEF, left ventricular ejection fraction; NT-proBNP, N-terminal pro-brain natriuretic peptide; OSAHS, obstructive sleep apnea hypopnea syndrome.
Continuous variables are shown as mean ± standard deviation or median [interquartile range] and categorical variables are shown as No. (%).
The mean age of the analyzed study population was 71.8 ± 12.1 years. Of these, 884 (62.3%) were men. The most frequent risk factor was hypertension, affecting 1083 patients (76.6%); 664 patients (47%) had diabetes. More than half the patients (805; 57.2%) had a previous HF diagnosis. The most frequent HF etiology was ischemic heart disease, affecting 491 patients (39.1%). There was also a high frequency of atrial fibrillation on admission, affecting 540 patients (39.4%).
Characteristics of Groups Classified According to Left Ventricular Ejection FractionAmong all included patients, 583 (41%) had LVEF <40% (HFrEF), 227 (16%) had LVEF 40% to 49% (HFmrEF), and 610 (43%) had LVEF ≥ 50% (HFpEF).
The 3 groups differed significantly in age, sex, hypertension history, and ischemic etiology, and in clinical variables on admission such as the presence of atrial fibrillation, hemoglobin, and N-terminal pro-brain natriuretic peptide. Overall, the HFmrEF group was more similar to the HFpER group in age, hypertension prevalence, and the presence of atrial fibrillation, whereas this group was more similar to the HFrEF group in the predominance of men and the high prevalance of ischemic etiology.
The 3 groups also differed significantly in their capacity for daily living activities measured on the Barthel scale and in their cognitive state measured on the Pfeiffer scale. On these measures, the HFmrEF group tended to more closely resemble the HFpEF group. However, the 3 groups showed no differences in the association between age and comorbidity measured by the Charlson index.
Pharmacological Treatment on DischargeThe 3 groups differed significantly in the main treatments prescribed at discharge (Table 1). The HFmrEF group had a high prescription rate for treatments considered class I treatments for HFrEF: more than 70% of HFmrEF patients were prescribed angiotensin-converting enzyme inhibitors (72.4%) or angiotensin receptor blockers and beta-blockers (71.8%), and almost half (45%) were prescribed aldosterone antagonists.
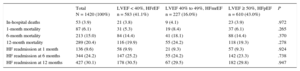
Follow-up EventsAmong the hospitalized HF patients included in the analysis, the number of in-hospital deaths was 53 (3.9%): 21 of these patients had HFrEF (3.9% mortality), 9 had HFmrEF (4.1% mortality), and 23 had HFpEF (3.9% mortality) (P = .972) (Table 2). In-hosptial mortality did not differ between the 3 groups (HFrEF vs HFpEF: odds ratio [OR], 0.96; 95% confidence interval [95%CI], 0.53-1.76; P = .896; HFmrEF vs HFpEF: OR, 1.06; 95%CI, 0.48-2.31; P = .891). At 1-month follow-up, the HFmrEF group showed a tendency toward higher mortality (5.3% mortality in HFrEF, 8.4% in HFrEF, and 6.1% in HFpEF); however, the difference was not statistically significant (P = .265) (HFrEF vs HFpEF: OR, 0.87; 95%CI, 0.53-1.42; P = .578; HfmrEF vs HFpEF: OR, 1.42; 95%CI, 0.80-2.52; P = .237).
Mortality and Readmission for Heart Failure During Follow-up of the Full Study Population
| Total N = 1420 (100%) | LVEF < 40%, HFrEF n = 583 (41.1%) | LVEF 40% to 49%, HFmrEF n = 227 (16.0%) | LVEF ≥ 50%, HFpEF n = 610 (43.0%) | P | |
|---|---|---|---|---|---|
| In-hospital deaths | 53 (3.9) | 21 (3.8) | 9 (4.1) | 23 (3.9) | .972 |
| 1-month mortality | 87 (6.1) | 31 (5.3) | 19 (8.4) | 37 (6.1) | .265 |
| 6-month mortality | 213 (15.0) | 84 (14.4) | 41 (18.1) | 88 (14.4) | .370 |
| 12-month mortality | 289 (20.4) | 116 (19.9) | 55 (24.2) | 118 (19.3) | .278 |
| HF readmission at 1 month | 136 (9.6) | 58 (9.9) | 21 (9.3) | 57 (9.3) | .924 |
| HF readmission at 6 months | 344 (24.2) | 147 (25.2) | 55 (24.2) | 142 (23.3) | .738 |
| HF readmission at 12 months | 427 (30.1) | 178 (30.5) | 67 (29.5) | 182 (29.8) | .947 |
HF, heart failure; HFmrEF, heart failure with mid-range ejection fraction; HFpEF, heart failure with preserved ejection fraction; HFrEF, heart failure with reduced ejection fraction; LVEF, left ventricular ejection fraction.
Data are expressed as No. (%).
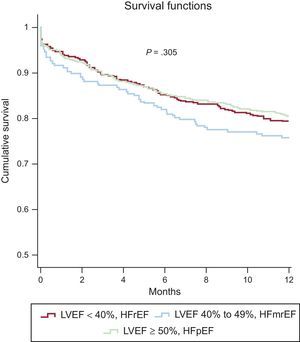
Similarly, there were no significant between-group differences in 6-month mortality (P = .37) (HFrEF vs HFpEF: OR, 1.00; 95%CI, 0.73-1.38; P = .993; HFmrEF vs HFpEF: OR, 1.31; 95%CI, 0.87-1.96; P = .196) or at 1 year (P = .278) (HFrEF vs HFpEF: OR, 1.04; 95%CI, 0.78-1.39; P = .810; HFmrEF vs HFpEF: OR, 1.33; 95%CI, 0.93-1.92; P = .122). Overall mortality was 15% at 6 months and 20.4% at 1 year. Kaplan-Meier survival curves at 1-year follow-up are shown for the 3 LVEF categories in Figure 1.

One-year Kaplan-Meier survival curves for the 3 left ventricular ejection fraction groups in the full study population. HFmrEF, heart failure with mid-range ejection fraction; HFpEF, heart failure with preserved ejection fraction; HFrEF, heart failure with reduced ejection fraction; LVEF, left ventricular ejection fraction.
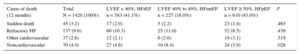
The HRrEF, HFmrEF, and HFpEF groups showed no significant differences in the distribution of cause of death. In all 3 groups, the most frequent cause of death was refractory HF, followed by death due to noncardiovascular causes (Table 3).
Cause of Death During 1-year Follow-up in the 3 LVEF Groups in the Full Study Population
| Cause of death (12 months) | Total N = 1420 (100%) | LVEF < 40%, HFrEF n = 583 (41.1%) | LVEF 40% to 49%, HFmrEF n = 227 (16.0%) | LVEF ≥ 50%, HFpEF n = 610 (43.0%) | P |
|---|---|---|---|---|---|
| Sudden death | 45 (3.2) | 17 (2.9) | 5 (2.2) | 23 (3.8) | .465 |
| Refractory HF | 137 (9.6) | 60 (10.3) | 25 (11.0) | 52 (8.5) | .439 |
| Other cardiovascular | 37 (2.6) | 12 (2.1) | 6 (2.6) | 19 (3.1) | .519 |
| Noncardiovascular | 70 (4.9) | 27 (4.6) | 19 (8.4) | 24 (3.9) | .028 |
HF, heart failure; HFmrEF, heart failure with mid-range ejection fraction; HFpEF, heart failure with preserved ejection fraction; HFrEF, heart failure with reduced ejection fraction; LVEF, left ventricular ejection fraction.
The overall readmission rate for HF was 9.6% at 1 month, 24.2% at 6 months, and 30.1% at 1 year (Table 2).
No significant differences were found between the 3 groups at any stage of follow-up.
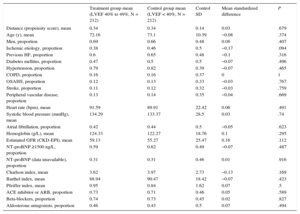
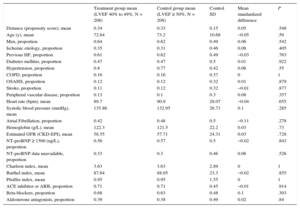
Adjustment for Propensity ScoreThe propensity score matching analysis produced 2 sets of matched patients: 212 patients with LVEF 40% to 49% vs 212 with LVEF < 40%, and 208 patients with LVEF 40% to 49% vs 208 with LVEF ≥ 50%. The balance of variable distribution between appropriately matched patients is shown in Table 4A and Table 4B.
Propensity Score-matched Baseline Characteristics in HRmrEF and HFrEF Patient Groups
| Treatment group mean (LVEF 40% to 49%, N = 212) | Control group mean (LVEF < 40%, N = 212) | Control SD | Mean standardized difference | P | |
|---|---|---|---|---|---|
| Distance (propensity score), mean | 0.34 | 0.34 | 0.14 | 0.03 | .679 |
| Age (y), mean | 72.16 | 73.1 | 10.39 | −0.08 | .374 |
| Men, proportion | 0.69 | 0.66 | 0.48 | 0.08 | .407 |
| Ischemic etiology, proportion | 0.38 | 0.46 | 0.5 | −0.17 | .094 |
| Previous HF, proportion | 0.6 | 0.65 | 0.48 | −0.1 | .316 |
| Diabetes mellitus, proportion | 0.47 | 0.5 | 0.5 | −0.07 | .496 |
| Hypertension, proportion | 0.79 | 0.82 | 0.39 | −0.07 | .465 |
| COPD, proportion | 0.16 | 0.16 | 0.37 | 0 | 1 |
| OSAHS, proportion | 0.12 | 0.13 | 0.33 | −0.03 | .767 |
| Stroke, proportion | 0.11 | 0.12 | 0.32 | −0.03 | .759 |
| Peripheral vascular disease, proportion | 0.13 | 0.14 | 0.35 | −0.04 | .669 |
| Heart rate (bpm), mean | 91.59 | 89.91 | 22.42 | 0.06 | .491 |
| Systolic blood pressure (mmHg), mean | 134.29 | 133.37 | 28.5 | 0.03 | .74 |
| Atrial fibrillation, proportion | 0.42 | 0.44 | 0.5 | −0.05 | .623 |
| Hemoglobin (g/L), mean | 124.33 | 122.27 | 18.76 | 0.1 | .295 |
| Estimated GFR (CKD-EPI), mean | 59.13 | 55.27 | 25.47 | 0.16 | .112 |
| NT-proBNP ≥1500 ng/L, proportion | 0.59 | 0.62 | 0.49 | −0.07 | .487 |
| NT-proBNP (data unavailable), proportion | 0.31 | 0.31 | 0.46 | 0.01 | .916 |
| Charlson index, mean | 3.62 | 3.97 | 2.73 | −0.13 | .169 |
| Barthel index, mean | 88.94 | 90.47 | 18.42 | −0.07 | .423 |
| Pfeiffer index, mean | 0.95 | 0.84 | 1.62 | 0.07 | .5 |
| ACE inhibitor or ARB, proportion | 0.73 | 0.71 | 0.46 | 0.05 | .589 |
| Beta-blockers, proportion | 0.74 | 0.73 | 0.45 | 0.02 | .827 |
| Aldosterone antagonists, proportion | 0.46 | 0.43 | 0.5 | 0.07 | .494 |
ACE, angiotensin-converting enzyme; ARB, angiotensin receptor blockers; CKD-EPI, Chronic Kidney Disease Epidemiology Collaboration; COPD, chronic obstructive pulmonary disease; GFR, glomerular filtration rate; HF, heart failure; HFpEF, heart failure with preserved ejection fraction; HFrEF, heart failure with reduced ejection fraction; LVEF, left ventricular ejection fraction; NT-proBNP, N-terminal pro-brain natriuretic peptide; OSAHS, obstructive sleep apnea hypopnea syndrome; SD, standard deviation.
Propensity Score-matched Baseline Characteristics in HRmrEF and HFpEF Patient Groups
| Treatment group mean (LVEF 40% to 49%, N = 208) | Control group mean (LVEF ≥ 50%, N = 208) | Control SD | Mean standardized difference | P | |
|---|---|---|---|---|---|
| Distance (propensity score), mean | 0.34 | 0.33 | 0.15 | 0.05 | .548 |
| Age (y), mean | 72.64 | 73.2 | 10.68 | −0.05 | .59 |
| Men, proportion | 0.64 | 0.62 | 0.49 | 0.06 | .542 |
| Ischemic etiology, proportion | 0.35 | 0.31 | 0.46 | 0.08 | .405 |
| Previous HF, proportion | 0.61 | 0.62 | 0.49 | −0.03 | .763 |
| Diabetes mellitus, proportion | 0.47 | 0.47 | 0.5 | 0.01 | .922 |
| Hypertension, proportion | 0.8 | 0.77 | 0.42 | 0.06 | .55 |
| COPD, proportion | 0.16 | 0.16 | 0.37 | 0 | 1 |
| OSAHS, proportion | 0.12 | 0.12 | 0.32 | 0.01 | .879 |
| Stroke, proportion | 0.11 | 0.12 | 0.32 | −0.01 | .877 |
| Peripheral vascular disease, proportion | 0.13 | 0.1 | 0.3 | 0.08 | .357 |
| Heart rate (bpm), mean | 89.7 | 90.9 | 28.07 | −0.04 | .655 |
| Systolic blood pressure (mmHg), mean | 135.86 | 132.95 | 26.71 | 0.1 | .285 |
| Atrial Fibrillation, proportion | 0.42 | 0.48 | 0.5 | −0.11 | .278 |
| Hemoglobin (g/L), mean | 122.3 | 121.5 | 22.2 | 0.03 | .73 |
| Estimated GFR (CKD-EPI), mean | 58.55 | 57.71 | 24.31 | 0.03 | .728 |
| NT-proBNP ≥ 1500 (ng/L), proportion | 0.56 | 0.57 | 0.5 | −0.02 | .843 |
| NT-proBNP data unavailable, proportion | 0.33 | 0.3 | 0.46 | 0.06 | .526 |
| Charlson index, mean | 3.63 | 3.63 | 2.89 | 0 | 1 |
| Barthel index, mean | 87.64 | 88.05 | 23.3 | −0.02 | .855 |
| Pfeiffer index, mean | 0.95 | 0.95 | 1.55 | 0 | 1 |
| ACE inhibitor or ARB, proportion | 0.71 | 0.71 | 0.45 | −0.01 | .914 |
| Beta-blockers, proportion | 0.68 | 0.63 | 0.48 | 0.1 | .303 |
| Aldosterone antagonists, proportion | 0.39 | 0.38 | 0.49 | 0.02 | .84 |
ACE, angiotensin-converting enzyme; ARB, angiotensin receptor blockers; CKD-EPI, Chronic Kidney Disease Epidemiology Collaboration; COPD, chronic obstructive pulmonary disease; GFR, glomerular filtration rate; HF, heart failure; HFpEF, heart failure with preserved ejection fraction; HFrEF, heart failure with reduced ejection fraction; LVEF, left ventricular ejection fraction; NT-proBNP, N-terminal pro-brain natriuretic peptide; OSAHS, obstructive sleep apnea hypopnea syndrome; SD, standard deviation.
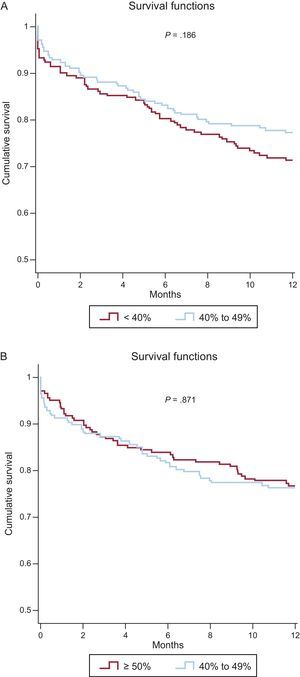
Twelve-month survival in the matched cohorts was analyzed by Cox regression, using LVEF group as the explanatory variable. This analysis identified no significant differences in all-cause mortality between the HFmrEF and HFrEF groups (hazard ratio [HR], 0.77; 95%CI, 0.53-1.13; P = .19) or between the HFmrEF and HFpEF groups (HR, .03; 95%CI, 0.69-1.54; P = .87). Kaplan-Meier 1-year survival curves for the matched cohorts are shown in Figures 2A and 2B.

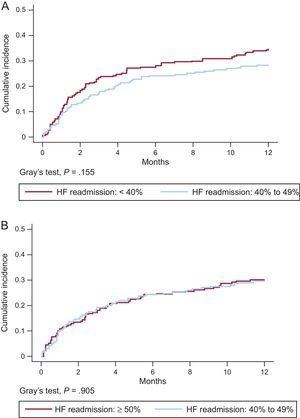
Matched groups similarly showed no significant differences in readmission for HF (Figures 3A and 3B) or in the distribution of cause of death (Table 2A and Table 2B of the Supplementary Material). However, the HFrEF group showed a tendency toward higher rates for readmission and death due to HF progression.
DISCUSSION
The most important findings of our study show that the new category of HFrEF patients identifies a population with clinical characteristics that fall between the the HFrEF and HFpEF groups, but does not distinguish a group with worse prognosis.
To our knowledge, this is the first description of the characteristics and prognosis of a patient cohort hospitalized with HFmrEF (LVEF 40% to 49%), a new category included in recent ESC guidelines for HF diagnosis and treatment.1 Patients diagnosed with HF show a continuum of LVEF values, which have classically been classified into 2 HF phenotypes (HFrEF and HFpEF) that differ in their clinical characteristics. The prevalence of these 2 HF patterns differs among published registries according to patient history.12–15 In the ESC-HF Long-Term Registry, the prevalence of HF with LVEF > 45% was 32.8% in hospitalized patients vs 23.1% in outpatients with chronic HF.12 In the American OPTIMIZE-HF registry of acute HF patients, the prevalence of HF with LVEF < 40% was 51.2%.13 In our registry, the prevalences of HFrEF, HFmrEF, and HfpEFwere 41%, 16%, and 43%, respectively. This corresponds to a prevalence of 59% for LVEF ≥ 40%, in line with OPTIMIZE-HF and other contemporary registries. It should be noted that the different cutoff thresholds used to define HF categories could limit comparisons between different registries.
Classically, the category of HF with reduced LVEF tends to include younger, predominantly male patients and has a high incidence of ischemic heart disease. In contrast, HFpEF series tend to have a predominance of older, female patients and a high prevalence of hypertension, diabetes mellitus, and atrial fibrillation.
A recent report from the TOPCAT study analyzed baseline characteristics and prognosis in HF patients categorized into 4 LVEF bands: 45% to 49%, 50% to 54%, 55% to 59%, and ≥ 60%. The results showed that the 45% to 49% LVEF group included a higher proportion of men and patients with ischemic heart disease than the groups with higher LVEF.16
Several registries and clinical trials have analyzed the prognosis and prognostic determinants of HF, reaching varying conclusions for both reduced and preserved LVEF.13,17–23 In general, populations with chronic HF and reduced LVEF tend to have significantly higher mortality than those with preserved LVEF; however, mortality tends to be similar in these 2 groups in registries that include hospitalized patients. Publications from the MAGGIC registry have reported a worse prognosis in HFrEF, but do not specify whether patients were inpatients or outpatients.17 In the OPTIMIZE-HF registry, HFrEF patients (LVEF < 40%) had slightly higher nonadjusted in-hospital mortality than patients with LVEF ≥ 40% (3.9 vs 2.9%, OR, 1.34; P < .0001); however, no differences were detected between the HF patient groups with 40% to 50% LVEF and > 50% LVEF (3 vs 2.9%, respectively; P = .65).13 No significant between-group differences were detected at the 60- to 90-day follow-up for either death or hospital readmission. A recent study of 19 000 Medicare patients with a main discharge diagnosis of HF examined duration of hospital stay and 30-day mortality and readmission rates in HFrEF and HFpEF patient groups. The results showed a slightly (10%) higher adjusted mortality rate in the HFrEF group, although readmission rates were similar between the 2 groups.15 Notably, in that study, patients were assigned to one HF class or another according to their discharge diagnosis code, without specification of the LVEF cutoff threshold used. Other studies that included hospitalized patients have reported a similar mortality in patients with reduced and preserved LVEF, with the main cause of death in both groups being HF-related (sudden death or HF progression); however, the HFpEF group had a higher rate of death due to noncardiovascular causes.18,19,22,23
The results of our study are in agreement with other reports in series of hospitalized patients, in that they reveal no significant differences in mortality during follow-up (1, 6, and 12 months) or in readmission for HF among HF patients with reduced, mid-range, or preserved LVEF. In our analysis, patient propensity scores were matched to minimize bias arising from an observational study of the effect of LVEF group, permitting more robust conclusions to be obtained from this kind of comparison.
LimitationsThe REDINSCOR II registry includes patients admitted to Spanish cardiology services with decompensated or de novo HF and who were monitored prospectively for 1 year. Our results are therefore limited to this patient category, which is underrepresented in the literature because most registries include outpatients with stable chronic HF or a mix of acute and chronic HF patients.
A notable number of patients (411; 22.4%) were excluded from the analysis because LVEF was not determined on admission or in the preceding 6 months; however, on comparison, this group showed no significant difference from the analyzed study population in terms of mortality or HF readmission.
A further point is that patients were assigned to an HF category based on LVEF recorded during hosptitalization, a period of clinical instability. LVEF progression during follow-up is thus unknown, and information is therefore lacking on patients who may have undergone dynamic changes in LVEF during this period, possibly recovering LVEF and changing category from HFrEF to HFmrEF or HFpEF. Most LVEF values (76.3%) were recorded during hospitalization, and LVEF values were reported by the investigators (cardiologists) at each participating center, without any cross-checking to control for measurement variability; it is thus possible that some patients might have been assigned to a different LVEF group than similar patients at another center, which might limit our results to some degree. The evaluated treatments are those prescribed at hospital discharge, and we are therefore also unable to confirm whether the therapeutic strategy was maintained throughout the follow-up period, a factor that could influence prognosis.
There may also be limitations related to the classification of cause of death, especially out-of-hospital death; nonetheless, this is the first study to describe the specific cause of death in HFmrEF patients, showing no significant differences from the other analyzed groups, either in the full study population or in the matched cohorts.
Although we found no statistically significant between-groups differences for the clinical parameters analyzed, our results may be somewhat limited by a lack of sufficient statistical power in these comparisons. Moreover, although propensity score matching is more robust than classic regression analysis, it has its weaknesses, such as the inability to correct for some unmeasured confounding factors, resulting in a degree of residual confounding.
CONCLUSIONSThis study presents the first description of the specific clinical and epidemiological characteristics and 1-year prognosis of patients hospitalized with HFmrEF. We found that this group shared characteristics with the other 2 patterns (HFrEF and HFpEF), although there was closer similarity to the HFpEF group. Over a 1-year follow-up, the 3 patient groups showed no differences in total mortality, cause of death, or hospital readmission for HF.
CONFLICTS OF INTERESTNone declared.
- –
The phenotypic classification of HF patients according to LVEF identifies groups with differing clinical characteristics. Evidence on treatment efficacy is limited to patients with HFrEF (LVEF < 40%) and information is lacking on the clinical characteristics and prognosis of patients with mid-range LVEF (HfmrEF; LVEF 40% to 49%). This patient group is included as a specific category in recent European Society of Cardiology (ESC) clinical practice guidelines.
- –
Analysis of the REDINSCOR II Registry indicates that HFmrEF patients show some clinical-therapeutic differences from those with HFrEF or HFpEF, but with a more similar profile to that of HFpEF patients. We observed no between-group differences during hospitalization or over 1 year of follow-up. This new classification does not appear to provide relevant information for guiding the clinical treatment of HF patients.
This study was supported by the Heart Failure Program of the Red de Investigación Cardiovascular del Instituto de Salud Carlos III, Madrid, Spain (RD12/0042) and the Fondo Europeo de Desarrollo Regional (FEDER).
The full list of researchers in the Red Española de Insuficiencia Cardiaca is available in the appendix of the Supplementary Material.