Keywords
INTRODUCTION
The development of programs for the quantification of myocardial perfusion scintigraphy (SPECT, single photon emission computed tomography) based on tomographic slices or representation on polar maps provides an important tool for the management of patients with ischemic heart disease.1-6 In order to improve accuracy when determining the location and extent of ischemic and necrotic regions of the left ventricle (LV), various quantitative methodologies have been applied to myocardial perfusion SPECT. In particular, systems for representing ventricular territories on the polar map and attributing them to the respective coronary arteries have been established by several study groups, such as those at Emory,7 Cedars-Sinai,8,9 and the Hospital Universitari Vall d'Hebron.10,11
Nevertheless, these methods do not provide exact localization of myocardial perfusion defects with the actual coronary territories of each patient. The series studied to obtain these maps were heterogeneous and included patients with multivessel disease as well as varying degrees of stenosis and collateral circulation. Consequently, in these polar maps the ischemia corresponding to a particular ventricular region is not precisely attributable to a specific coronary artery, but instead extends toward ventricular regions theoretically attributable to other coronary arteries.
The purpose of this study was to use myocardial perfusion SPECT to generate polar maps of ischemic myocardium for the true area at risk corresponding to the various coronary arteries, obtained by injecting technetium-radiolabeled tracers during occlusion of these arteries in the course of angioplasty. Technetium-radiolabeled tracers can be used for this purpose, as their pharmacokinetic and physical characteristics allow scintigraphic images to be obtained up to 6 hours after administration, indicating myocardial perfusion at the time of the injection.
PATIENTS AND METHODS
Patients
The study included 50 patients (5 women; mean age, 59.3±10.8 years; range, 33-78 years) with no history of infarction and predominantly single-vessel coronary disease, undergoing angioplasty. The patients were divided into 3 groups: a) 24 patients with stenosis of the left anterior descending (LAD) artery and further divided into 2 subgroups (pLAD group, containing 11 patients with proximal LAD stenosis, and mLAD group containing 13 patients with mid-LAD stenosis) depending on whether angioplasty was done in the proximal LAD, between the origin of the LAD and the first septal or first diagonal, or in the mid-LAD, up to the origin of the second diagonal; b) 15 patients with stenosis of the right coronary artery (RCA), and c) 11 patients with stenosis of the circumflex artery (CX).
All 50 patients underwent a single coronary angioplasty of the culprit lesion and stent placement by clinical indication, and a myocardial perfusion SPECT study with technetium-radiolabeled tracers using the methodology described below. The study protocol was approved by the ethics committee of the hospital.
Coronary Angioplasty
All studies were performed using the Philips Systems/Optimus M200 biplane system, selecting the two views in which coronary vasculature stenosis was best visualized. Ten to fifteen seconds after starting total inflation of the balloon, 25 mCi of 99mmethoxyisobutyl-isonitrile (32 patients) or 99mtetrofosmin (18 patients) were injected intravenously. Balloon inflation was maintained for approximately 90 seconds. The studies were saved on CD-ROM using the DICOM system.
Myocardial Perfusion SPECT
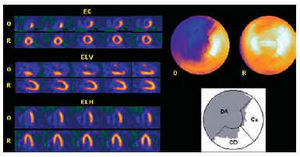
In the Nuclear Medicine Department, the occlusion images of each artery were obtained 60-90 min after the radiopharmaceutical was injected, using an Elscint SP4 gamma camera equipped with a high-resolution collimator and 180° semicircular orbit in step-and-shoot mode, starting at the right anterior oblique angle at 30° and with 20-s detection every 3°. The tomographic reconstruction was done using a 5th order Butterworth filter and frequency of 0.4, obtaining short axis, horizontal long axis and vertical long axis slices,12,13 as well as the respective polar maps (Figure 1).10,11 No corrections were made for attenuation or scatter.

Fig. 1. Myocardial perfusion SPECT obtained by administering technetium-radiolabeled tracer during proximal occlusion of the left anterior descending (LAD) artery. The short axis (SA), vertical long axis (VLA) and horizontal long axis (HLA) tomographic slices of the coronary occlusion (O), and baseline at rest (R) are shown on the left. The polar map of ischemia (above) shows the location and extent of the area at risk (uptake <50% of maximum), which corresponds to 67% of the entire left ventricle. The lower polar map shows that the extent of ischemia corresponds to 99% of the region attributed to the LAD in the polar map of the Hospital Universitari Vall d'Hebron,10,11 but also extends partially to the region attributed to the right coronary (RCA) and the circumflex (CX).
Baseline images were obtained at rest between 24 h and 48 h after the angioplasty to confirm that there had been no hypoperfusion at rest.
Image Analysis
After the polar maps had been obtained, the extent of the area at risk due to coronary occlusion was assessed using the SPECT images. Extent was defined as the percentage of left ventricular region with uptake <50% of maximum.14 The extent of the territory attributable to the LAD, RCA and CX was also calculated from the polar map of the Hospital Universitari Vall d'Hebron.10,11 In this map, 56% of the entire left ventricle is attributed to the LAD (anterior, septal and apical regions), 23% to the RCA (inferior region), and 21% to the CX (lateral region). By superimposing the contours of the ischemic area of all the areas at risk for each artery, the distribution and extent of the maximum territory potentially attributable to each coronary artery was obtained. The percentage of hypoperfused territory of the artery analyzed that corresponded to regions attributed to the other arteries on this polar map was also assessed (Figure 1).
Statistical Analysis
SPSS for Windows 98, Version 8.0, was used for the data analysis.15 The quantitative variables were studied using the mean and the standard deviation, and the qualitative variables using the frequency distribution of each category. Mean values for the sample were compared by Student's t test. Significance was set at a P value of less than 5% (P<.05).
RESULTS
Cardiac Catheterization
In the LAD group, 18 patients presented right dominance, 5 left dominance and 1 (patient 7) mixed dominance. Six patients with less than 70% stenotic lesions of the RCA and/or CX in this group were not revascularized. Left ventricular ejection fraction on contrast ventriculography was 70.1%±8.2%.
In the RCA group, there was right dominance in all patients. Four patients with less than 70% stenotic lesions of the LAD and/or CX in this group were not revascularized. Left ventricular ejection fraction on contrast ventriculography was 73.1%±11.7%.
In the CX group, there was right dominance in nine patients and mixed dominance in one (patient 3). Two patients with less than 70% stenotic lesions of the LAD and/or RCA in this group were not revascularized. Left ventricular ejection fraction on contrast ventriculography was 72.6%±11.1%.
No patient showed an intermediate or bisecting branch between the origins of the LAD and CX. No homocoronary or heterocoronary collateral circulation was observed in any of the arteries treated with angioplasty.
Myocardial Perfusion SPECT
The overall extent (percentage) of the perfusion defects due to proximal and distal LAD occlusion is shown in Table 1.10,11 The extent of the ischemic territory in the pLAD group (49.8%±10.3%) was greater than in the mLAD group (39.8%±8.3%), although the difference was not statistically significant (P=1). On the polar map, 6 patients in the pLAD group showed hypoperfusion below the maximum found in the mLAD group (51%). In this latter group, 10 patients showed an extent (percentage) above the minimum found in the proximal LAD group (35%). Table 1 shows the percentages of hypoperfused region extending to the LAD, RCA, and CX regions according to the polar map of the Hospital Universitari Vall d'Hebron.10,11 It can be observed that more than 20% of ischemic region in the LAD artery corresponds to the RCA region on the Hospital Universitari Vall d'Hebron map and around 10% to the CX region. The minimum and maximum extents of the perfusion defects found on the polar map of the proximal and medial occlusions of the LAD are shown in Figure 2 A and B.


Fig. 2. Location and minimum and maximum extent (in gray) of the occlusion area of proximal (pLAD) (A) and mid (mLAD) left anterior descending artery (B) superimposed on the regions attributed to the LAD, right coronary (RCA), and circumflex (CX) of the Hospital Universitari Vall d'Hebron polar map.
The overall extent (percentage) of the perfusion defects in RCA occlusions are shown in Table 2.10,11 The mean extent of hypoperfused region in the RCA group was 20%±7.6%. Table 2 also contains the percentages of hypoperfused territory extending to the regions attributed to the LAD, RCA, and CX on the Hospital Universitari Vall d'Hebron polar map. The percentage of ischemic region attributed to the LAD region according to the Hospital Universitari Vall d'Hebron map was 15.2%±4.2%. The minimum and maximum extent of the perfusion defects found on the polar map of RCA occlusions is shown in Figure 3.


Fig. 3. Location and minimum and maximum extent (in gray) of the occlusion area of right coronary artery (RCA) superimposed on the regions attributed to the LAD, RCA and circumflex (CX) of the Hospital Universitari Vall d'Hebron polar map.
The overall extent (percentage) of the perfusion defects in CX occlusions is shown in Table 3.10,11 The mean extent of hypoperfused region in the CX group was 23.4%±7.6%. Table 3 also contains the percentages of hypoperfused territory extending to the regions attributed to the LAD, RCA, and CX on the Hospital Universitari Vall d'Hebron polar map. The percentage of ischemic region within the region attributed to the RCA was almost 50%, higher even than that of the CX (27.4%±20.9%). The minimum and maximum extents of the perfusion defects found on the polar map of the CX occlusions are shown in Figure 4. Note that the ischemic region in the patient with the smallest extent of myocardium at risk due to CX occlusion is located entirely in the territory attributed to the RCA, according to the Hospital Universitari Vall d'Hebron map.


Fig. 4. Location and minimum and maximum extent (in gray) of the occlusion area of circumflex (CX) arteries superimposed on the regions attributed to the left anterior descending (LAD), right coronary artery (RCA), and CX of the Hospital Universitari Vall d'Hebron polar map.
Figure 5 shows the superimposed regions of the areas at risk corresponding to the LAD and RCA, the LAD and CX, and the RCA and CX on the polar maps. Note that there is considerable overlap between myocardium at risk for the LAD and the RCA in the inferoseptal and inferoapical territories, and between the RCA and the CX in the inferior territory.

Fig. 5. Superimposition (in black) between the maximum extent of the area at risk of the left anterior descending (LAD) artery and the right coronary artery (RCA), between that of the LAD and the circumflex (CX) and between that of the RCA and the CX. Note that the extent of this territory is larger between the RCA and CX and smaller between the CX and the LAD.
DISCUSSION
From the diagnostic standpoint, interpretation of myocardial perfusion SPECT is mainly based on visual assessment of the tomographic slices. However, for purposes of prognostic stratification and decision-making regarding management of patients with ischemic heart disease, it is increasingly necessary to quantify the severity and extent of myocardium at risk. For this reason, representation of perfusion defects on polar maps, which allows the extent of myocardial ischemia to be readily quantified, has gained wide acceptance in clinical practice.
Several methodologies have been developed for creating polar maps, and different delimitations of the coronary regions have been described. The methods developed at Emory7 and Cedars-Sinai are the most widely known and implemented.8,9 In the former, the LAD territory extends from 0° to 160° (counter-clockwise direction), the RCA from 160° to 270°, and the CX from 270° to 0°. In the Cedars-Sinai method, all segments with a probability ≥80% of corresponding to a specific coronary artery are grouped together to represent the territory for this artery on the polar map. According to this system, the LAD territory includes the anterior, septal and apical areas of the LV, the RCA includes the lower and inferoseptal area , and the CX, the lateral area. On this map, the borders of the various coronary regions do not come into contact, such that there is a section not attributed to any specific coronary artery. However, on the Hospital Universitari Vall d'Hebron polar map10,11 used as a reference in this study, the model for the assignment of perfusion defects to each coronary artery was developed to avoid excluding any borderline area between the various coronary territories. Therefore, the sum of the 3 arterial regions correspond to the entire LV (LAD=56%, RCA=23%, and CX=21%) (Figure 6).

Fig. 6. Percentage of territories attributed to the various coronary arteries in the polar maps of Emory, Cedars-Sinai and Hospital Universitari Vall d'Hebron. RCA indicates right coronary artery; CX, circumflex artery; LAD, left anterior descending artery.
Limitations of Conventional Polar Maps
The representation of the various coronary territories on the three polar maps cited is highly rigid, and therefore the wide variety of anatomical forms potentially found in the coronary vasculature is logically hard to represent. In the Emory map,7 when there is a perfusion defect that produces overlap at the border between 2 coronary territories, the defect is assigned to the artery with the largest defect, and if the defect extends more than 45° toward another territory, then disease of the 2 coronary arteries corresponding to both regions is considered to exist. Defects located only in the apical region are not assigned to any specific artery. In the Cedars-Sinai method,8,9 the areas between the various coronary regions considered of low specificity for a specific coronary artery are not included in the overall assessment of perfusion defects. Therefore, the sum of the various regions attributed to each of the arteries in this map does not correspond to the entire left ventricle (LV), a fact that hinders overall assessment of the percentage of jeopardized left ventricular myocardium. The representation on the Hospital Universitari Vall d'Hebron polar map10,11 resolves this limitation, but still provides a stereotyped and rigid configuration of the various coronary territories.
Polar Maps Obtained During Occlusion of Coronary Arteries
The purpose of this study was to achieve a polar map showing the true extent of jeopardized myocardial region by occlusion of the various coronary arteries. This was possible by injecting a technetium-radiolabeled tracer during occlusion in the course of angioplasty. During occlusion we were able to delimit the various contours of the area corresponding to the ischemic region, that is, the territory that would be jeopardized by potential occlusion of the artery at the point where angioplasty is performed.
This methodology, which has been previously used experimentally16 and clinically,17-21 allowed us to determine that the maximum extent of the areas at risk of the LAD (67%), RCA (35%), and CX (33%) is larger than has been attributed to these arteries on previously reported polar maps. This is due to territorial overlap, mainly occurring between the LAD and the RCA, and between the RCA and the CX (Figure 5). Hence, the inferior region may often correspond to the circumflex, and the inferoapical and inferoseptal to the LAD. This superimposition of territories explains why the diagnostic efficacy of SPECT may have certain limitations for the detection of the culprit lesion22 and the diagnosis of multivessel disease.23-27
It has also been observed that the extent on the polar map of myocardium jeopardized by some mid-LAD occlusions may be larger than that of some proximal LAD occlusions of the same artery. This means that the actual extent of the myocardium at risk is often not specified with angiographic cataloguing alone. The extent of the area at risk corresponding to occlusion of the proximal LAD can range from 35% to 67% of the entire LV, whereas in the mid-LAD it could be 20% to 51%, in the RCA, 8% to 35%, and in the CX, 10% to 33%.
Since the perfusion images were acquired with no attenuation correction of any kind, the extent of smaller defects may have been overestimated because of diaphragmatic interposition. Nevertheless, the baseline images of these patients at rest did not show lower uptake, which makes this possibility unlikely. In addition, when uptake is located near the left ventricle, the distribution of radiotracers in extracardiac regions can also lead to distortion. However, since the coronary occlusion images were obtained late (>1 h) in our series, there was very little infradiaphragmatic uptake with either methoxyisobutyl-isonitrile or tetrofosmin.
From the clinical standpoint, the ideal approach would probably be an individualized coronary angiography polar map that could be compared to the map of the ischemic area obtained with myocardial perfusion SPECT. Perhaps future programs providing a fusion of perfusion SPECT with contrast coronary angiography, computed tomography angiography or magnetic resonance coronary angiography will allow this possibility.28 Similarly, methods to represent coronary angiography results on a polar map may be developed just as myocardial perfusion SPECT polar maps were developed. Svane et al29 has described a method for this purpose, and other teams30 are working on 3-dimensional superimposition of coronary angiography and myocardial perfusion scintigraphy findings. In the future, the development of new computer programs will enable rapid creation of individualized polar maps, and the cardiologist will be able to superimpose the coronary angiography polar map on the myocardial perfusion polar map or vice versa, depending on which examination is performed first.
CONCLUSIONS
Obtaining polar maps of myocardial perfusion generated by injecting tracer during coronary artery occlusion in the course of an angioplasty makes it possible to delimit the contours of area at risk according to the coronary distribution of each patient and to measure the jeopardized territory. The distribution and extent of the ischemic area for each coronary artery differs from those established in the classic polar maps conventionally used in clinical practice.
Correspondence: Dr. J. Candell-Riera.
Servicio de Cardiología. Hospital Universitari Vall d'Hebron.
Pg. Vall d'Hebron, 119-129. 08035 Barcelona. España.
E-mail: jcandell@vhebron.net